

Medical Properties Trust Inc. stocks have been trading down by -8.22 percent amid renewed concerns over tenant stability and liquidity.
Key Takeaways
- Price action in Medical Properties Trust Inc. has broken down from the $3.00 area to near $2.06, putting MPT squarely back in a downtrend.
- Intraday trading shows tight consolidation around $2.05–$2.10, signaling a tug of war between dip-buyers and shorts on MPT.
- Heavy leverage on the balance sheet keeps debt risk front and center for MPT traders despite solid liquidity.
- Recent filings show MPT generating strong operating cash flow but still posting a small net loss, highlighting execution risk.
- Active traders are watching whether MPT can hold the low-$2s or if the next leg lower opens up.
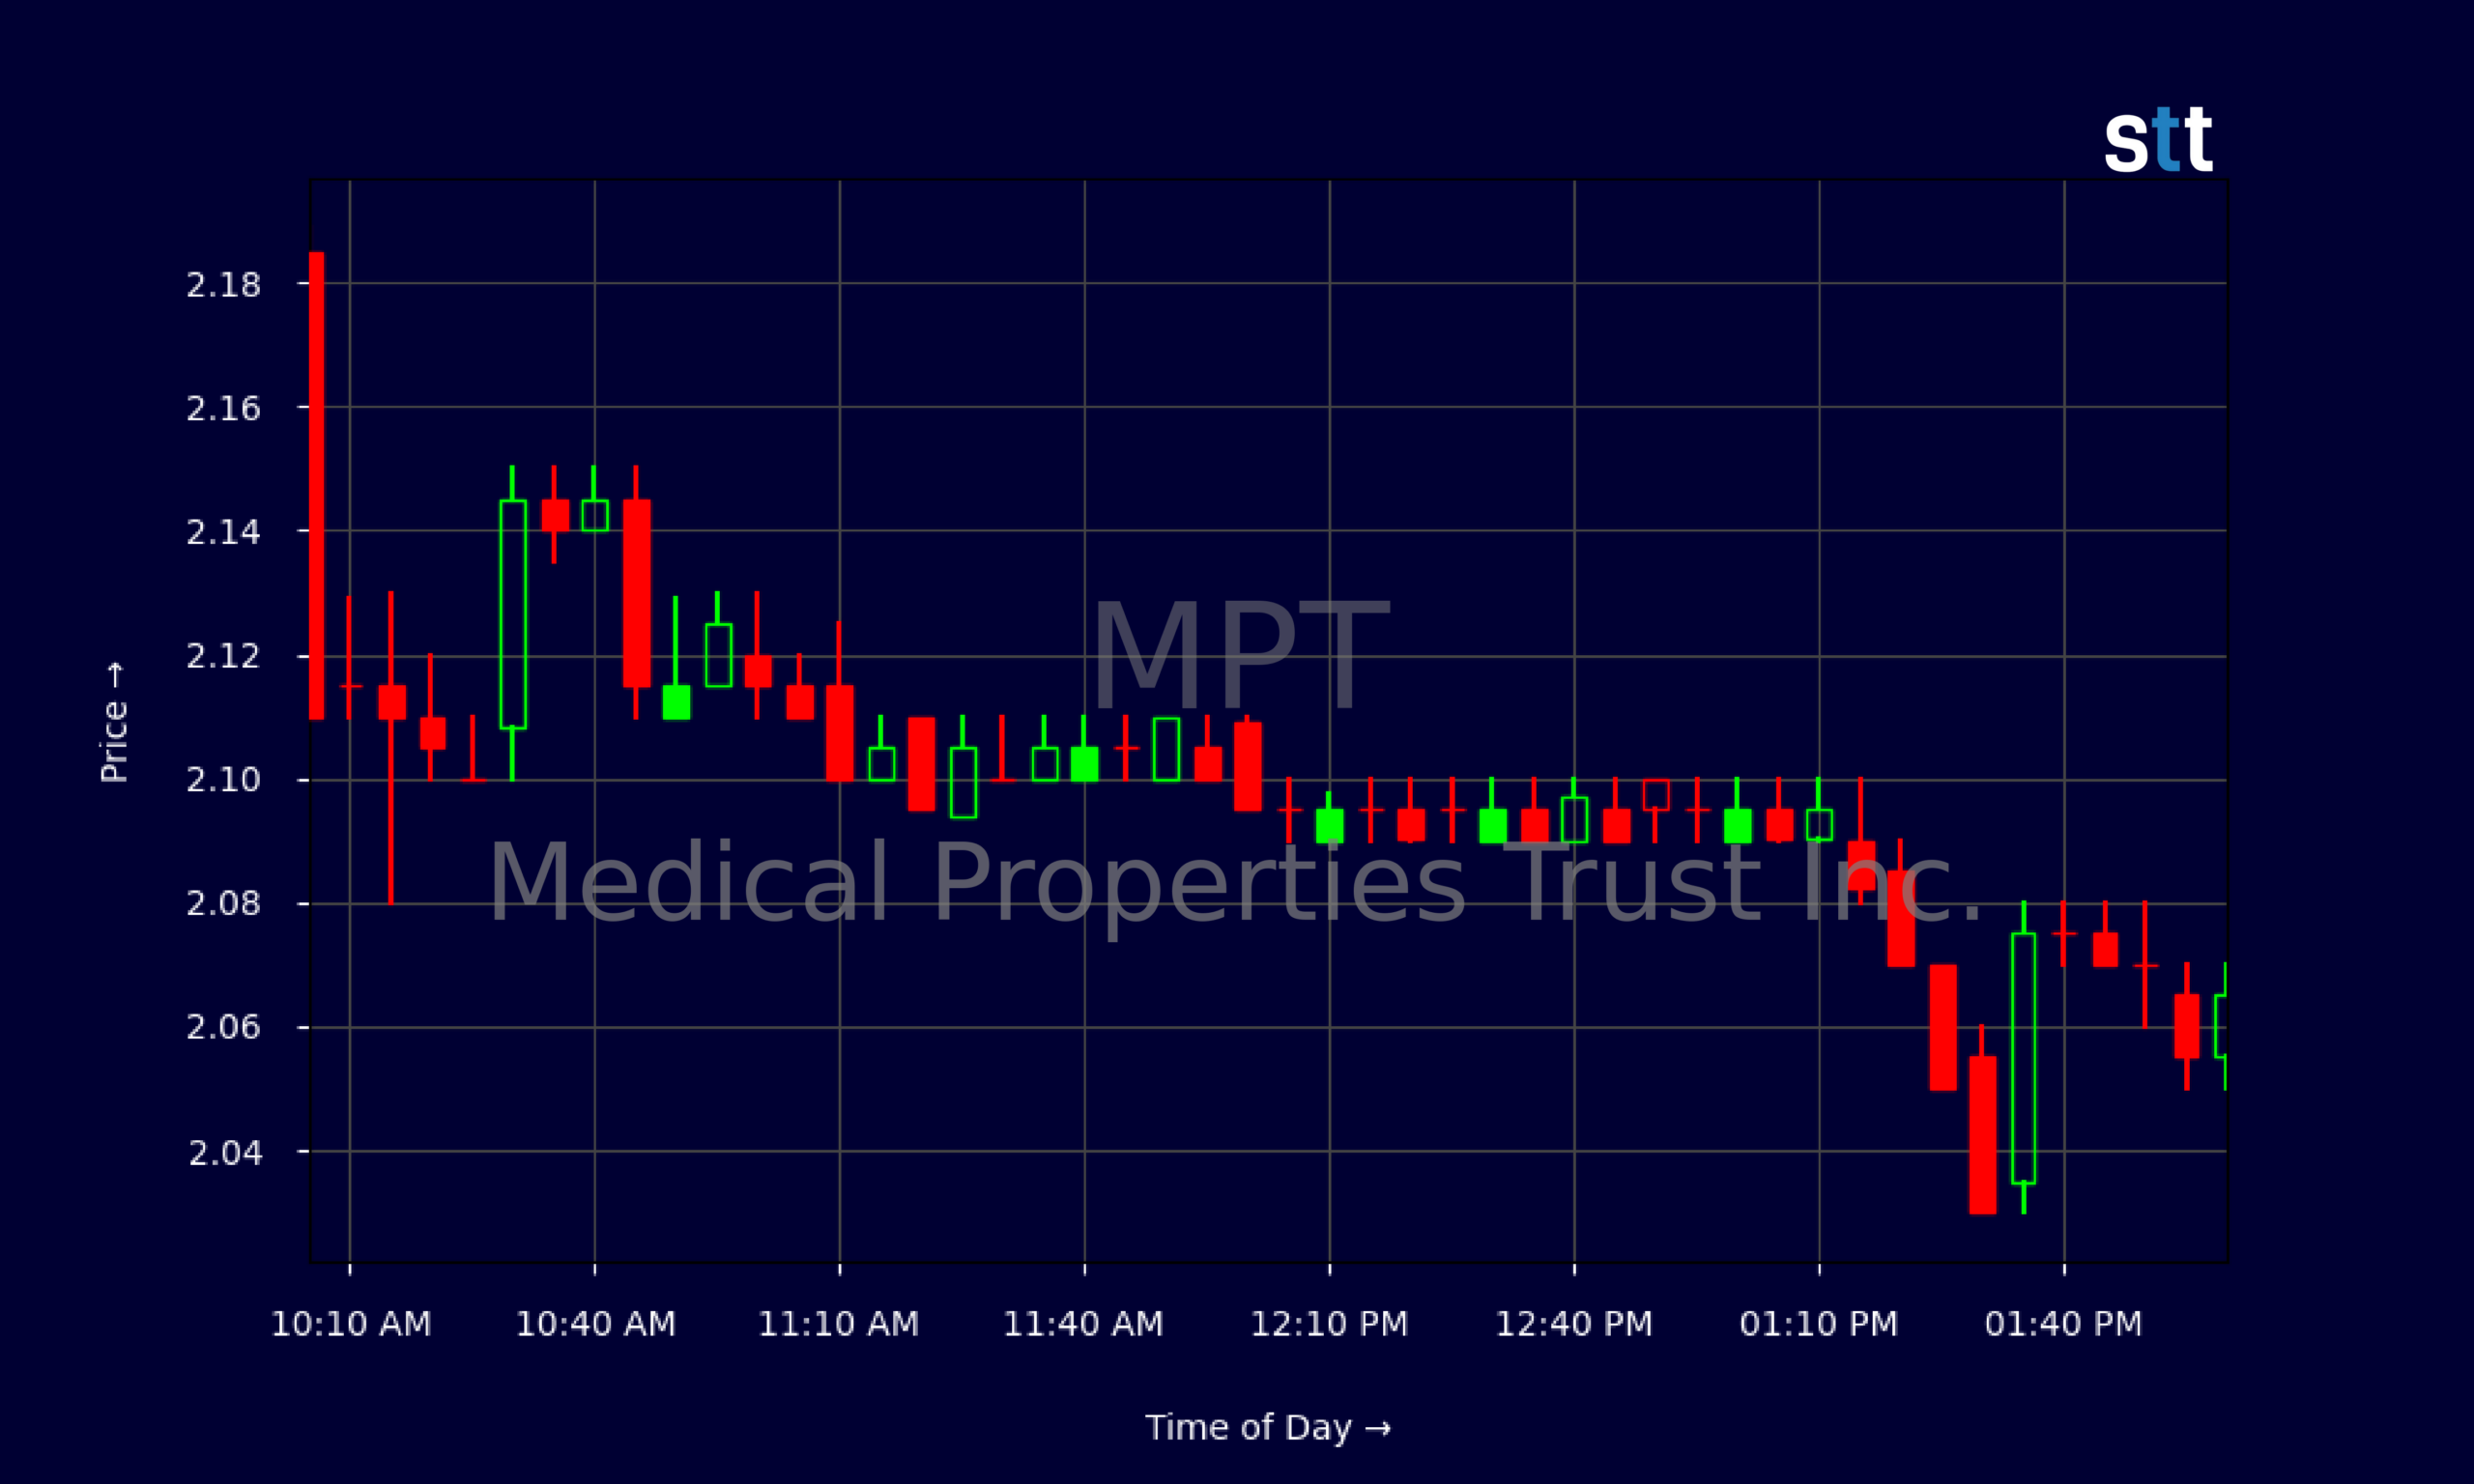
Live Update At 14:02:39 EST: On Monday, November 02, 2026 Medical Properties Trust Inc. stock [NYSE: MPT] is trending down by -8.22%! Discover the key drivers behind this movement as well as our expert analysis in the detailed breakdown below.
Quick Financial Overview
Medical Properties Trust Inc. is trading like a beaten-down REIT trying to find its footing. The daily chart for MPT shows a clear slide from closes near $3.20 on 2026/10/08–09 down to about $2.07 on 2026/11/02. That’s roughly a one‑third drawdown in a few weeks, a big hit for any income-focused real estate name. Each bounce toward $3.00 has been sold, telling traders the trend is still down.
On the numbers, MPT booked about $259.3M in total revenue last quarter with a gross margin above 97%. That looks impressive, but the story changes lower on the income statement. After heavy interest costs and write-downs, Medical Properties Trust Inc. reported a small net loss of about $2.6M, with EPS at roughly -$0.01. For traders, that means cash is coming in, but debt service and charges are eating most of it.
More Breaking News
- CRMD Slides Sharply As Traders Eye Support Levels
- WING Stock Jumps As Traders Bet On Global Growth Story
- RKT Stock Jumps As Earnings Beat Fuels Housing Momentum
- RIVN Stock Pops As Earnings Beat And AI Push Shift Sentiment
The balance sheet for MPT shows about $14.7B in assets and $10.2B in total liabilities, including roughly $9.0B of long‑term debt. A price‑to‑book around 0.42 tells traders the market is heavily discounting that asset base. Cash and equivalents near $397M, plus a current ratio around 3.0, give Medical Properties Trust Inc. decent short‑term flexibility, but high leverage keeps the risk premium elevated.
Why Traders Are Watching MPT Price Action
The tape on Medical Properties Trust Inc. is telling a very clear story. MPT spent mid‑October grinding sideways between roughly $3.00 and $3.20. Then the floor gave way. Closes stepped down from $3.14–$3.19 to the $2.80s, then $2.70s, and now the low‑$2s, with the latest daily candle opening at $2.25 and closing near $2.07. That kind of stair‑step lower is textbook distribution.
Zoom into the 5‑minute chart and you see a different game. Early in the session, MPT traded around $2.25–$2.26, but sellers pushed it down toward $2.18, then $2.10. After that flush, Medical Properties Trust Inc. spent hours stuck between roughly $2.09 and $2.11, then slowly bled toward $2.06. Tight intraday ranges like this usually signal consolidation after a strong move — either a pause before continuation or a base forming for a bounce.
With MPT, the broader context matters. The company’s debt‑to‑equity ratio around 2.19 and interest coverage near 1.0 show that Medical Properties Trust Inc. is walking a thin line on leverage. At the same time, operating cash flow of about $62.4M last quarter and free cash flow that matches that number tell traders MPT still throws off real cash. The dividend, at roughly $0.09 for the quarter and a high trailing yield, looks tempting on paper, but past cuts remind traders not to rely on headline yields alone.
For momentum‑focused traders, MPT’s sharp drop and low absolute share price under $3.00 make it a natural watchlist name. It trades like a classic beaten‑down chart where squeezes can be sharp, but so can the rug pulls.
Conclusion
Medical Properties Trust Inc. sits in that tricky zone where fundamentals and chart action are pulling in opposite directions. On one hand, MPT trades at a steep discount to book value, posts very high gross margins, and still generates solid operating cash flow. On the other, leverage is heavy, net income is negative, and the stock has been punished from the $3s down to near $2.00 in a matter of weeks.
For short‑term traders, that setup can be attractive. MPT offers volatility, clear technical levels, and a story the market already views with skepticism. The key is to treat Medical Properties Trust Inc. like any other volatile REIT trade: map your levels, respect the trend, and don’t marry a bias. As Tim Bohen, lead trainer with StocksToTrade says, “A consistent trading routine beats sporadic action every time. Show up daily, and you’ll start to see the patterns others miss.” The low‑$2 area is the first battleground; a firm break below there would keep pressure on, while a reclaim of $2.50–$2.70 would signal strength.
Tim Sykes always says, “Cut losses quickly; small losses are part of the game, big losses are unacceptable.” That mindset fits MPT perfectly. Medical Properties Trust Inc. offers opportunity, but only for traders who stay disciplined, size appropriately, and let the price action — not hope — call the shots.
This is stock news, not investment advice. StocksToTrade News delivers real-time stock market updates tailored to highlight the key catalysts driving short-term price movements. Our coverage is designed for active traders and investors who thrive in fast-moving markets, with a focus on volatile sectors like penny stocks, AI stocks, Robinhood stocks and other momentum plays. From earnings reports and FDA approvals to mergers, new contracts, and unusual trading volume, we break down the events that can spark significant price action.
Looking to level up your trading game? Explore StocksToTrade, the ultimate platform for traders. With powerful tools designed for swing and day trading, integrated news scanning, and even social media monitoring, StocksToTrade keeps you one step ahead.
Check out our quick startup guide for new traders!
- How to Read Stock Charts: A Guide for Beginners
- Trading Plan: 6 Steps to Create One
- How To Create a Stock Watchlist
Ready to build your watchlists? Check out these curated lists:
Once your watchlist is set, take the next step and trade with confidence using StocksToTrade’s robust platform. Don’t miss out — grab your 14-day trial for just $7 and experience the edge you need to thrive in today’s fast-paced markets.