

Medical Properties Trust Inc. stocks have been trading down by -14.14 percent following renewed concerns over tenant financial stability.
Key Takeaways
- Shares of Medical Properties Trust Inc. have faded from roughly $3.30 to near $2.10 this month, putting MPT deep in a downtrend on the daily chart.
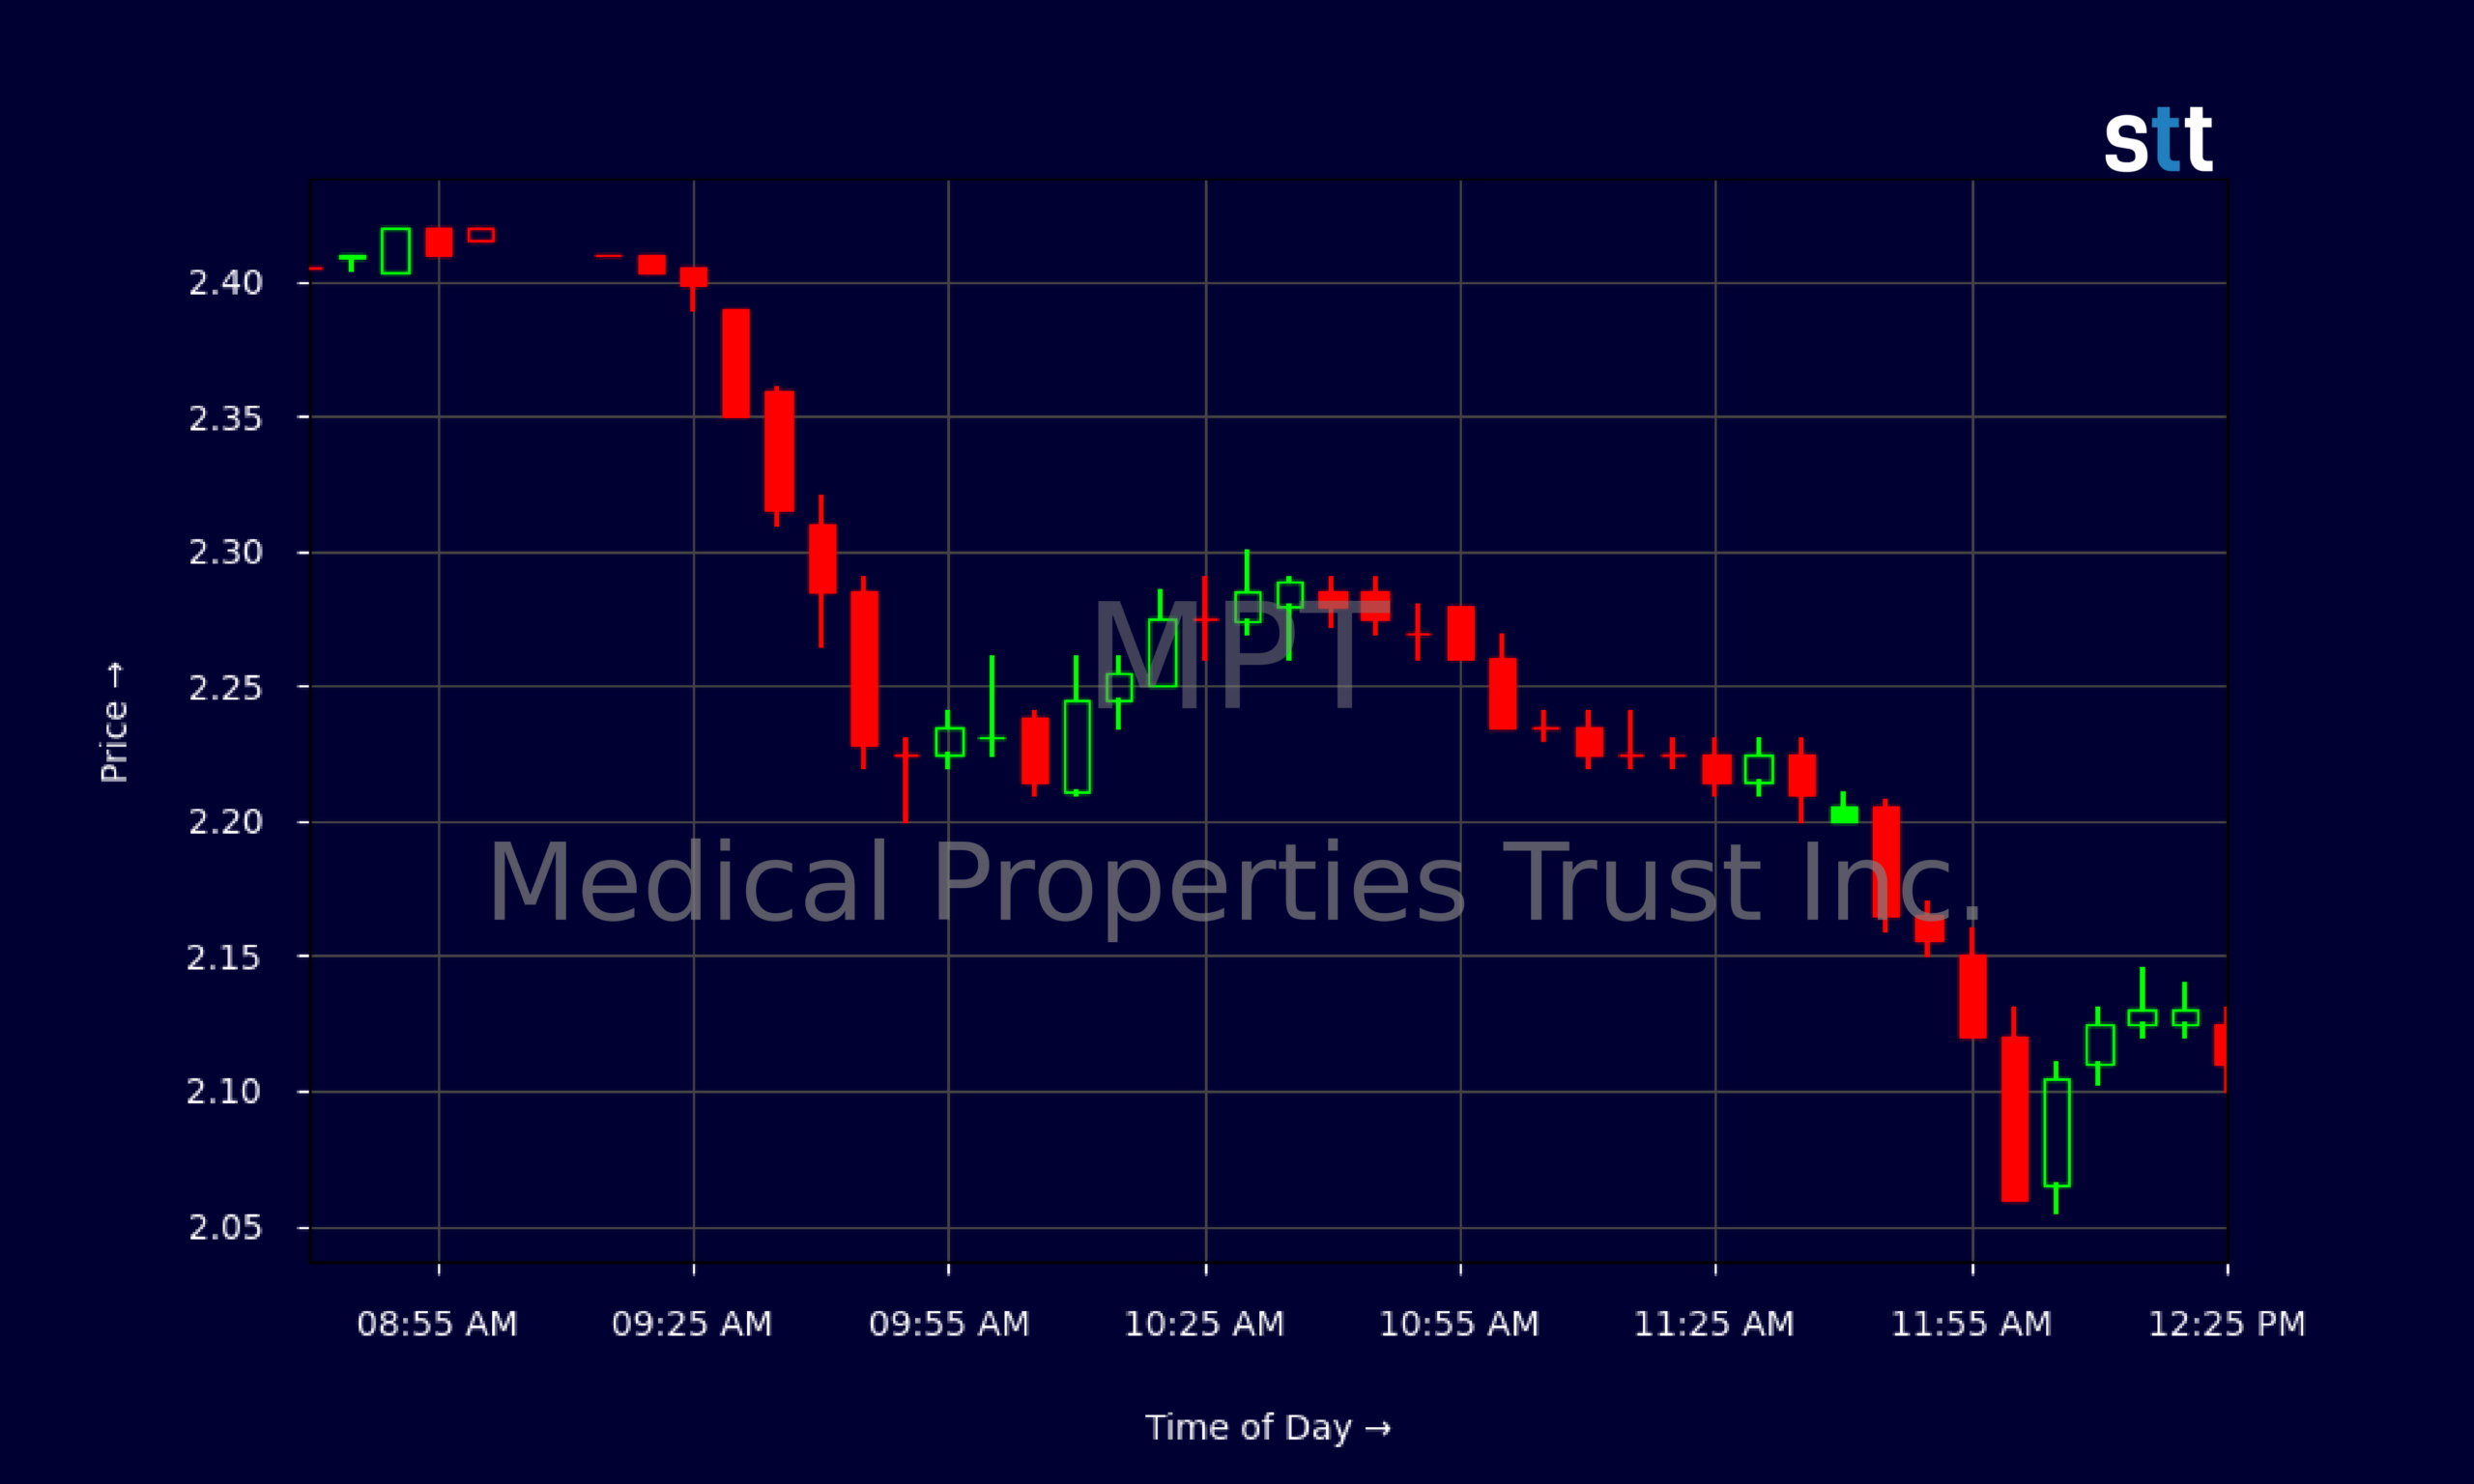
- Intraday trading shows MPT selling pressure from the open, then grinding lower in tight ranges, a classic heavy-supply pattern short-biased traders watch.
- The latest report shows about $396.6M in cash against roughly $9.0B in long-term debt, keeping leverage front and center for MPT traders.
- MPT is generating positive operating cash flow and free cash flow, but GAAP net income remains slightly negative, signaling a complex turnaround story.
- With price near a fraction of stated book value, MPT attracts bargain hunters while momentum traders focus on breakdown and bounce setups.
Live Update At 12:33:57 EDT: On Friday, October 30, 2026 Medical Properties Trust Inc. stock [NYSE: MPT] is trending down by -14.14%! Discover the key drivers behind this movement as well as our expert analysis in the detailed breakdown below.
Quick Financial Overview
Medical Properties Trust Inc. is a highly leveraged real estate name trading like a distressed turnaround. The latest numbers show MPT with total assets around $14.7B and equity just under $4.5B, which implies a book value per share near $7.53. Yet the stock is trading a little above $2.00. That’s a steep discount, and traders notice when price sits at roughly one‑third of book.
On the income side, MPT posted about $259.3M in quarterly revenue with a huge gross margin near 97%. But after interest and other charges, net income flips to a small loss of roughly $2.6M, or about -$0.01 per share. This split personality—strong operating profile, weak bottom line—is driving a lot of the current MPT debate.
More Breaking News
- MPT Stock Slides As Traders Focus On Debt And Cash Flow
- CROX Stock Jumps As Barclays Sees Multi-Year Growth
- CareDx CDNA Rips Higher After Big Earnings Beat And Guidance Hike
- BMNR Stock Holds Key Range As Traders Track Cash-Fueled Turnaround
Cash flow tells a slightly better story. Medical Properties Trust Inc. generated about $62.4M in operating cash flow and similar free cash flow, even after paying roughly $54.3M in dividends. Debt remains heavy, with long-term obligations near $9.0B and a total‑debt‑to‑equity ratio over 2.0. For active traders, MPT is all about whether cash flow can outrun interest expense and keep the story alive.
Why Traders Are Watching MPT Price Action
The chart is why short-term traders have MPT on their screens. On the daily timeframe, Medical Properties Trust Inc. has bled from the low‑$3s to just over $2.00 in a couple of weeks. That’s roughly a 35% drawdown, and big percentage moves attract momentum traders every time. Each bounce around $3.10–$3.30 failed, and MPT rolled over day after day, signaling persistent selling.
Look closer at the most recent session. MPT opened near $2.39 and quickly lost its grip, sliding into the low $2.30s, then into the $2.20s, and ultimately printing a closing trade near $2.10. The intraday 5‑minute chart shows a heavy open, failed push toward $2.36, and then a series of lower highs and lower lows. That’s textbook intraday weakness. Dip buyers tried to stabilize MPT around $2.20–$2.25 mid‑day, but every bounce was sold.
For day traders, this kind of action in Medical Properties Trust Inc. sets up clean risk/reward levels. Prior support in the $2.70–$2.80 range has turned into clear resistance. Any spike back toward that zone is a potential short area as long as the broader trend in MPT points down. On the flip side, if MPT stabilizes above $2.00 and starts building higher lows, breakout traders will watch for a squeeze back toward the mid‑$2s.
What makes MPT especially interesting is the tension between technical pain and deep‑value metrics. Some traders see a falling knife. Others see a capital structure that might support a bounce. That tug‑of‑war is where the best trading opportunities usually show up.
Conclusion
Medical Properties Trust Inc. is not trading like a sleepy income REIT. It’s trading like a battleground story where debt, cash flow, and sentiment collide every day on the tape. Balance‑sheet data shows MPT with about $396.6M in cash and more than $9.0B in long‑term debt, plus a current ratio near 3.0. So there is liquidity, but leverage dominates the narrative.
At the same time, MPT is still throwing off positive operating cash flow and maintaining a dividend of roughly $0.09 per quarter in the latest report. That combination—tiny earnings loss, positive cash, and a high headline yield—keeps yield‑focused traders and short sellers locked into the same name, studying every tick. It’s the kind of setup where disciplined preparation matters more than hot takes or headline chasing. As Tim Bohen, lead trainer with StocksToTrade says, “Preparation is half the trade. By the time the bell rings, my decisions are nearly made.”
For active traders, the game plan with Medical Properties Trust Inc. is simple, but not easy. Let the price action lead. Track key levels around $2.00 on the downside and the $2.70–$3.00 band on the upside, then plan entries around those inflection points with tight risk.
Tim Sykes loves to remind his community, “The market doesn’t care about your opinion, only your preparation.” MPT is a live example of that mindset. Study the filings, map the chart, respect the downtrend, and treat every trade in Medical Properties Trust Inc. as a planned lesson, not a prediction. This is education and research, not advice—and the market will grade your risk management in real time.
This is stock news, not investment advice. StocksToTrade News delivers real-time stock market updates tailored to highlight the key catalysts driving short-term price movements. Our coverage is designed for active traders and investors who thrive in fast-moving markets, with a focus on volatile sectors like penny stocks, AI stocks, Robinhood stocks and other momentum plays. From earnings reports and FDA approvals to mergers, new contracts, and unusual trading volume, we break down the events that can spark significant price action.
Looking to level up your trading game? Explore StocksToTrade, the ultimate platform for traders. With powerful tools designed for swing and day trading, integrated news scanning, and even social media monitoring, StocksToTrade keeps you one step ahead.
Check out our quick startup guide for new traders!
- How to Read Stock Charts: A Guide for Beginners
- Trading Plan: 6 Steps to Create One
- How To Create a Stock Watchlist
Ready to build your watchlists? Check out these curated lists:
Once your watchlist is set, take the next step and trade with confidence using StocksToTrade’s robust platform. Don’t miss out — grab your 14-day trial for just $7 and experience the edge you need to thrive in today’s fast-paced markets.