

Li Bang International Corporation Inc. surged as stocks have been trading up by 10.69 percent following highly favorable news.
What Traders Need To Know
- Price has been stuck in a tight weekly range between roughly $2.96 and $3.35, signaling consolidation after recent swings.
- Intraday action shows a wide $4.09 high to $2.84 low range, with a close near the middle, hinting at active but indecisive trading.
- Revenue of about $11.1M and an enterprise value near $12.4M put Li Bang International Corporation Inc. at a low price-to-sales multiple.
- Leverage is notable, with a leverage ratio of 3.5 and current debt over $8.4M, making balance sheet risk a key focus.
- Traders in LBGJ are watching whether price can hold above recent lows while the company works against negative recent return on capital.
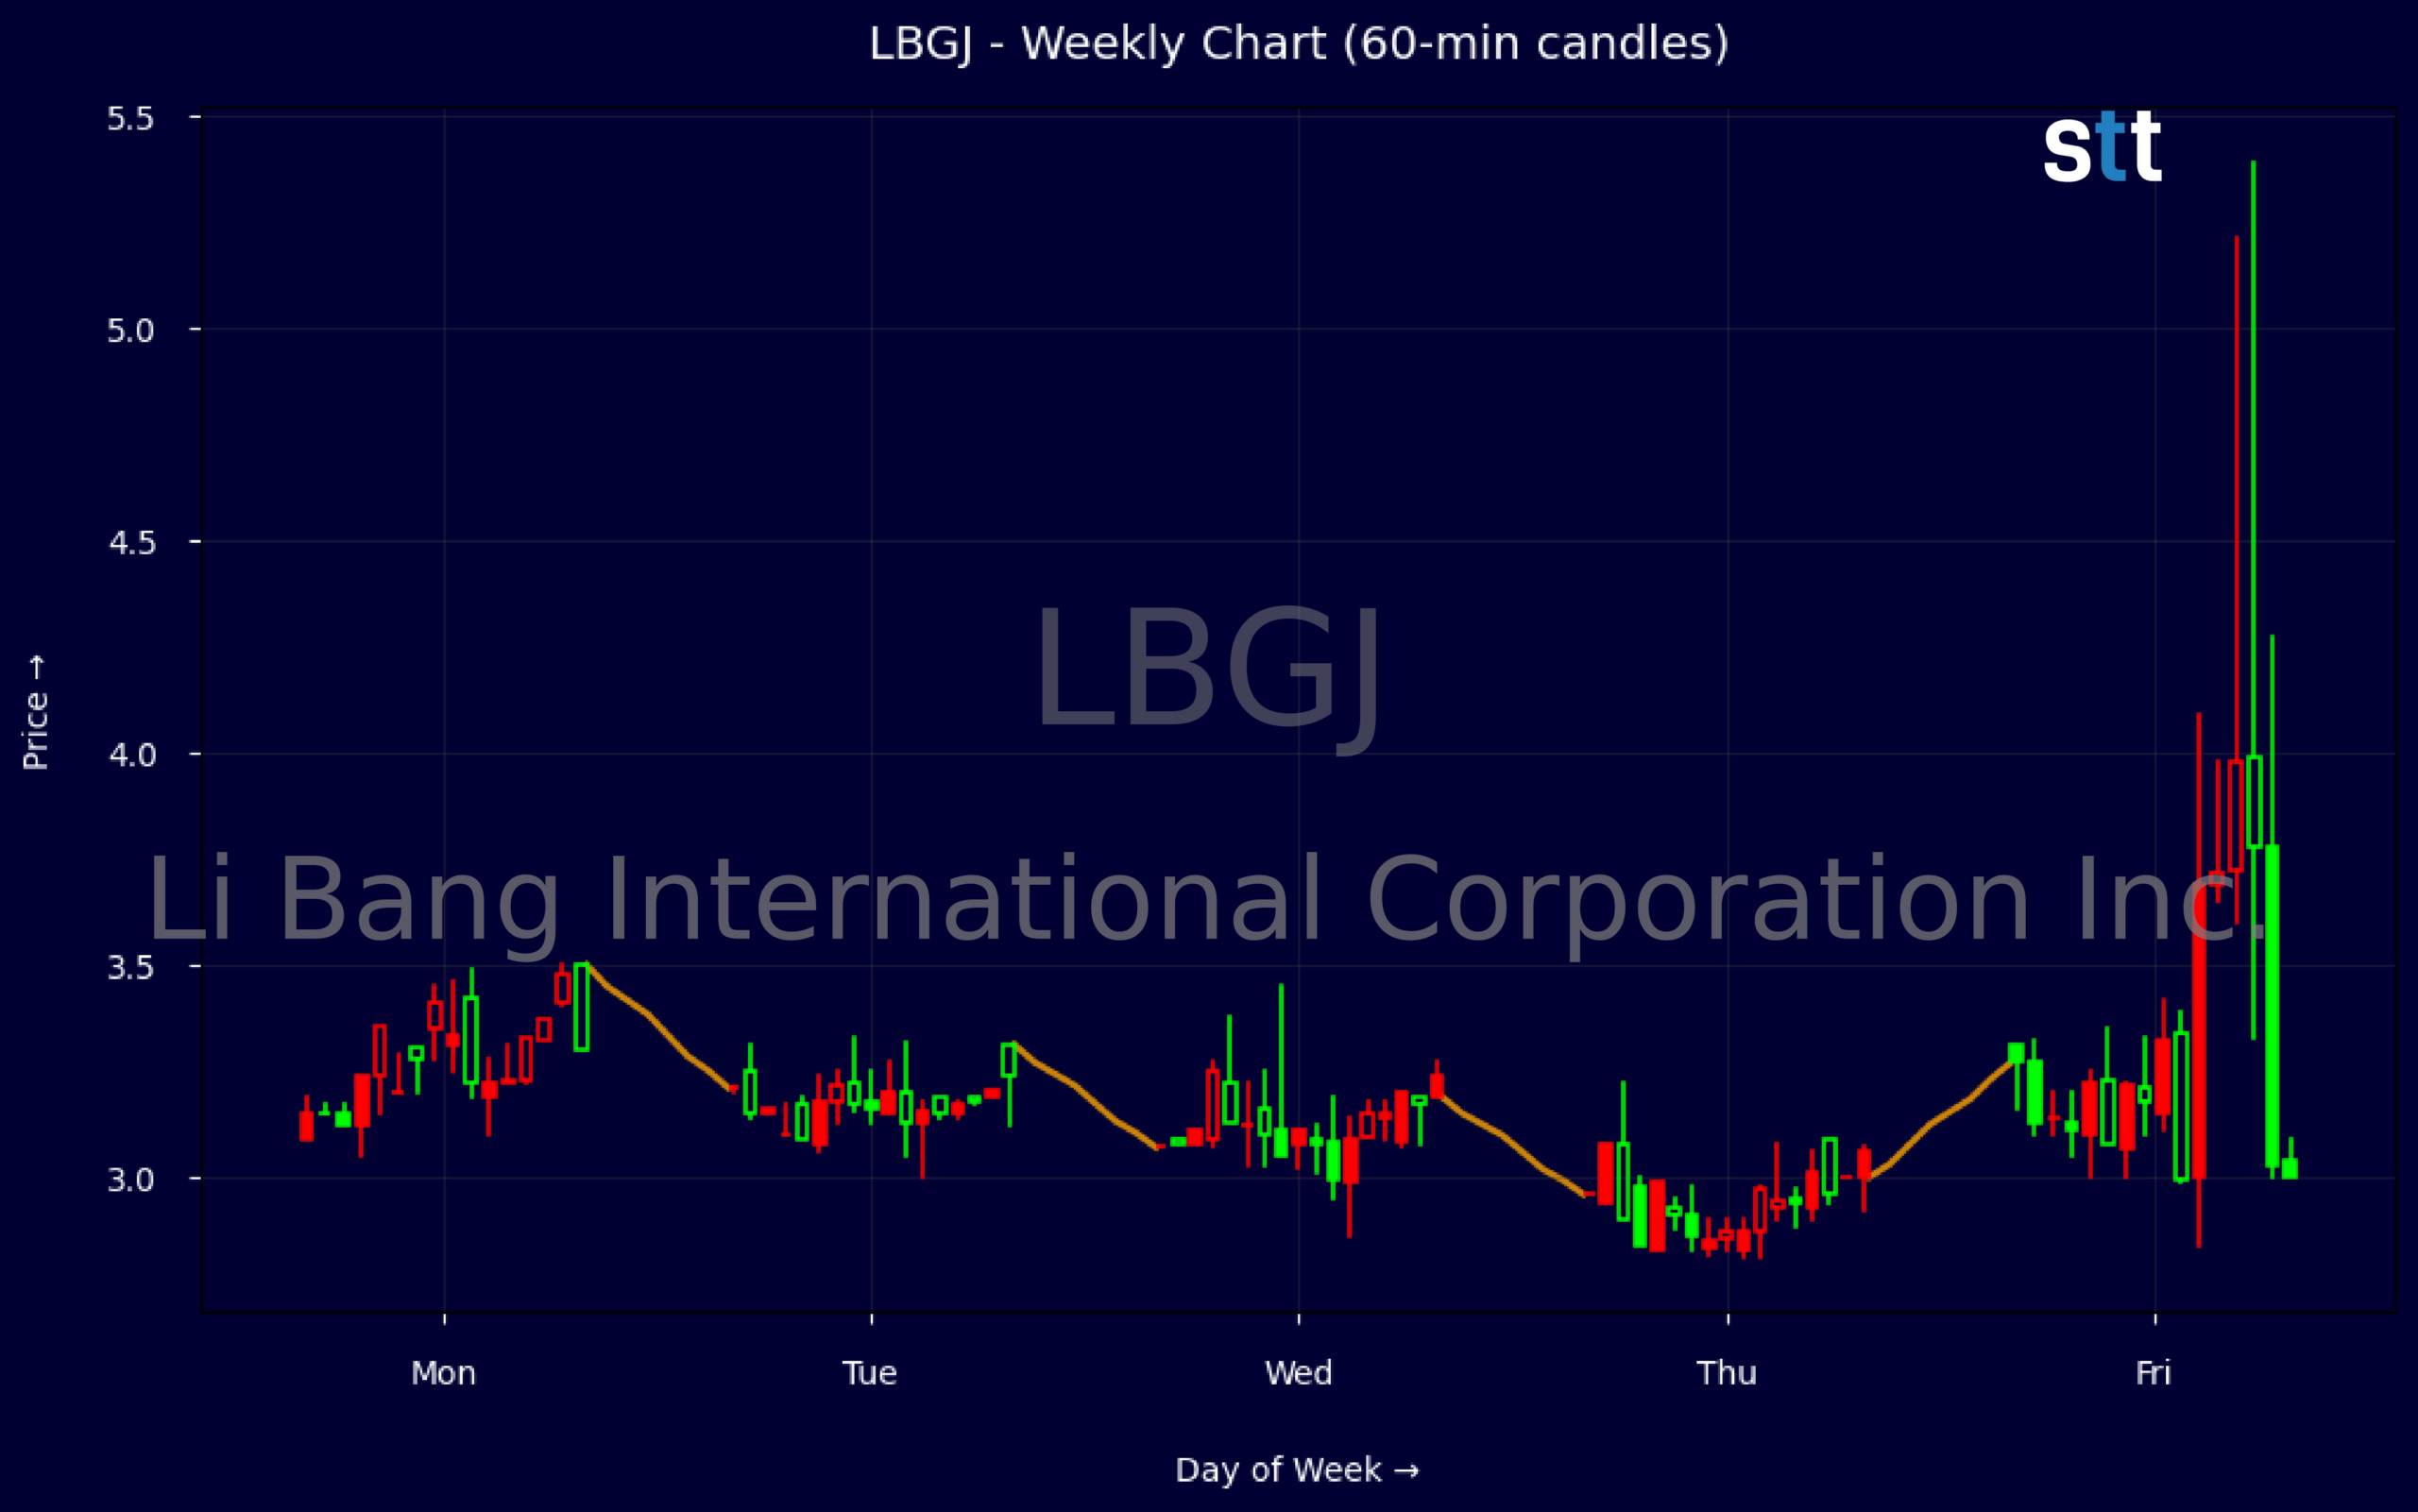
Weekly Update Aug 10 – Aug 14, 2026: On Saturday, August 15, 2026 Li Bang International Corporation Inc. stock [NASDAQ: LBGJ] is trending up by 10.69%! Discover the key drivers behind this movement as well as our expert analysis in the detailed breakdown below.
Industrials industry expert:
Analyst sentiment – neutral
LBGJ screens as a deeply discounted, high‑risk small-cap industrial with stressed fundamentals. With revenue of ~$11.1m and an enterprise value of ~$12.4m, EV/sales is near 1.1x, but the equity trades at just 0.16x P/S and 0.23x P/B versus Industrials peers typically at 1.5–2.0x P/S and 1.8–2.5x P/B, signaling severe market skepticism. Leverage is elevated (leverageratio 3.5, long‑term debt $3.1m; current debt $8.4m), and negative ROIC (-3.5%) confirms subpar capital efficiency and likely thin or negative profitability.
Technically, the weekly tape shows a short-term recovery from a 2.96 low to a 3.31 close, with a clear sequence of higher lows and a strong bullish candle into week’s end, indicating an emerging upside trend after prior weakness. Intraday 5‑minute candles (not shown numerically but implied) suggest active trading around 3.05–3.20 with responsive buying on dips. A precise trading level is $3.00: above it, the stock is a tactical long; a decisive break below $3.00 should trigger tight risk exits.
More Breaking News
- REGN Stock Jumps As Bullish Data And Targets Pile Up
- NU Stock Plunges Nearly 20% As Volatility Spikes
- Snap Stock Slides As Traders Weigh Ads, Regulation, Insider Sale
- MPT Stock Slides As Traders Focus On Debt And Cash Flow
With no material recent news, the current move appears technically driven and liquidity‑dependent rather than fundamentally re-rated. Versus Industrials benchmarks, LBGJ trades at a distressed multiple with weaker returns and higher leverage, justifying a valuation discount but also embedding significant optionality. Near term, I expect a trading range with resistance at $3.50 and support at $3.00; aggressive traders can target $3.70–3.80 on a breakout above $3.50 with disciplined stops.
Quick Financial Overview
Li Bang International Corporation Inc. shows a small-cap profile with revenue of about $11.1M and an enterprise value around $12.4M. The stock trades at roughly 0.16 times sales and 0.23 times book value based on a book value per share of $13.15. Those low multiples often attract value-focused traders, but weak profitability and negative recent return on capital of about -3.51% signal that the market doubts earnings power, at least for now.
On the balance sheet, total assets sit near $27.8M, with equity around $7.9M and total liabilities around $20.0M. Current assets of about $19.9M against current liabilities of roughly $16.9M leave working capital of about $3.0M, which provides some cushion but not a huge safety margin. Current debt of about $8.4M and long-term debt of about $3.1M together highlight that leverage is meaningful, lining up with the 3.5 leverage ratio.
From a price action view, LBGJ’s weekly candles show a narrow consolidation band. Opens around $3.07–$3.21 and closes between roughly $3.04 and $3.31 suggest a market that is not ready to trend yet. The intraday 5-minute bar, with a high near $4.09, low at $2.84, and close near $3.12, shows that when volume does come in, the stock can move fast both ways. For short-term traders, that combination of tight weekly structure and volatile intraday range creates a classic setup where a break of recent highs or lows can drive the next directional swing.
Conclusion
Li Bang International Corporation Inc. sits in a classic small-cap trading zone: low multiples, mixed profitability, and a chart that is coiling rather than trending. Revenue and assets show a real operating base, but debt levels and negative recent return on capital mean the balance sheet is a key risk variable. For traders, that means any change in sentiment can quickly reprice LBGJ, because expectations are already muted.
On the chart, the weekly range between roughly $3.00 support and the $3.30–$3.35 area resistance is the core battlefield. The intraday spike to $4.09 and flush to $2.84 tells you volatility is there; it is just waiting for a clear trigger. Range breaks above recent highs can attract momentum buyers, while a decisive push under recent lows would shift the focus to downside risk and the company’s leverage profile.
For educational and research purposes, traders should track how price behaves around these levels alongside any updates on revenue quality and debt management. The opportunity in LBGJ is that the stock is priced cheaply to sales and book; the risk is that balance sheet strain could cap any rebound. As I often tell traders, “Cheap stocks are only worth trading when the chart and the balance sheet are both moving in your favor—never let a low multiple blind you to real risk.” In volatile small-cap names like LBGJ, risk management and discipline matter more than anything; as Tim Bohen, lead trainer with StocksToTrade says, “Success in trading is more about cutting losses quickly than finding winners.”
This is stock news, not investment advice. StocksToTrade News delivers real-time stock market updates tailored to highlight the key catalysts driving short-term price movements. Our coverage is designed for active traders and investors who thrive in fast-moving markets, with a focus on volatile sectors like penny stocks, AI stocks, Robinhood stocks and other momentum plays. From earnings reports and FDA approvals to mergers, new contracts, and unusual trading volume, we break down the events that can spark significant price action.
Looking to level up your trading game? Explore StocksToTrade, the ultimate platform for traders. With powerful tools designed for swing and day trading, integrated news scanning, and even social media monitoring, StocksToTrade keeps you one step ahead.
Check out our quick startup guide for new traders!
- How to Read Stock Charts: A Guide for Beginners
- Trading Plan: 6 Steps to Create One
- How To Create a Stock Watchlist
Ready to build your watchlists? Check out these curated lists:
Once your watchlist is set, take the next step and trade with confidence using StocksToTrade’s robust platform. Don’t miss out — grab your 14-day trial for just $7 and experience the edge you need to thrive in today’s fast-paced markets.