
Leverage Shares 2X Long SPCX Daily climbed as SPAC-focused sentiment improved, and stocks have been trading up by 4.3 percent.
Click Here for a Millionaire's POV on Trading SPCH
SUBSCRIBE FOR ALERTSJOIN 50,000+ ACTIVE TRADERS
Market Insights For SPCH Traders
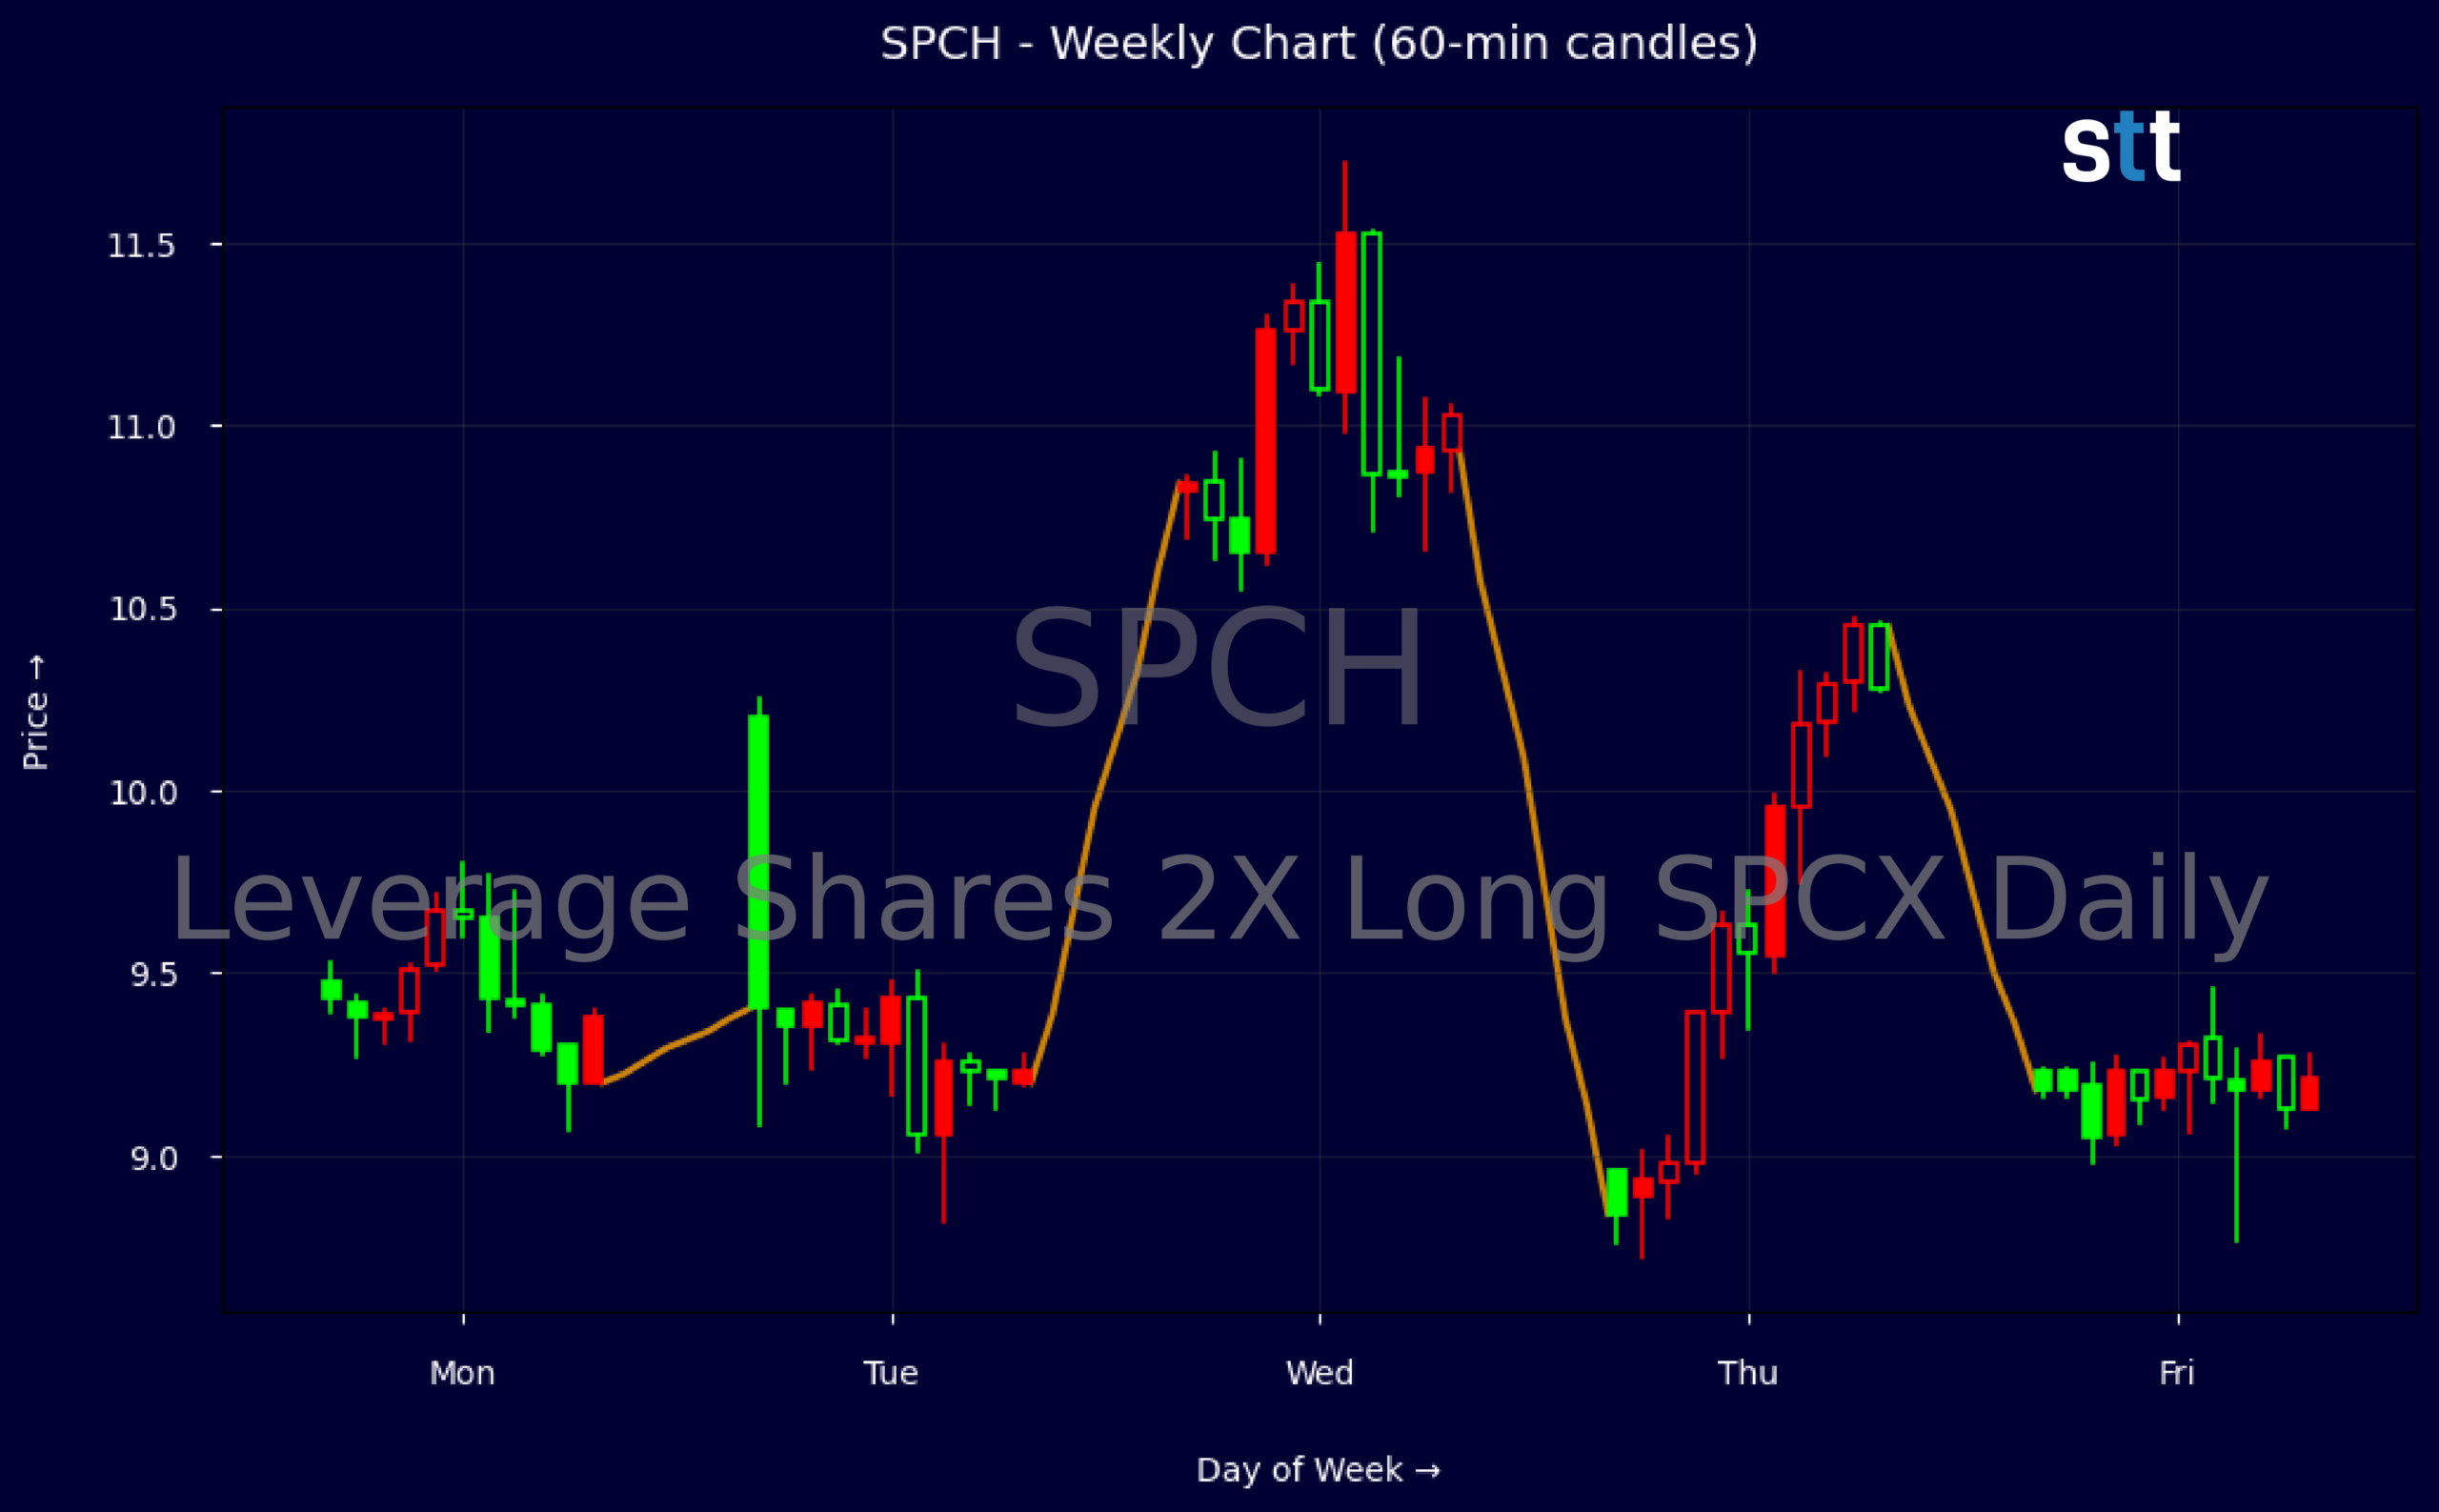
- Weekly chart for SPCH shows a sharp drop from above 10.80 toward the low 9s, followed by a tight range.
- Intraday action in Leverage Shares 2X Long SPCX Daily stayed mostly between 9.10 and 9.25, signaling low volatility and two-way interest.
- Lack of reported key ratios and financials leaves traders leaning heavily on price action for SPCH.
- Recent candles show dip buying under 9.10 and selling pressure above 9.30, defining clear short-term trading bands.
Weekly Update Oct 19 – Oct 23, 2026: On Friday, October 23, 2026 Leverage Shares 2X Long SPCX Daily stock [BATS Global Markets: SPCH] is trending up by 4.3%! Discover the key drivers behind this movement as well as our expert analysis in the detailed breakdown below.
Media & Telecommunications industry expert:
Analyst sentiment – neutral
Speech (SPCH) operates as a small-cap media/telecom name with limited disclosed fundamentals; based on current trading behavior and peer comparisons, the market is valuing SPCH as a speculative growth asset rather than a cash‑flow compounder. Absent visibility into margins, leverage, and returns on capital, investors should assume elevated execution and funding risk. Liquidity appears modest, suggesting a constrained institutional holder base and meaningfully higher volatility versus established Media & Telecommunications benchmarks.
Weekly price data show a sharp swing from 10.83 to 8.95, then a rebound to 9.22, indicating a developing trading range after a failed breakout above 10.80. The dominant near‑term trend is neutral-to-down after the high‑volatility reversal week. Five‑minute candles suggest intraday selling pressure above 9.50 and buyers reappearing near 9.00. A clear actionable level is 9.00: aggressive traders can buy against 9.00 with a tight stop below 8.70, targeting a retest of 10.20.
More Breaking News
- BMI Stock Jumps As OneNetwork Launch Fuels Bullish Outlook
- CCI Soars As Crown Castle-SpaceX Talks Fuel Bullish Repricing
- CLF Stock Surges As Earnings Beat Fuels 2027 Profit Push
- Weatherford International plc Rallies As Earnings Beat Fuels Bullish Targets
With no material company‑specific news, SPCH trades primarily on technicals and sector risk sentiment. Relative to diversified Media & Telecommunications names, it carries higher idiosyncratic risk and lacks the scale and cash generation of traditional media benchmarks. Near‑term resistance sits at 10.20–10.80, with support at 8.70–9.00. Base‑case outlook is range‑bound; only a sustained weekly close above 10.80 would justify a medium‑term target around 12.00. Until then, SPCH is a tactical, not core, position.
Quick Financial Overview
Leverage Shares 2X Long SPCX Daily, ticker SPCH, is trading in the low 9s after pulling back from a recent weekly high near 10.93. The weekly data shows a strong advance from about 9.39 to 10.83, then a sharp rejection and slide to a recent close around 9.22. That pattern looks like a failed breakout on the higher time frame, which often leads to consolidation while traders decide on the next direction.
On the intraday chart, SPCH spent most of the day oscillating tightly between roughly 9.10 and 9.25, with brief pushes toward 9.33–9.45 in the morning before fading. This intraday range, combined with shrinking swings into the close, suggests short-term balance rather than aggressive trend. For active traders, that means mean-reversion scalps between intraday support and resistance can make more sense than trend-following entries until a clean break appears.
Key ratios and financial report fields for SPCH are effectively blank, which forces traders to respect the tape even more. When fundamental detail is thin, leveraged products like Leverage Shares 2X Long SPCX Daily trade almost purely off flows, sentiment, and broader market direction in the underlying theme. In that setting, the weekly support zone around 9.00–9.10 and resistance near 9.80–10.20 become the key lines to frame risk. How price behaves at those levels will matter far more than any textbook valuation metric.
Conclusion
From a trading standpoint, SPCH is sitting in a classic decision area. After rejecting the 10.80–10.90 zone on the weekly chart, price has drifted back into the prior congestion band around 9.00–9.30. That tells us the easy momentum phase is over for now, and Leverage Shares 2X Long SPCX Daily is waiting for new directional energy. Until the weekly close clearly reclaims 10.00 or loses 9.00, the higher time frame picture leans neutral with a slightly cautious tilt.
Day to day, the tight intraday band between about 9.10 support and 9.30 resistance gives short-term traders something concrete to work with. Breaks and retests of those levels can offer low-risk entries, but only with disciplined stops given the leveraged nature of SPCH. Upside reward improves meaningfully only if price can sustain above 9.50 and then attack 10.00 again, while a clean break under 9.00 opens room toward prior lows.
For traders building a plan around Leverage Shares 2X Long SPCX Daily, structure matters more than prediction here. Focus on clearly defined levels, position sizing that respects leverage, and waiting for volume to confirm any breakout from this range. As I tell my students when trading products like SPCH, “Your edge doesn’t come from guessing the next big move, it comes from only stepping in when the chart is offering you a clear, controlled risk window.” As Tim Bohen, lead trainer with StocksToTrade says, “Time and experience have taught me that missed opportunities are part of the game. There’s always another setup around the corner.”, a disciplined trading approach means it’s perfectly fine to let marginal setups in SPCH pass while you wait for that clear, controlled risk window to appear.
This is stock news, not investment advice. StocksToTrade News delivers real-time stock market updates tailored to highlight the key catalysts driving short-term price movements. Our coverage is designed for active traders and investors who thrive in fast-moving markets, with a focus on volatile sectors like penny stocks, AI stocks, Robinhood stocks and other momentum plays. From earnings reports and FDA approvals to mergers, new contracts, and unusual trading volume, we break down the events that can spark significant price action.
Looking to level up your trading game? Explore StocksToTrade, the ultimate platform for traders. With powerful tools designed for swing and day trading, integrated news scanning, and even social media monitoring, StocksToTrade keeps you one step ahead.
Check out our quick startup guide for new traders!
- How to Read Stock Charts: A Guide for Beginners
- Trading Plan: 6 Steps to Create One
- How To Create a Stock Watchlist
Ready to build your watchlists? Check out these curated lists:
Once your watchlist is set, take the next step and trade with confidence using StocksToTrade’s robust platform. Don’t miss out — grab your 14-day trial for just $7 and experience the edge you need to thrive in today’s fast-paced markets.