

Leverage Shares 2X Long SPCX Daily ETF jumped as SPAC-focused sentiment strengthened, and stocks have been trading up by 7.54 percent.
Key Takeaways
- Leverage Shares 2X Long SPCX Daily ETF (SPCH) has dropped from the 11s to the low 8s, a sharp pullback that has short-term traders on watch.
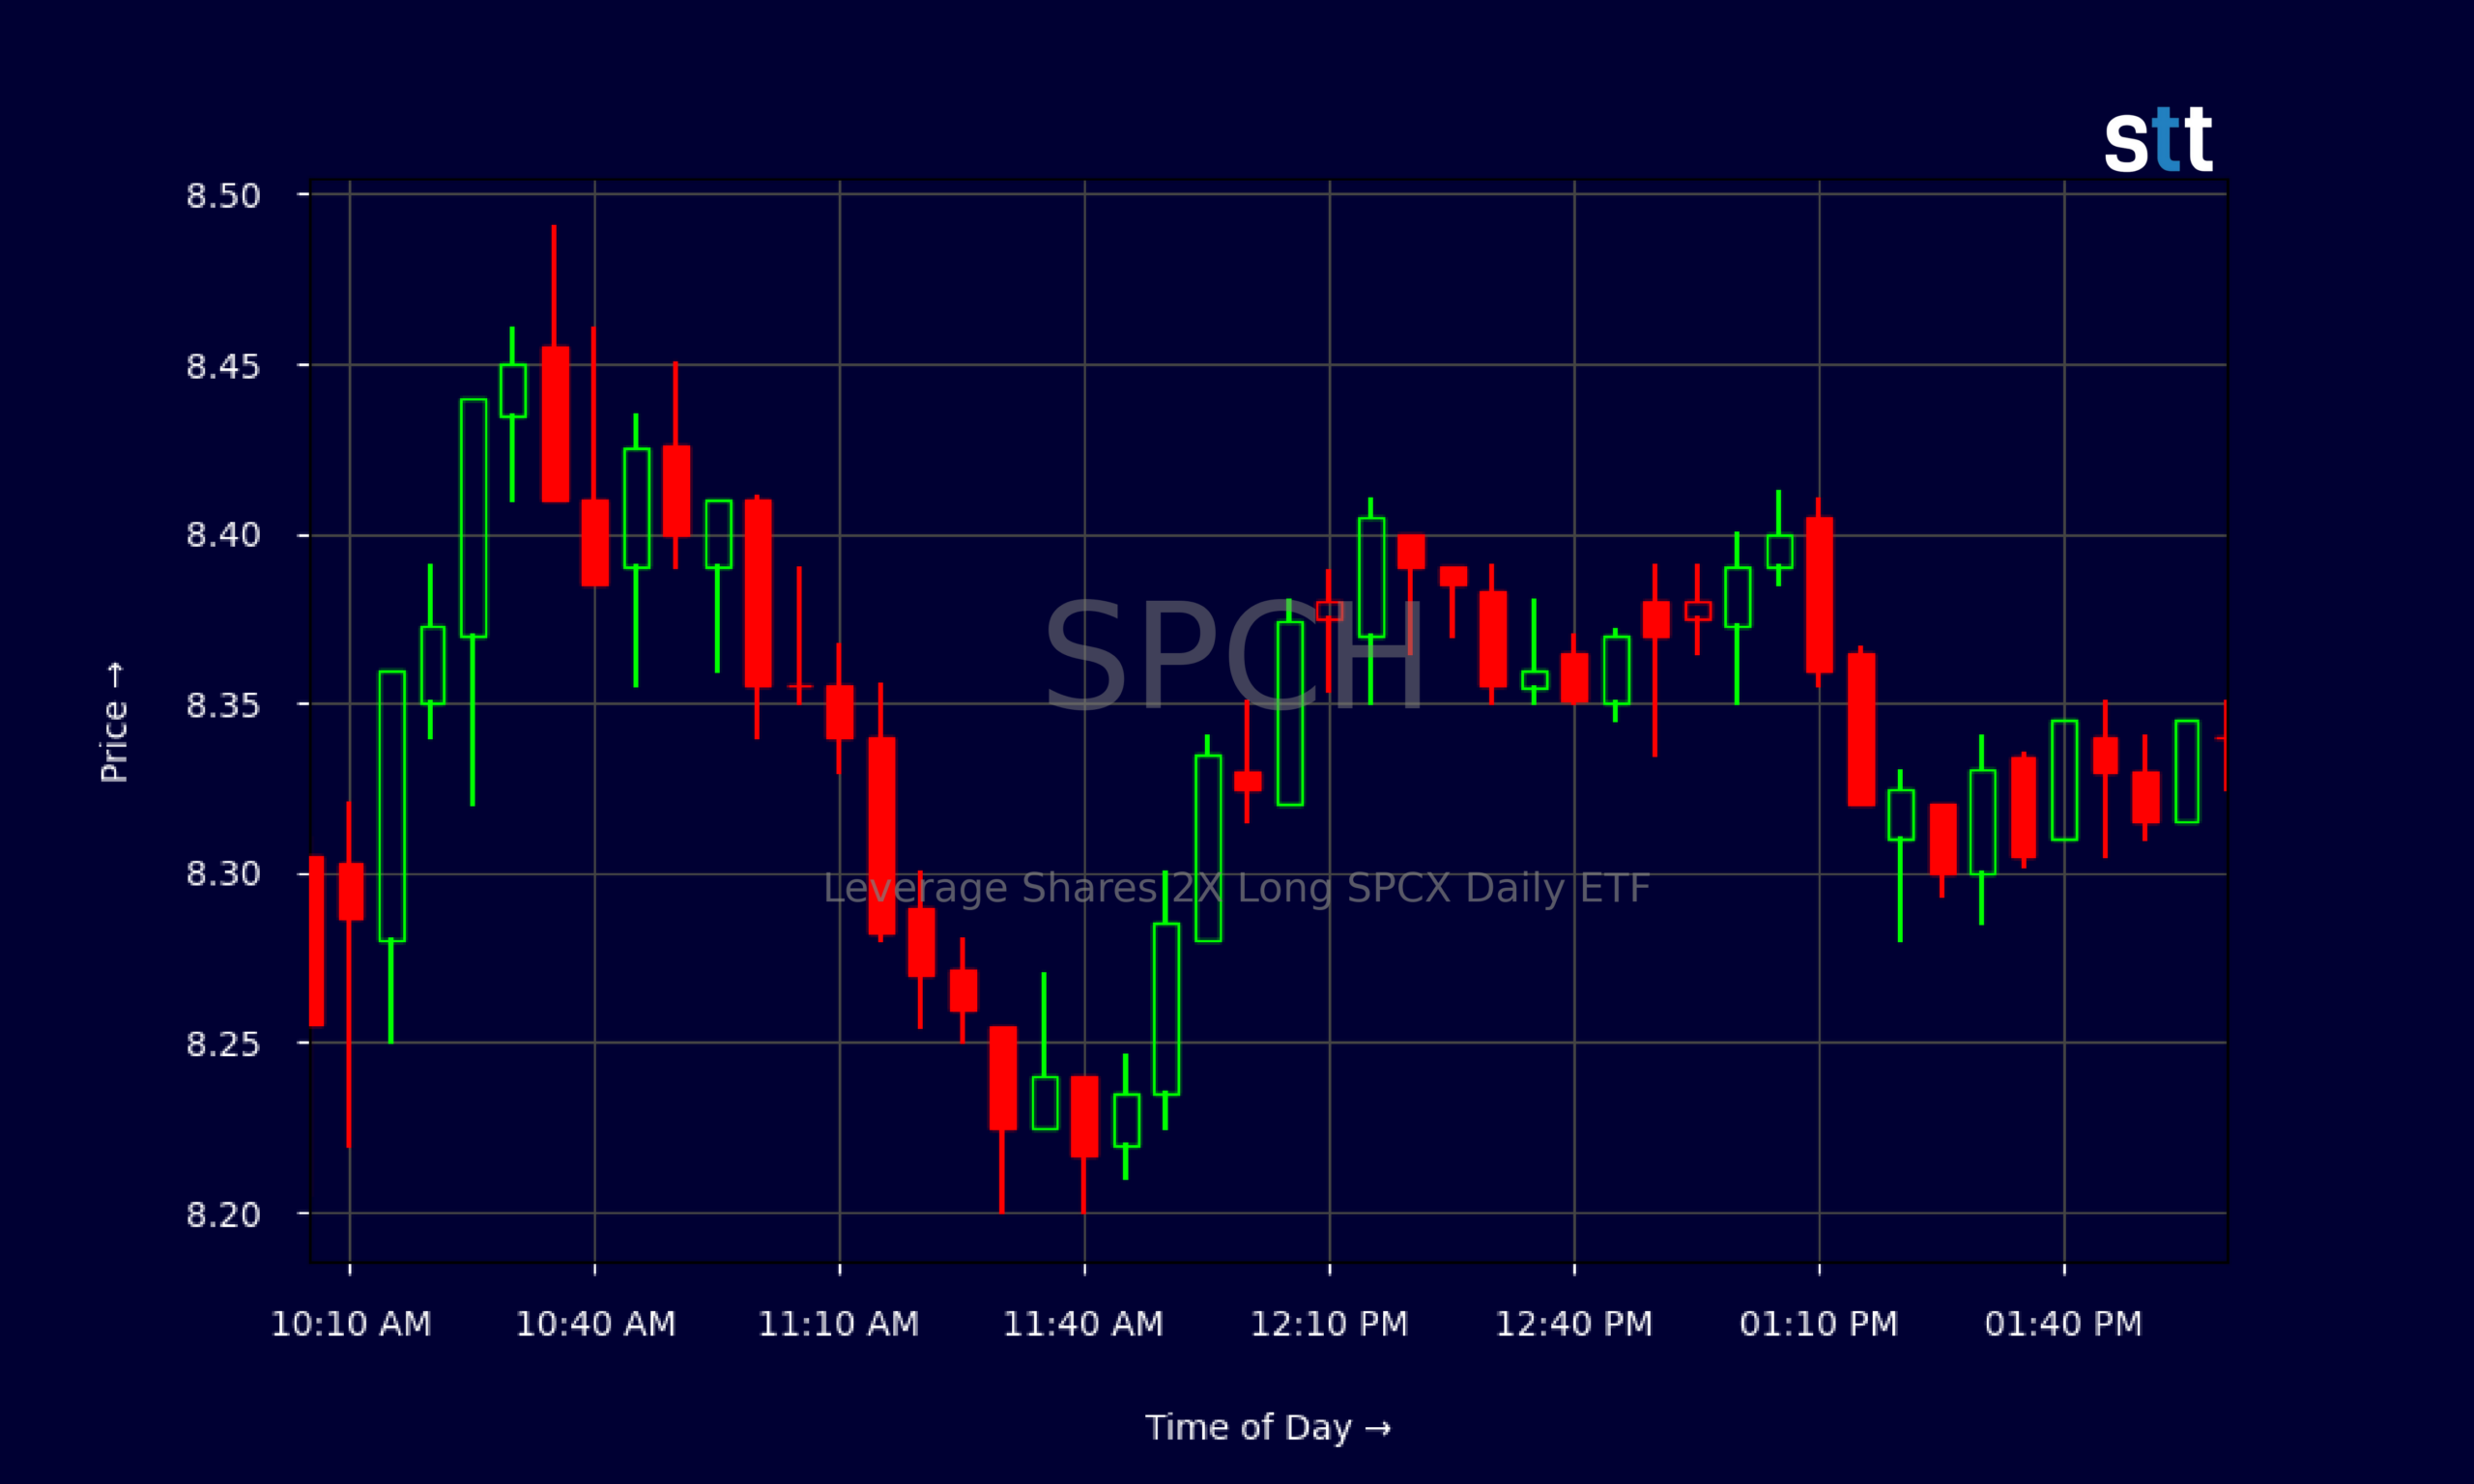
- Recent intraday trading in SPCH shows tight consolidation around $8.30–$8.40, signaling a battle between dip buyers and profit takers.
- With no clear fundamental data, SPCH is trading almost purely on technicals and sentiment in the current market.
- Volatility in SPCH has cooled from the wild swings seen days ago, but the leveraged structure still demands strict risk management.
Live Update At 14:02:27 EST: On Tuesday, November 03, 2026 Leverage Shares 2X Long SPCX Daily ETF stock [BATS Global Markets: SPCH] is trending up by 7.54%! Discover the key drivers behind this movement as well as our expert analysis in the detailed breakdown below.
Quick Financial Overview
Leverage Shares 2X Long SPCX Daily ETF, trading under ticker SPCH, is a leveraged product designed to deliver roughly 2x the daily performance of its underlying target. That means SPCH is built for traders, not for long-term holding. The recent chart tells that story clearly.
From a close near 11.46 on 2026/10/09, SPCH pushed as high as the 12.09 area on 2026/10/12, then faded. Over the following weeks, the ETF slipped steadily, printing lower highs and lower lows until it reached Friday’s close around 8.34. That is a sizable drawdown, showing how leverage amplifies both up and down moves.
More Breaking News
- Wetour Robotics Limited Falls 4% as Slide Continues
- FWONK Rallies As Formula One Expansion Fuels Long-Term Hype
- NuScale Power Rises 6% Despite Securities Lawsuit Reminder
- Snap Stock Slips As User Miss, Regulation And Insider Sale Weigh
Key ratio data for SPCH is essentially blank, which is normal for a trading-focused leveraged ETF. There are no classic earnings, margins, or balance-sheet drivers here. For SPCH, the “fundamentals” are the structure of the ETF and the behavior of its underlying holdings. Traders in SPCH therefore lean heavily on price action, volume, and broader market risk-on or risk-off tone rather than traditional financial statements.
Why Traders Are Watching SPCH Price Action
The SPCH chart reads like a textbook momentum unwind followed by early-stage stabilization. SPCH ripped into the 12 area in mid-October, then started to bleed lower as traders locked in gains and broader risk appetite cooled. The slide from above 11 to Friday’s close at 8.34 is steep, but not unusual for a 2x ETF tied to a volatile theme.
Look at the recent daily candles. SPCH showed heavy range days between 2026/10/21 and 2026/10/23, with highs above 11.70 at the peak and then multiple red sessions as price cracked through 10, then 9. The more recent action from 2026/10/28 to 2026/11/03 shows the character changing. The ranges are tighter, with SPCH bouncing between roughly 7.57 and 8.88, trying to carve out a base.
Intraday, SPCH opened around 7.90 and pushed over 8.45 in the morning before settling into a tight band near 8.30–8.40. That type of grind, with many 5‑minute candles clustering around the same level, often signals a pause where both long and short traders are reassessing. Volume is being absorbed, but the range is compressing.
For active traders, that compression matters. A leveraged ETF like SPCH tends to deliver its best opportunities when it breaks out of these tight zones. A strong move above the 8.50–8.60 area with volume could trigger a momentum push toward prior resistance around 9.00. A clean breakdown under 8.00, by contrast, may invite another round of selling as trapped longs bail. Either way, SPCH remains on many watchlists because technical levels are clear and the volatility is still high enough to matter.
Conclusion
SPCH, the Leverage Shares 2X Long SPCX Daily ETF, is acting exactly like a short-term trading vehicle. The run to 12, followed by a sharp drop into the 8s, shows how fast leverage works in both directions. With no traditional earnings data or clear key ratios to lean on, traders are forced to focus on the chart. Right now, that chart shows a name trying to stabilize after a heavy pullback.
The tight intraday band around 8.30–8.40 is the key battleground. If SPCH can hold above recent lows near 7.57 and start building higher lows, dip buyers may gain confidence and push it back toward 9 and beyond. If those lows fail, traders will treat SPCH as a broken momentum name and look for flushes and short bounces instead of sustained trends.
For the Tim Sykes community, a ticker like SPCH fits the playbook only if the rules are followed. As Tim often says, “Cut losses quickly; small losses are fine, big losses are not.” That ties in well with a core trading mindset from the broader community — as Tim Bohen, lead trainer with StocksToTrade says, “I focus on what a stock is doing, not what I want it to do. Let the stock prove itself before you make a move.”. Applied to SPCH, that means respecting the leverage, sizing down, and trading the levels — not the hope. This article is for educational and research purposes only, but the message is clear: SPCH rewards discipline and punishes stubbornness, and right now every candle is data for the next trade.
This is stock news, not investment advice. StocksToTrade News delivers real-time stock market updates tailored to highlight the key catalysts driving short-term price movements. Our coverage is designed for active traders and investors who thrive in fast-moving markets, with a focus on volatile sectors like penny stocks, AI stocks, Robinhood stocks and other momentum plays. From earnings reports and FDA approvals to mergers, new contracts, and unusual trading volume, we break down the events that can spark significant price action.
Looking to level up your trading game? Explore StocksToTrade, the ultimate platform for traders. With powerful tools designed for swing and day trading, integrated news scanning, and even social media monitoring, StocksToTrade keeps you one step ahead.
Check out our quick startup guide for new traders!
- How to Read Stock Charts: A Guide for Beginners
- Trading Plan: 6 Steps to Create One
- How To Create a Stock Watchlist
Ready to build your watchlists? Check out these curated lists:
Once your watchlist is set, take the next step and trade with confidence using StocksToTrade’s robust platform. Don’t miss out — grab your 14-day trial for just $7 and experience the edge you need to thrive in today’s fast-paced markets.