
Leverage Shares 2X Long SNDK Daily sank as negative sentiment over Sandisk’s flash memory demand outlook pushed stocks have been trading down by -9.86 percent
Click Here for a Millionaire's POV on Trading SNDG
SUBSCRIBE FOR ALERTSJOIN 50,000+ ACTIVE TRADERS
Key Takeaways
- SNDG has slid from the 10s to the mid-6s this month, showing clear downside momentum on the daily chart.
- Intraday SNDG trading is tight and choppy, with most prints clustering around $5.75–$5.80 and little directional follow-through.
- With no earnings or ratio data, SNDG trades mainly as a pure technical vehicle tied to Sandisk price swings.
- Recent wide daily ranges in SNDG highlight rising volatility, which short-term momentum traders often seek.
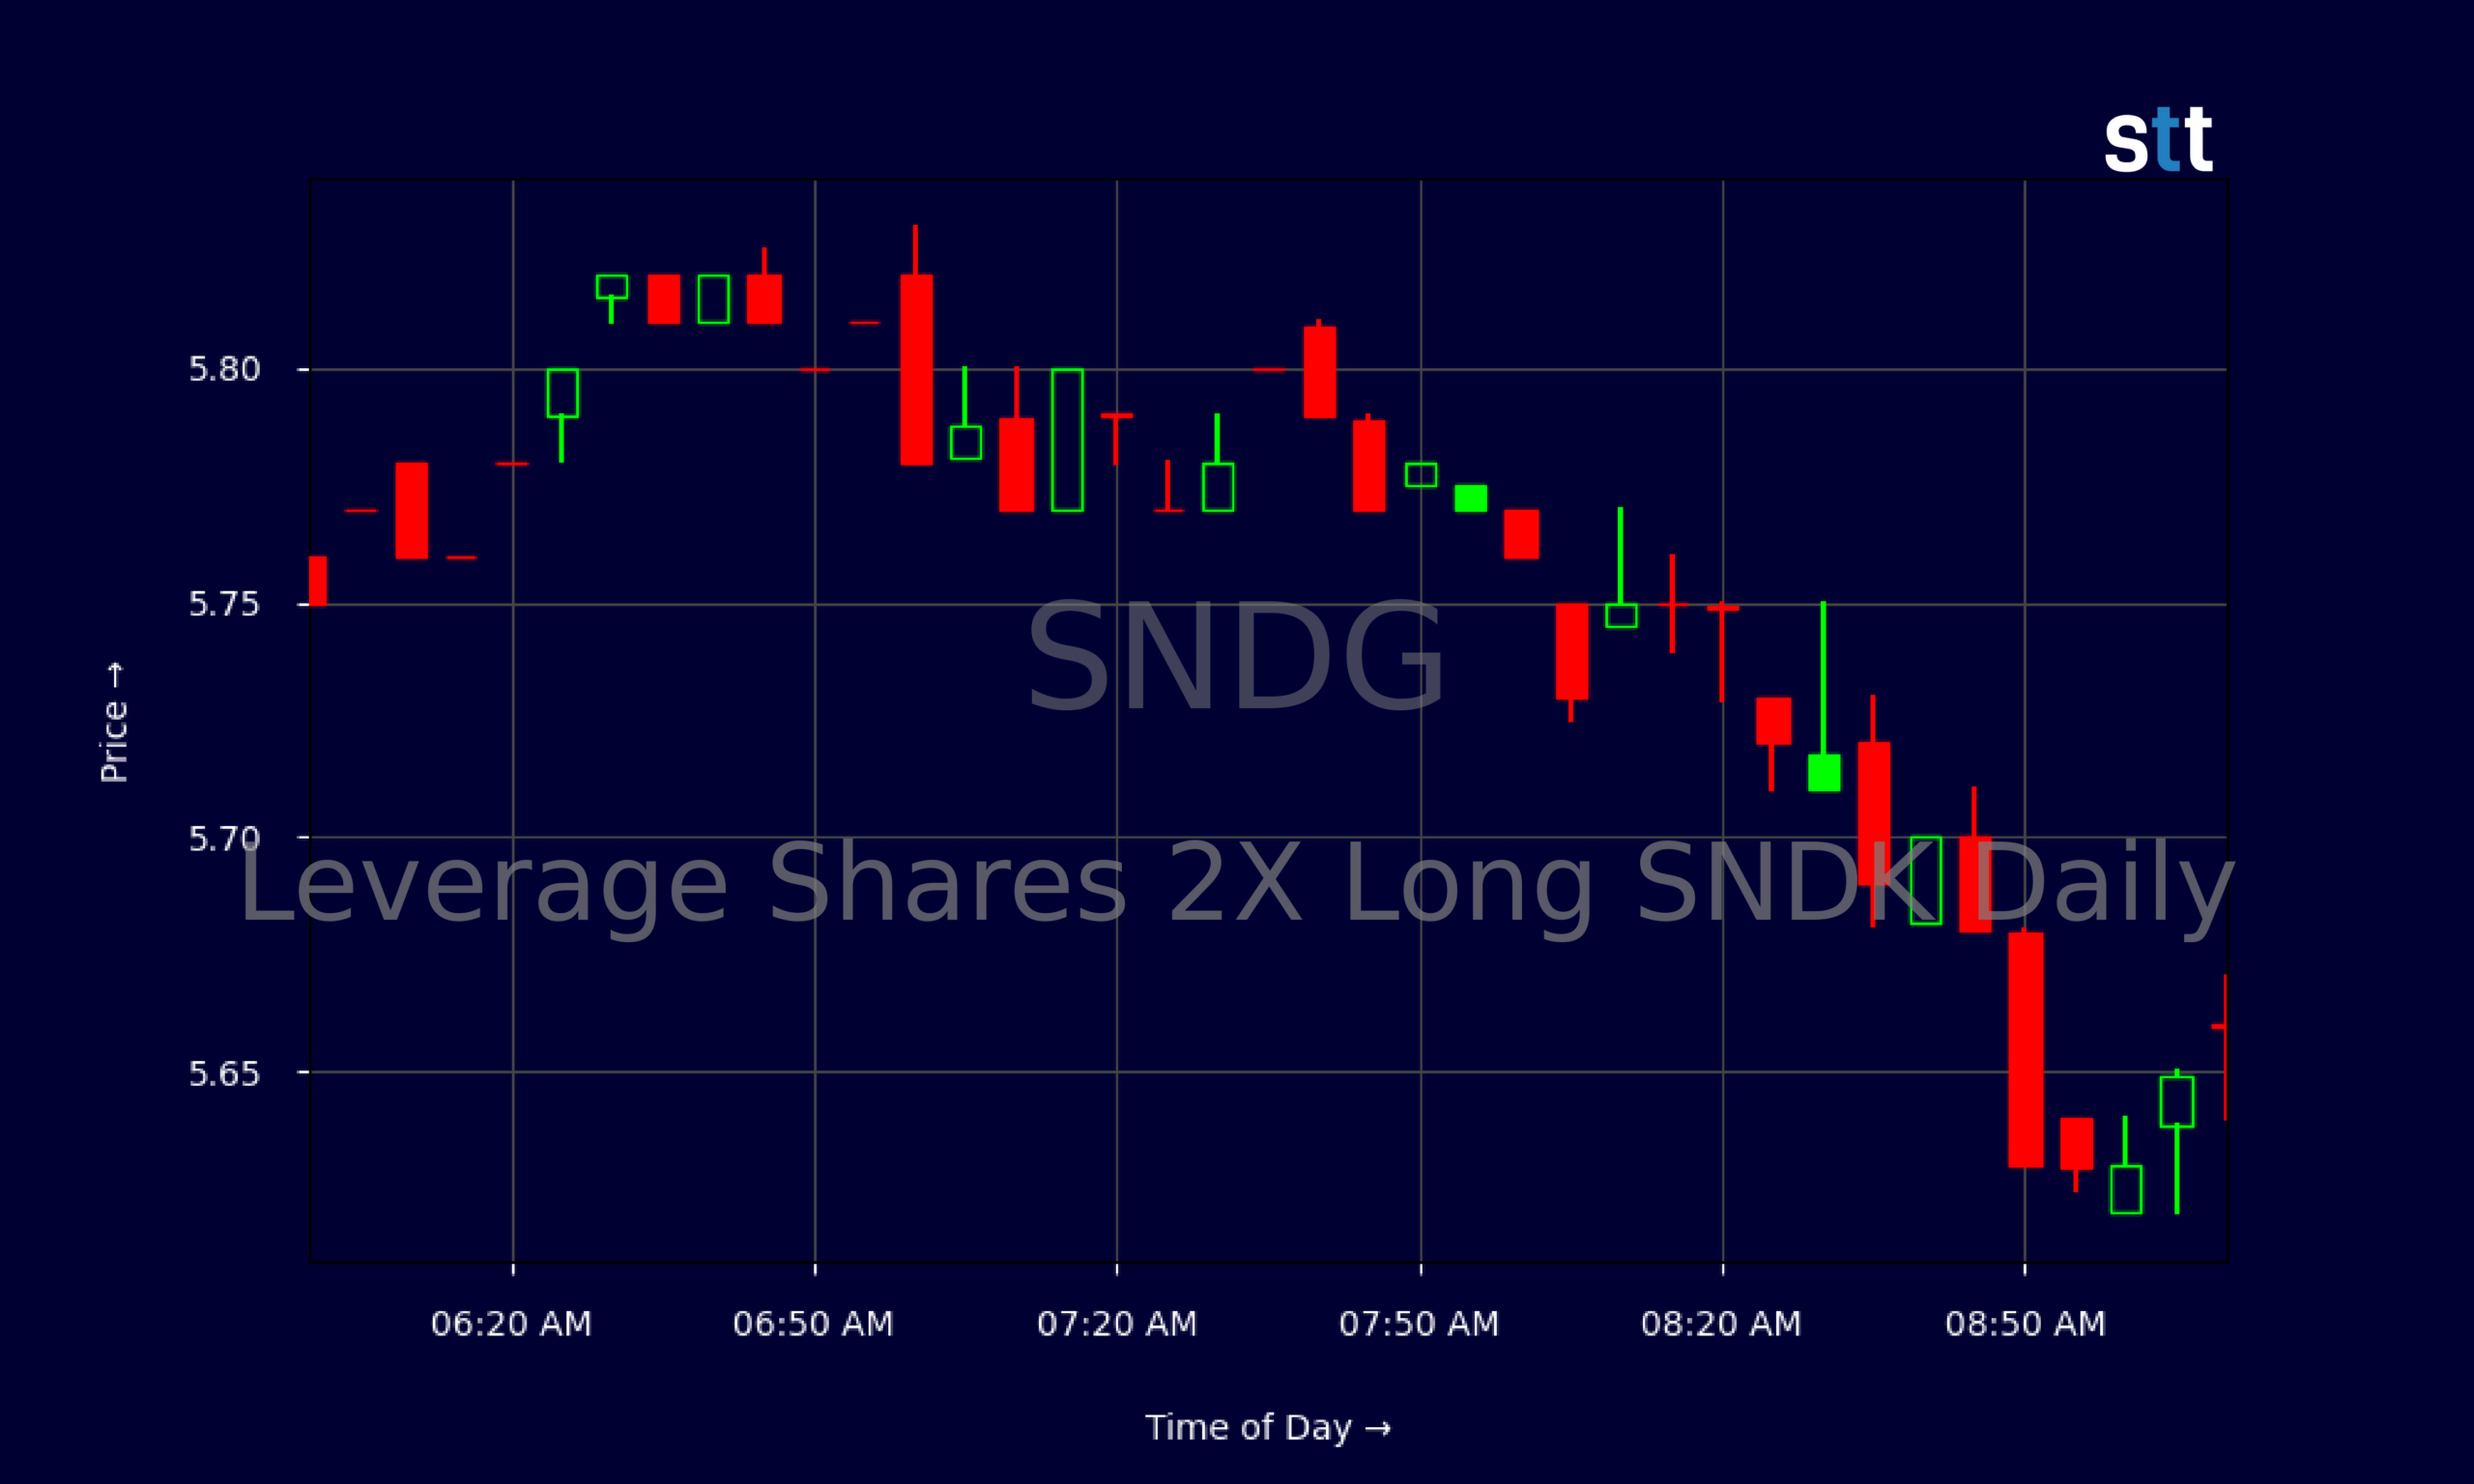
Live Update At 09:21:22 EDT: On Thursday, October 22, 2026 Leverage Shares 2X Long SNDK Daily stock [BATS Global Markets: SNDG] is trending down by -9.86%! Discover the key drivers behind this movement as well as our expert analysis in the detailed breakdown below.
Quick Financial Overview
Leverage Shares 2X Long SNDK Daily, trading under ticker SNDG, is a leveraged product designed to track roughly twice the daily move of Sandisk’s stock. That leverage turns normal market swings into much bigger percentage moves. There is no classic earnings, revenue, or margin story here. SNDG lives and dies by price action and volatility.
Over the last several weeks, SNDG has broken down from the $10 handle toward the mid-$6s. The recent closes tell the story: from 2026/09/28 around $10.08 to 2026/10/22 near $6.29. That is a steep slide in a short window. For traders, that kind of move signals strong trend pressure and forced selling.
More Breaking News
- TAL Stock Slides As Momentum Traders Watch Key Support
- GIXI Stock Soars As Deliverz.ai Expands High-Risk Medical Deliveries
- WFRD Jumps As Earnings Beat And Contracts Offset Mideast Hit
- NCPL Stock Slides As Financial Pressures Test Traders’ Nerves
Intraday, SNDG is currently trading in a tight band between roughly $5.75 and $5.80, with small candles and low range on the five‑minute chart. That contrast—huge daily swings followed by quiet intraday consolidation—often marks a “decision zone.” Active traders tracking SNDG are watching to see whether this cooling-off period sets up a sharper bounce or a fresh leg lower.
Why Traders Are Watching SNDG Price Action
SNDG has become a clean case study in how leveraged products behave when the underlying name loses steam. Earlier in the month, SNDG pushed into the low $11s and held near $10 for several sessions. Then the floor gave way. Day after day of lower highs and lower closes dragged the ETF down into the mid‑$6s. For SNDG traders, that downtrend is not subtle. It is written across the chart like a warning label.
Leverage Shares 2X Long SNDK Daily magnifies Sandisk’s daily move, so a normal pullback in the underlying can translate into a punishing drawdown for SNDG. That is exactly what the daily candles show. Wide ranges—often more than $1 per day—and heavy closes near the lows signal aggressive selling pressure. The spike to 10.20+ on 2026/10/07 followed by a close under $10 was a classic failed breakout signal that many short-biased traders in SNDG look for.
Now, the intraday five‑minute chart paints a different picture. SNDG is chopping sideways around $5.75–$5.80 with very narrow bars. Volatility has compressed. When a leveraged product like SNDG goes from wild swings to quiet drift, experienced traders pay attention. That shift often precedes an expansion move as trapped longs or shorts finally bail.
For short-term trading, SNDG offers both opportunity and danger. The leveraged structure can hand out fast gains when traders nail the direction, but the same leverage punishes hesitation. That is why so many in the Tim Sykes community use SNDG as a training ground for reading pure price action, support, resistance, and failed breakouts without getting distracted by fundamentals that do not really apply here.
Conclusion
SNDG sits at an important crossroads. On the daily chart, Leverage Shares 2X Long SNDK Daily is in a clear downtrend from the 10s into the mid‑6s, with multiple failed attempts to reclaim prior highs. That tells traders the path of least resistance has been lower. On the intraday chart, though, SNDG has gone quiet, holding a narrow band around $5.75–$5.80. That mix—strong prior trend, current consolidation—is exactly the kind of setup many short-term traders hunt. As Tim Bohen, lead trainer with StocksToTrade says, “If a stock’s in play today, it’s because of volume. Low volume doesn’t interest me, because I can’t trust the moves.” In that sense, SNDG’s tight range and quieter tape also remind traders to factor in volume when deciding whether a pattern is truly “in play” or just chopping around.
For those tracking SNDG, the key now is discipline. A break above recent local highs could spark a sharp short-covering pop, while a crack under the current intraday floor opens the door to fresh downside. Either way, the leveraged design of SNDG demands strict risk control. Size too big or hesitate to cut, and the math turns against you fast.
The core lesson from SNDG aligns with what Tim Sykes and Tim Bohen hammer home: “Patterns repeat, but only traders who cut losses quickly and stay disciplined are around long enough to capitalize on them.” SNDG is not a story about value or dividends. It is a live chart showing how leverage, volatility, and trader psychology collide. For educational and research-focused traders, it is a real-time classroom in price action.
This is stock news, not investment advice. StocksToTrade News delivers real-time stock market updates tailored to highlight the key catalysts driving short-term price movements. Our coverage is designed for active traders and investors who thrive in fast-moving markets, with a focus on volatile sectors like penny stocks, AI stocks, Robinhood stocks and other momentum plays. From earnings reports and FDA approvals to mergers, new contracts, and unusual trading volume, we break down the events that can spark significant price action.
Looking to level up your trading game? Explore StocksToTrade, the ultimate platform for traders. With powerful tools designed for swing and day trading, integrated news scanning, and even social media monitoring, StocksToTrade keeps you one step ahead.
Check out our quick startup guide for new traders!
- How to Read Stock Charts: A Guide for Beginners
- Trading Plan: 6 Steps to Create One
- How To Create a Stock Watchlist
Ready to build your watchlists? Check out these curated lists:
Once your watchlist is set, take the next step and trade with confidence using StocksToTrade’s robust platform. Don’t miss out — grab your 14-day trial for just $7 and experience the edge you need to thrive in today’s fast-paced markets.