
Leverage Shares 2X Long SNDK Daily jumped as optimism over SanDisk’s flash memory demand strengthened, and stocks have been trading up by 13.13 percent
Click Here for a Millionaire's POV on Trading SNDG
SUBSCRIBE FOR ALERTSJOIN 50,000+ ACTIVE TRADERS
Key Takeaways
- Leverage Shares 2X Long SNDK Daily (SNDG) has pulled back from early‑month highs above $11 to the mid‑$6s, compressing recent gains.
- Daily SNDG charts show a clear downtrend with lower highs and lower closes after topping near $11, signaling momentum loss.
- Intraday SNDG trading around $6.33 shows tight consolidation, with most 5‑minute candles stuck in a narrow $6.30–$6.50 band.
- Key ratio data for SNDG is thin, so traders are relying mainly on price action, volatility, and liquidity for trade planning.
- Active traders are watching SNDG as a leveraged way to express short‑term views on the underlying Sandisk exposure.
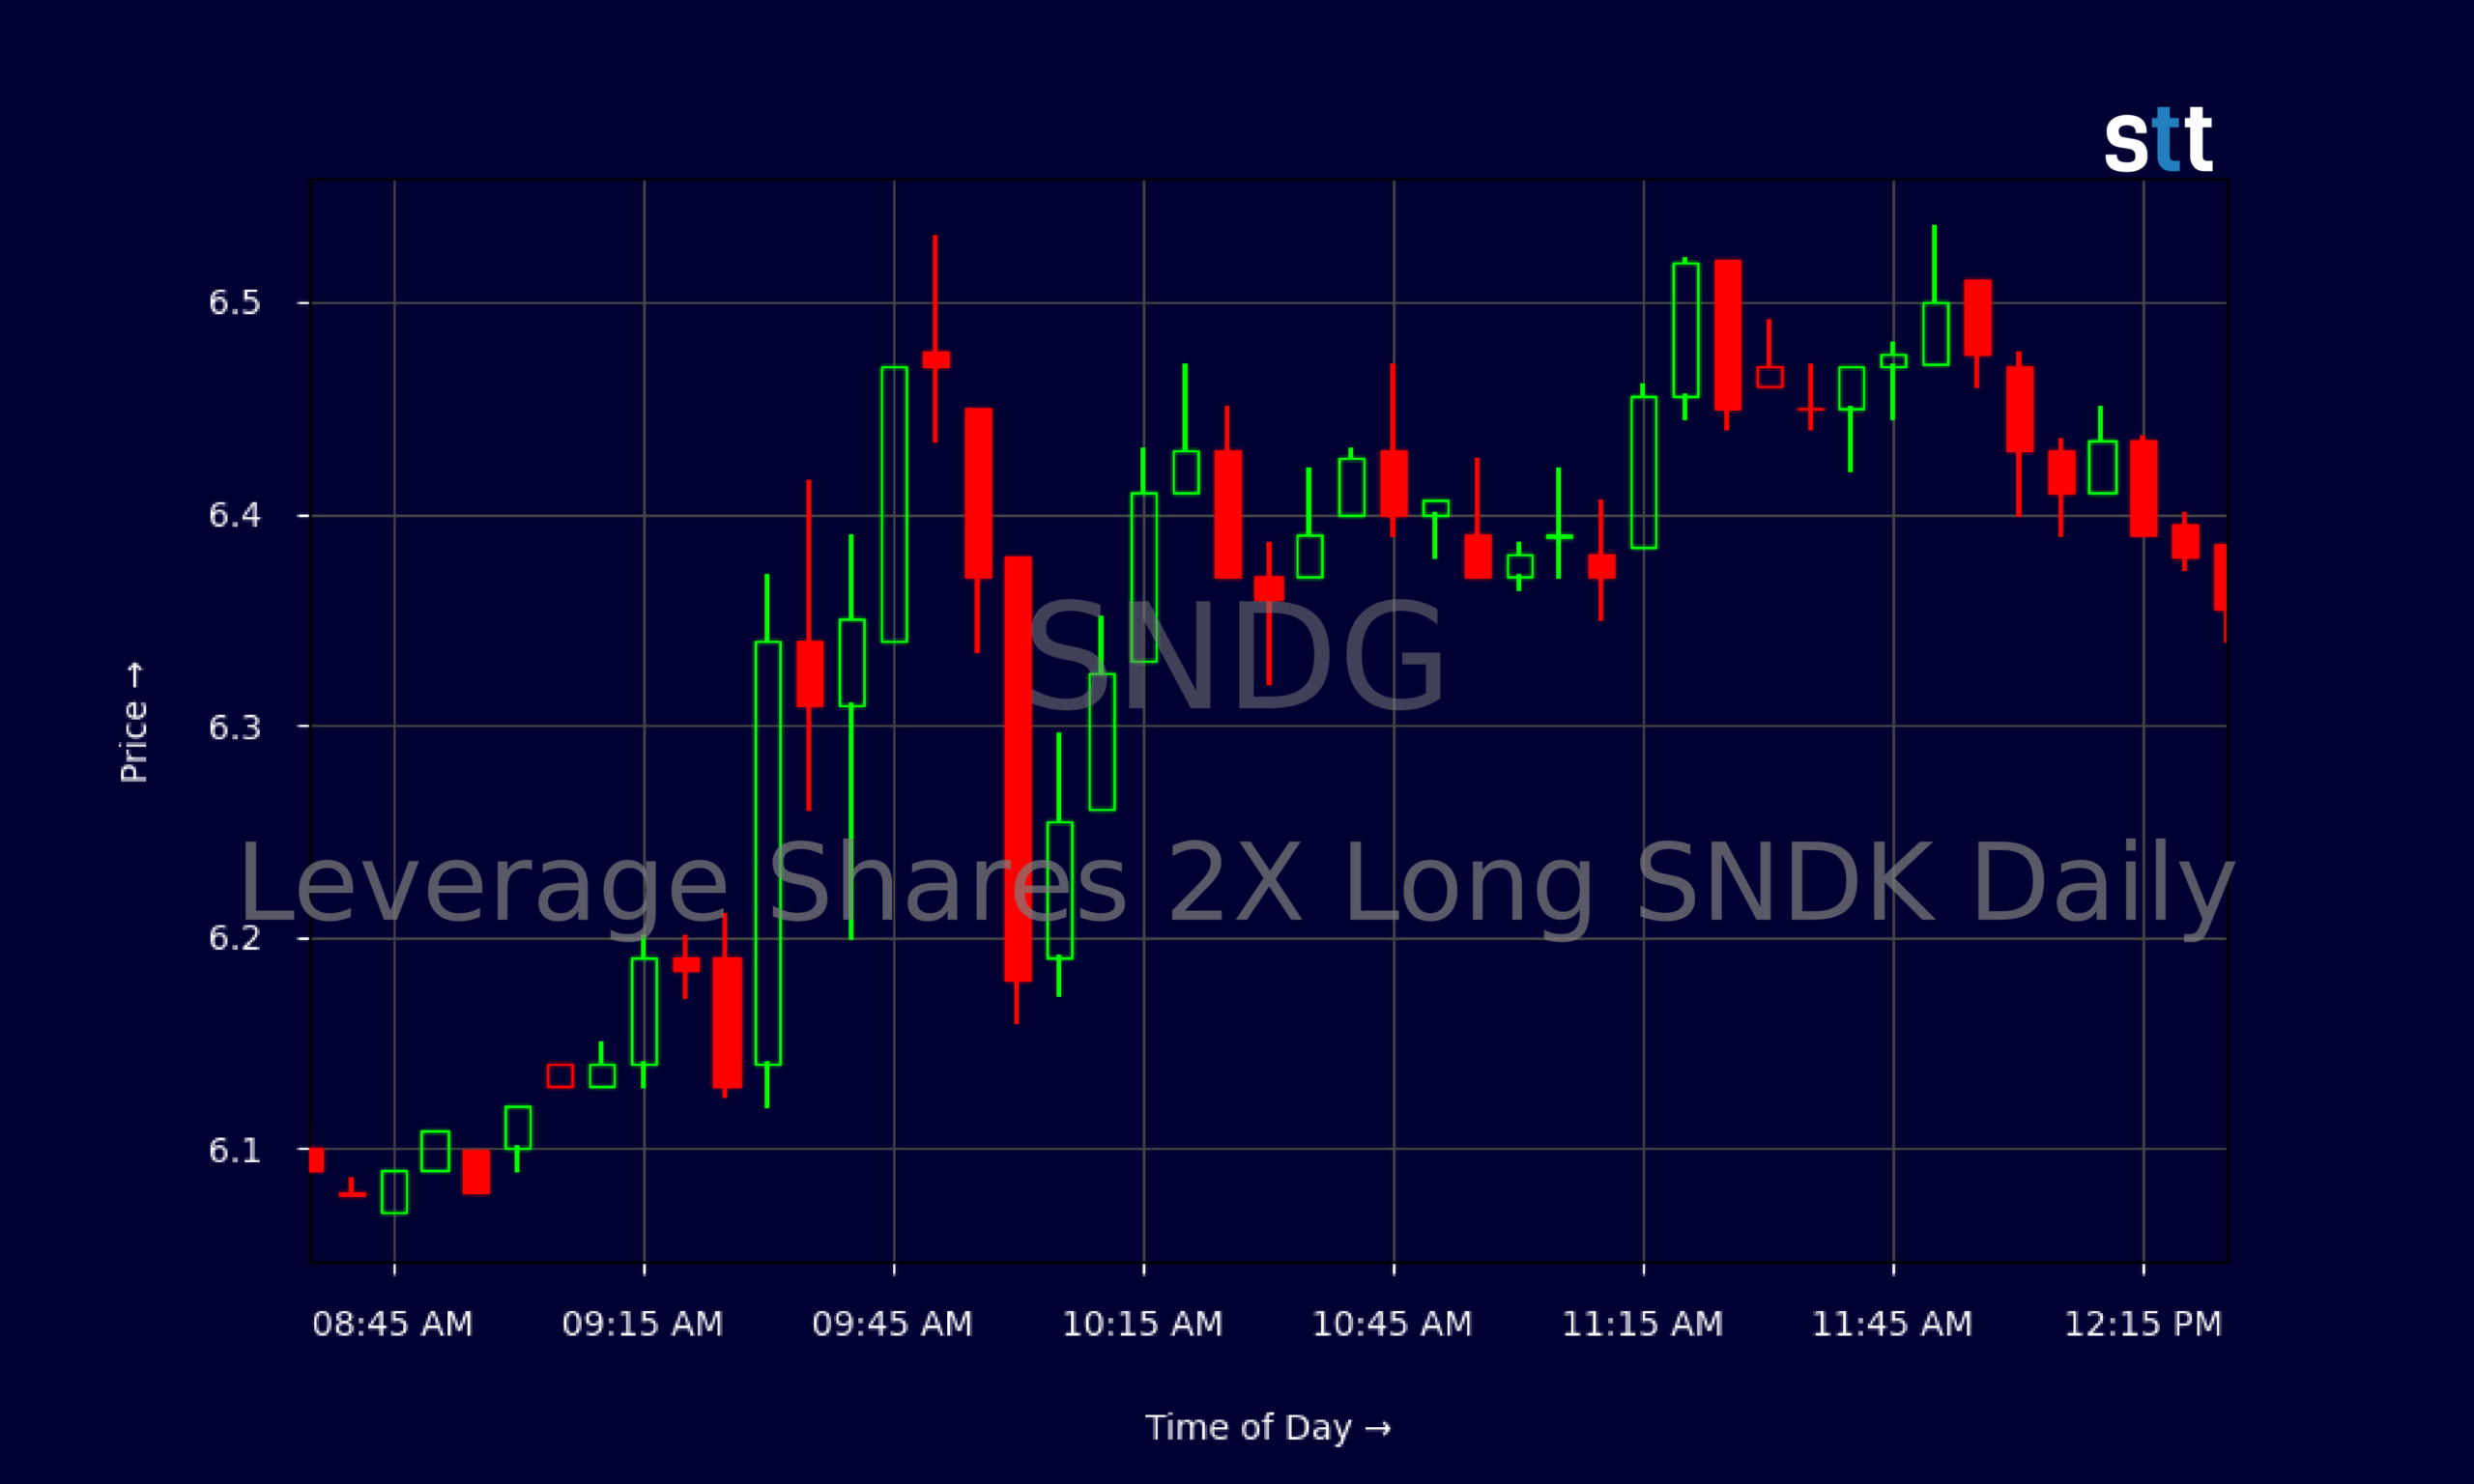
Live Update At 12:32:29 EDT: On Monday, October 19, 2026 Leverage Shares 2X Long SNDK Daily stock [BATS Global Markets: SNDG] is trending up by 13.13%! Discover the key drivers behind this movement as well as our expert analysis in the detailed breakdown below.
Quick Financial Overview
SNDG is a leveraged exchange‑traded product, Leverage Shares 2X Long SNDK Daily, designed to amplify daily moves in its Sandisk‑related exposure. That structure matters. SNDG is built for trading, not for long‑term holding, because the daily reset can cause value decay if the underlying chops sideways.
Over the recent period, SNDG has traded from a high near $11.32 down to a close of $6.335 on 2026/10/19. That’s a sharp slide of roughly 40% from recent highs. The daily candles tell the story: SNDG peaked around the $11 area on 2026/09/25–26 and has been stepping down almost every few sessions, with lower highs at $10–$9–$8 before landing in the $6s.
More Breaking News
- NOK Stock Slides As European ADR Weakness Deepens
- RTX Stock Strengthens As Mega Defense Wins Pile Up
- EOG Resources Stock Rises As Analysts Hike Price Targets
- Diamondback Energy Stock Climbs as Wall Street Lifts Price Targets
Key ratio fields for SNDG, like P/E or profit margins, are effectively blank because this is a derivative product, not an operating company printing revenue and earnings. For traders, the practical “fundamentals” are volatility, spread, and volume. The recent wide swings show that SNDG is still a high‑beta vehicle. But the latest tight intraday range suggests a pause, giving short‑term chart readers a clear area to define risk.
Why Traders Are Watching SNDG Price Action
SNDG traders thrive on volatility, and the last few weeks have delivered. From late September through early October, SNDG swung between $11 and $8, then $10 and $9, before finally cracking into the $7s and $6s. Those are big percentage moves in a short time window. That kind of range gives day traders multiple shots to nail clean entries and exits, as long as they respect risk.
Look at the recent daily closes: $10.96 on 2026/10/01, then $10.08, $9.90, $9.40, and $9.73 as SNDG chopped near $10. Then the breakdown accelerated — $9.03 open down to $8.46 close, followed by a slide from $8.01 to $7.45. By 2026/10/16, SNDG closed at $5.60 before bouncing slightly to $6.335 on 2026/10/19. That pattern shows heavy selling followed by a modest bounce, classic for a leveraged product after a hot run.
Intraday, SNDG’s 5‑minute chart around the $6.30–$6.50 zone shows a different phase. Early in the session, there were quick dips to $6.16–$6.20 and snaps back, but by late morning the tape tightened. Most candles settle between $6.37 and $6.50, with repeated failures near $6.52. That kind of compression in SNDG often comes before the next impulse move, either a reclaim toward $7+ or a breakdown through $6.
Because SNDG is 2X leveraged, each underlying tick matters more. Traders who follow the Tim Sykes style — cut losses fast, trade the pattern, not the story — will focus on these clear intraday levels. The current consolidation zone gives them specific lines in the sand to manage risk, while the broader daily downtrend in SNDG warns against chasing upside without a clear plan.
Conclusion
Right now, SNDG sits at an important crossroads on the chart. The big picture shows a leveraged product that ran hard toward $11, then bled off down into the $6 area. The shorter‑term view shows SNDG trying to build a base intraday, with repeated holds around $6.30 and failed pushes into the $6.50s. For active SNDG traders, that mix of recent volatility and current calm is exactly where disciplined plans matter most.
Without traditional earnings or valuation metrics, SNDG trading comes down to understanding leverage, trend, and liquidity. A decisive break above the recent intraday ceiling near $6.52 could open a push toward prior daily resistance zones in the mid‑$7s. A clean crack below $6, especially with volume, would confirm that sellers still control SNDG and that the downtrend remains intact.
Newer traders in SNDG need to remember that leverage cuts both ways. The same 2X exposure that boosts winning trades also magnifies mistakes if you ignore your stops. As Tim Sykes loves to say, “The market doesn’t care about your opinion, only your plan.” As Tim Bohen, lead trainer with StocksToTrade says, “A consistent trading routine beats sporadic action every time. Show up daily, and you’ll start to see the patterns others miss.” For those tracking SNDG and other leveraged names, the edge comes from studying the chart, sizing small, cutting losses quickly, and treating every trade as a lesson — not a promise. This analysis is for educational and research purposes only, not advice.
This is stock news, not investment advice. StocksToTrade News delivers real-time stock market updates tailored to highlight the key catalysts driving short-term price movements. Our coverage is designed for active traders and investors who thrive in fast-moving markets, with a focus on volatile sectors like penny stocks, AI stocks, Robinhood stocks and other momentum plays. From earnings reports and FDA approvals to mergers, new contracts, and unusual trading volume, we break down the events that can spark significant price action.
Looking to level up your trading game? Explore StocksToTrade, the ultimate platform for traders. With powerful tools designed for swing and day trading, integrated news scanning, and even social media monitoring, StocksToTrade keeps you one step ahead.
Check out our quick startup guide for new traders!
- How to Read Stock Charts: A Guide for Beginners
- Trading Plan: 6 Steps to Create One
- How To Create a Stock Watchlist
Ready to build your watchlists? Check out these curated lists:
Once your watchlist is set, take the next step and trade with confidence using StocksToTrade’s robust platform. Don’t miss out — grab your 14-day trial for just $7 and experience the edge you need to thrive in today’s fast-paced markets.