
Leverage Shares 2X Long CBRS Daily ETF faces heightened selling pressure as negative sentiment deepens, and stocks have been trading down by -10.37 percent.
Key Takeaways
- Leverage Shares 2X Long CBRS Daily ETF (CBRG) has dropped sharply from early-October highs near $2.80 to around $1.00, signaling intense selling pressure.
- Recent daily candles show a steady downtrend in CBRG with lower highs and lower lows, a classic warning sign for momentum traders.
- Intraday data on CBRG highlights tight consolidation around $1.00, suggesting a short-term battle between dip buyers and late shorts.
- Key leverage dynamics in CBRG mean small moves in the underlying can produce outsized swings, rewarding disciplined risk management.
Live Update At 12:32:58 EDT: On Wednesday, October 28, 2026 Leverage Shares 2X Long CBRS Daily ETF stock [BATS Global Markets: CBRG] is trending down by -10.37%! Discover the key drivers behind this movement as well as our expert analysis in the detailed breakdown below.
Quick Financial Overview
CBRG, the Leverage Shares 2X Long CBRS Daily ETF, is trading like a textbook volatility vehicle. In early October, CBRG was closing near $2.70–$2.80. Over the following sessions, it bled lower almost every day, finishing recently around $1.00. For traders, that is a drawdown of more than 60% in a few weeks.
Because CBRG is a 2X leveraged product, it aims to deliver roughly twice the daily move of its underlying exposure. That leverage cuts both ways. When the underlying trend turns against the ETF, losses compound quickly. The daily chart shows this clearly: CBRG peaks on 2026/10/05–2026/10/06 near the mid-$2 range, then stair-steps down through $2.00, $1.70, $1.30, and now the $1.00 zone.
More Breaking News
- DAVI Stock Pulls Back Sharply As Volatility Grips Traders
- GCTK Stock Jumps As Qare Data Platform Launch Fuels Momentum
- On Holding Stock Falls 3% After China Backlash
- BKYI Stock Surges As Middle East Deals Ignite Biometric Story
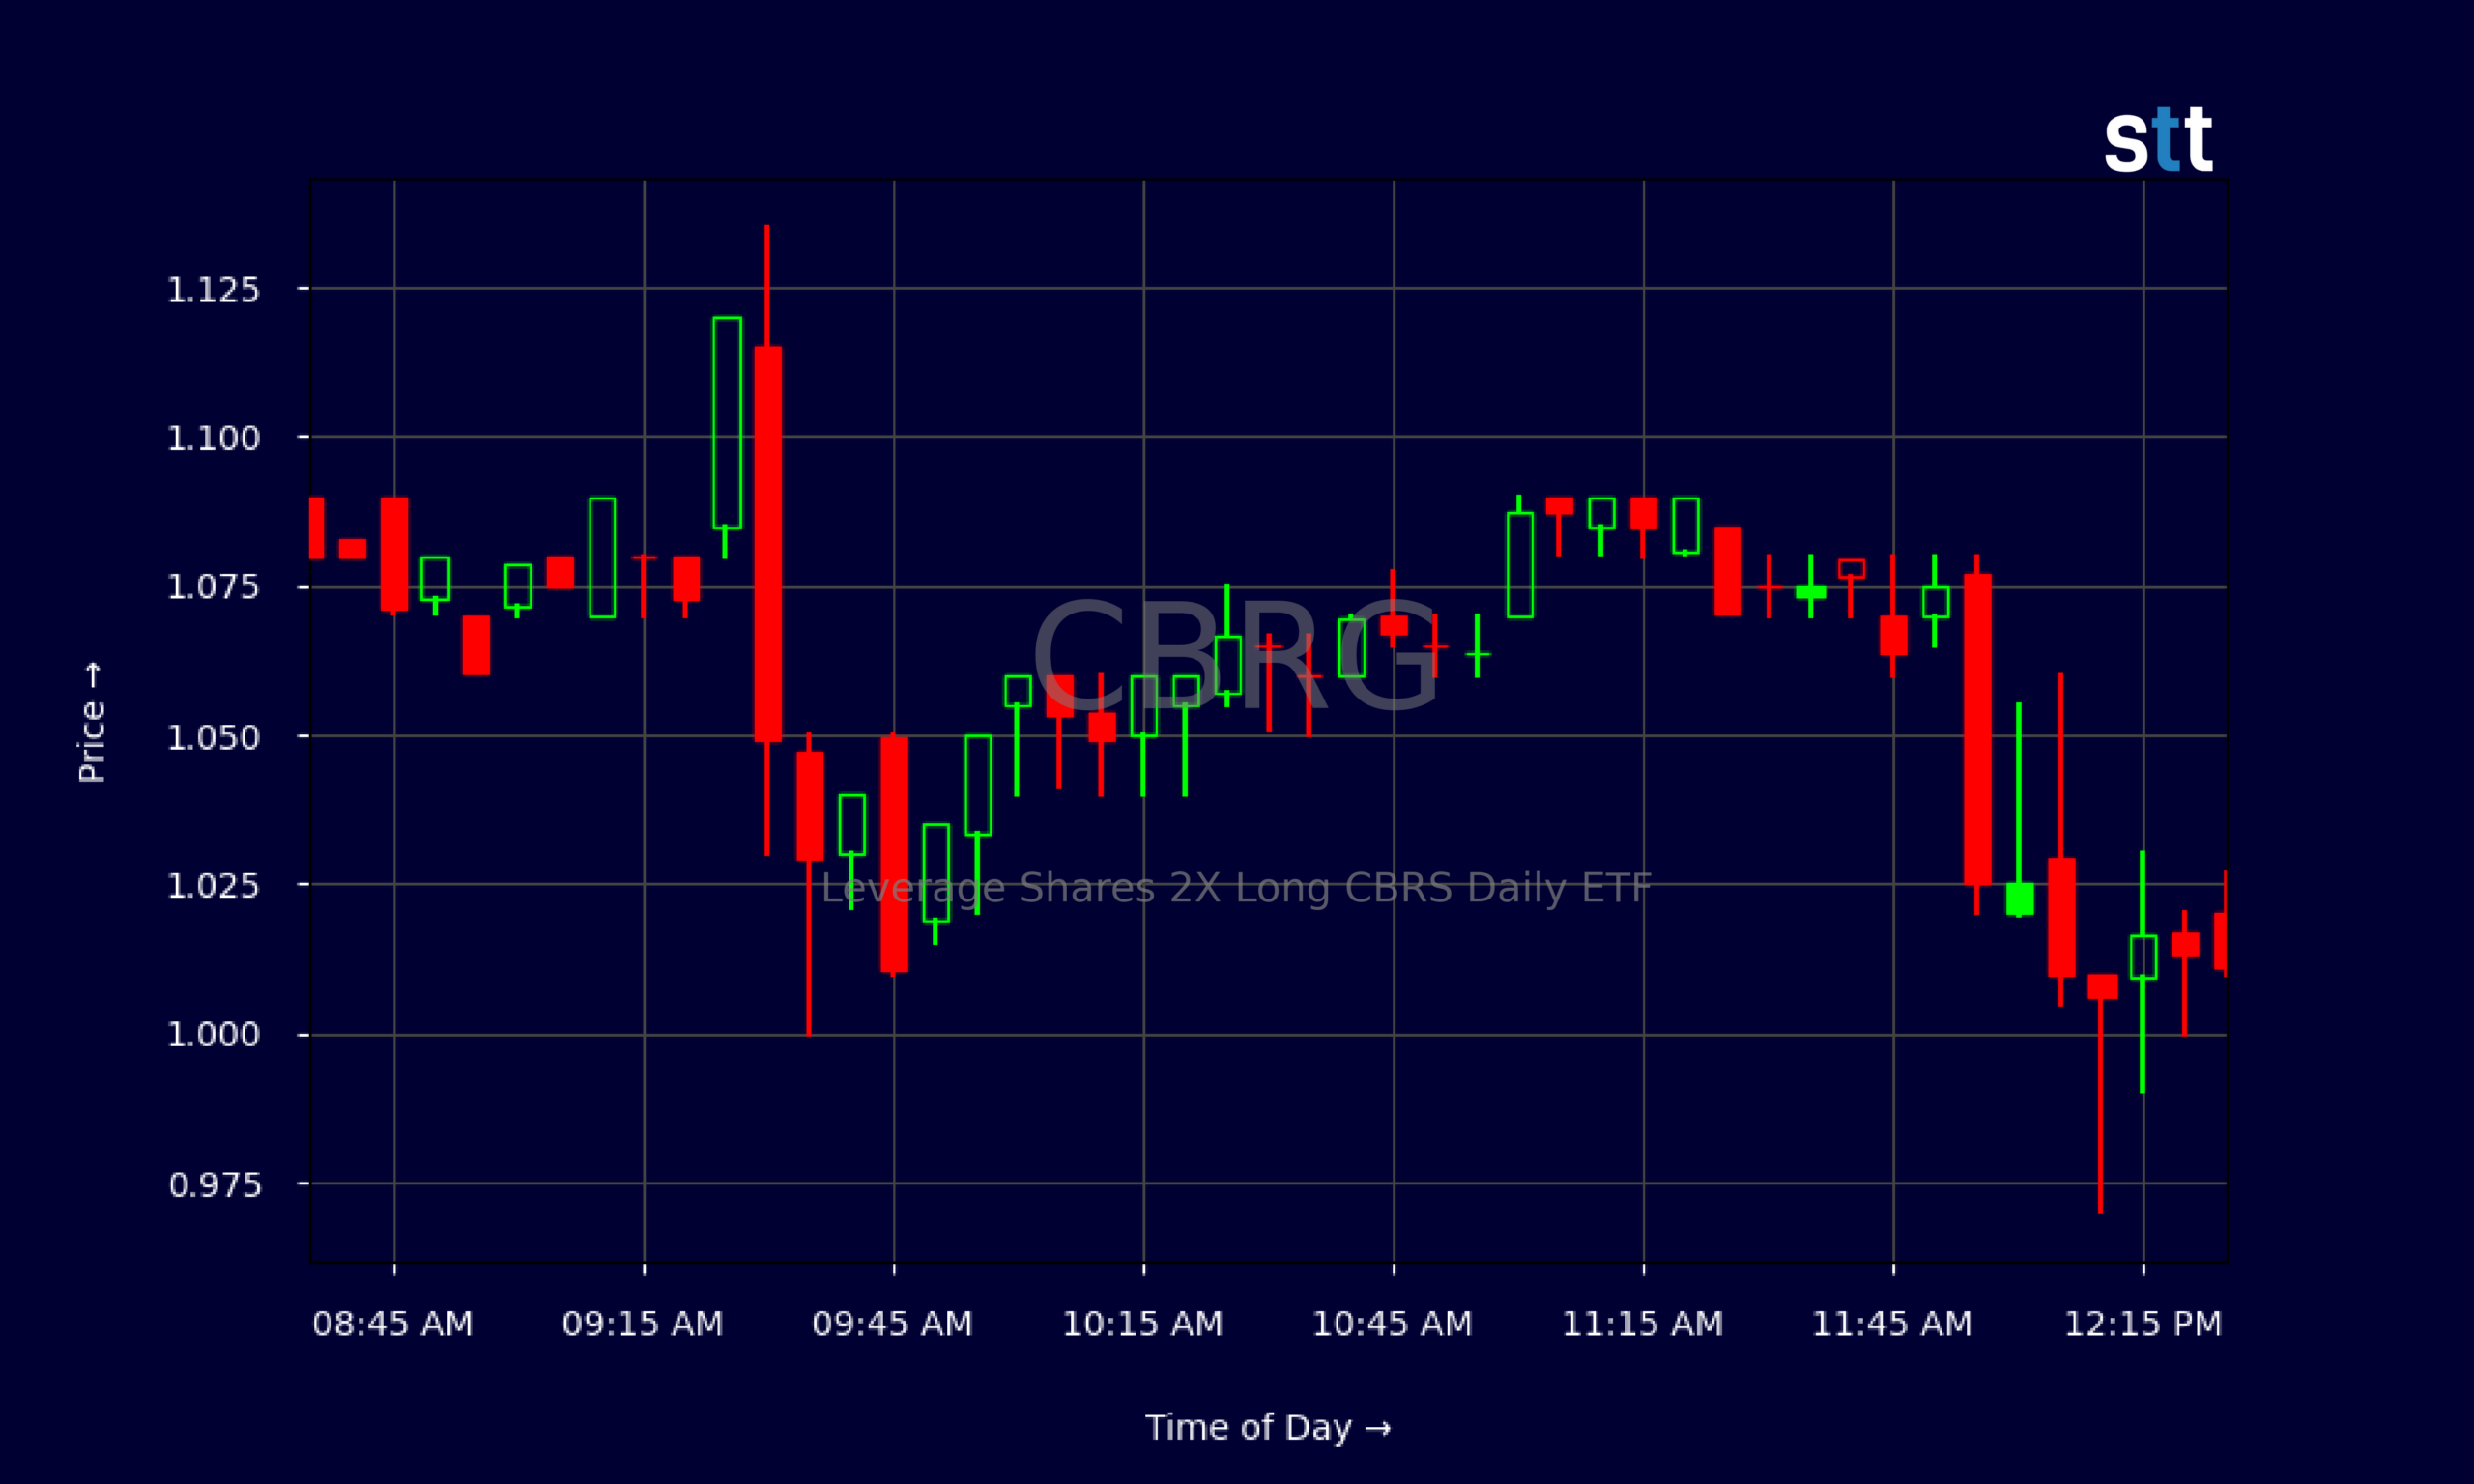
Intraday action underscores the fatigue. After an opening spike from $1.115 to $1.135, CBRG faded and then churned between roughly $1.00 and $1.10 for much of the session. That pattern tells traders that big trend players have already moved, and short-term scalpers now dominate. For active traders, CBRG’s numbers scream one thing: respect the leverage and keep position sizes tight.
Why Traders Are Watching CBRG’s Volatile Pullback
CBRG has been in full-on unwind mode. Earlier in the month, Leverage Shares 2X Long CBRS Daily ETF rewarded bulls with an aggressive run, closing as high as $2.76–$2.64 on 2026/10/05–2026/10/06 and spiking intraday to $2.86. Since then, the character has flipped. Each bounce on the CBRG chart has been weaker than the last, a textbook series of lower highs.
For momentum traders, that structure matters more than any headline. CBRG slipped from $2.36–$2.57 to the low $2.00s, then through the $1.70–$1.80 zone, and finally into the $1.10–$1.20 range. Now, with CBRG closing at $1.00, the ETF is testing a psychological whole-dollar level that often acts as a decision point. Either shorts press their edge and crack it, or fast hands step in for a dead-cat bounce.
The intraday 5‑minute data shows that story in slow motion. Early in the day, CBRG opened near $1.115, flushed down toward $1.03, then spent hours grinding between $1.04 and $1.09. Volume tends to stack around these consolidation boxes. For nimble traders, those tight ranges inside CBRG can be ideal for scalps, but brutal for anyone over-sizing or refusing to cut losses.
Because CBRG is a 2X leveraged ETF, time is an enemy when you are on the wrong side. Daily rebalancing and volatility decay make “hoping it comes back” a losing plan. That is why many experienced traders treat CBRG as a short-term vehicle, not a long-term hold. The current pullback is a live case study in how leveraged trends build, peak, and unwind.
Conclusion
Right now, CBRG is telling a simple story: big move up, bigger unwind down, and a potential inflection zone around $1.00. Leverage Shares 2X Long CBRS Daily ETF has already punished anyone who chased the early-October strength and then froze. The slide from the mid-$2s to $1.00 is what happens when traders forget how leverage amplifies both sides of the trade.
For day traders and swing traders, CBRG deserves respect, not fear. The intraday consolidation around $1.00 shows there is still liquidity and two-sided action. That is exactly what short-term traders want. But opportunity only matters if risk is handled first. Tight stops, predefined risk per trade, and a clear plan around whole-dollar levels all matter more than trying to guess the exact bottom in CBRG. As Tim Bohen, lead trainer with StocksToTrade says, “The best way to learn is by tracking trades, wins, losses, and lessons learned. Every trade has something to teach.” In a leveraged product like CBRG, tracking each trade and reviewing what worked and what failed can make the difference between steady progress and spiraling losses.
Tim Sykes often says, “Cut losses quickly, because small losses rarely turn into big losses, but big losses can end your trading career.” CBRG is a live reminder of that rule. Whether traders look to fade further weakness or snipe a bounce in Leverage Shares 2X Long CBRS Daily ETF, the edge comes from discipline, not prediction. Treat CBRG as a leveraged tool, stay humble, and let the chart—not emotions—drive every trading decision.
This is stock news, not investment advice. StocksToTrade News delivers real-time stock market updates tailored to highlight the key catalysts driving short-term price movements. Our coverage is designed for active traders and investors who thrive in fast-moving markets, with a focus on volatile sectors like penny stocks, AI stocks, Robinhood stocks and other momentum plays. From earnings reports and FDA approvals to mergers, new contracts, and unusual trading volume, we break down the events that can spark significant price action.
Looking to level up your trading game? Explore StocksToTrade, the ultimate platform for traders. With powerful tools designed for swing and day trading, integrated news scanning, and even social media monitoring, StocksToTrade keeps you one step ahead.
Check out our quick startup guide for new traders!
- How to Read Stock Charts: A Guide for Beginners
- Trading Plan: 6 Steps to Create One
- How To Create a Stock Watchlist
Ready to build your watchlists? Check out these curated lists:
Once your watchlist is set, take the next step and trade with confidence using StocksToTrade’s robust platform. Don’t miss out — grab your 14-day trial for just $7 and experience the edge you need to thrive in today’s fast-paced markets.