
Leverage Shares 2X Long CBRS Daily ETF rallied as bullish sector sentiment lifted chipmakers, and stocks have been trading up by 9.14 percent.
Click Here for a Millionaire's POV on Trading CBRG
SUBSCRIBE FOR ALERTSJOIN 50,000+ ACTIVE TRADERS
Key Takeaways
- Leverage Shares 2X Long CBRS Daily ETF has sold off sharply from late-September highs above $3, now trading near $1.
- Recent daily candles in CBRG show heavy downside momentum followed by a short-term attempt to base around the $1 zone.
- Intraday action in CBRG is tightening, with morning volatility fading into a narrow mid-day range near $1, signaling short-term consolidation.
- With no fundamental ratios available, traders in CBRG are relying almost entirely on chart levels, volatility, and liquidity for trade plans.
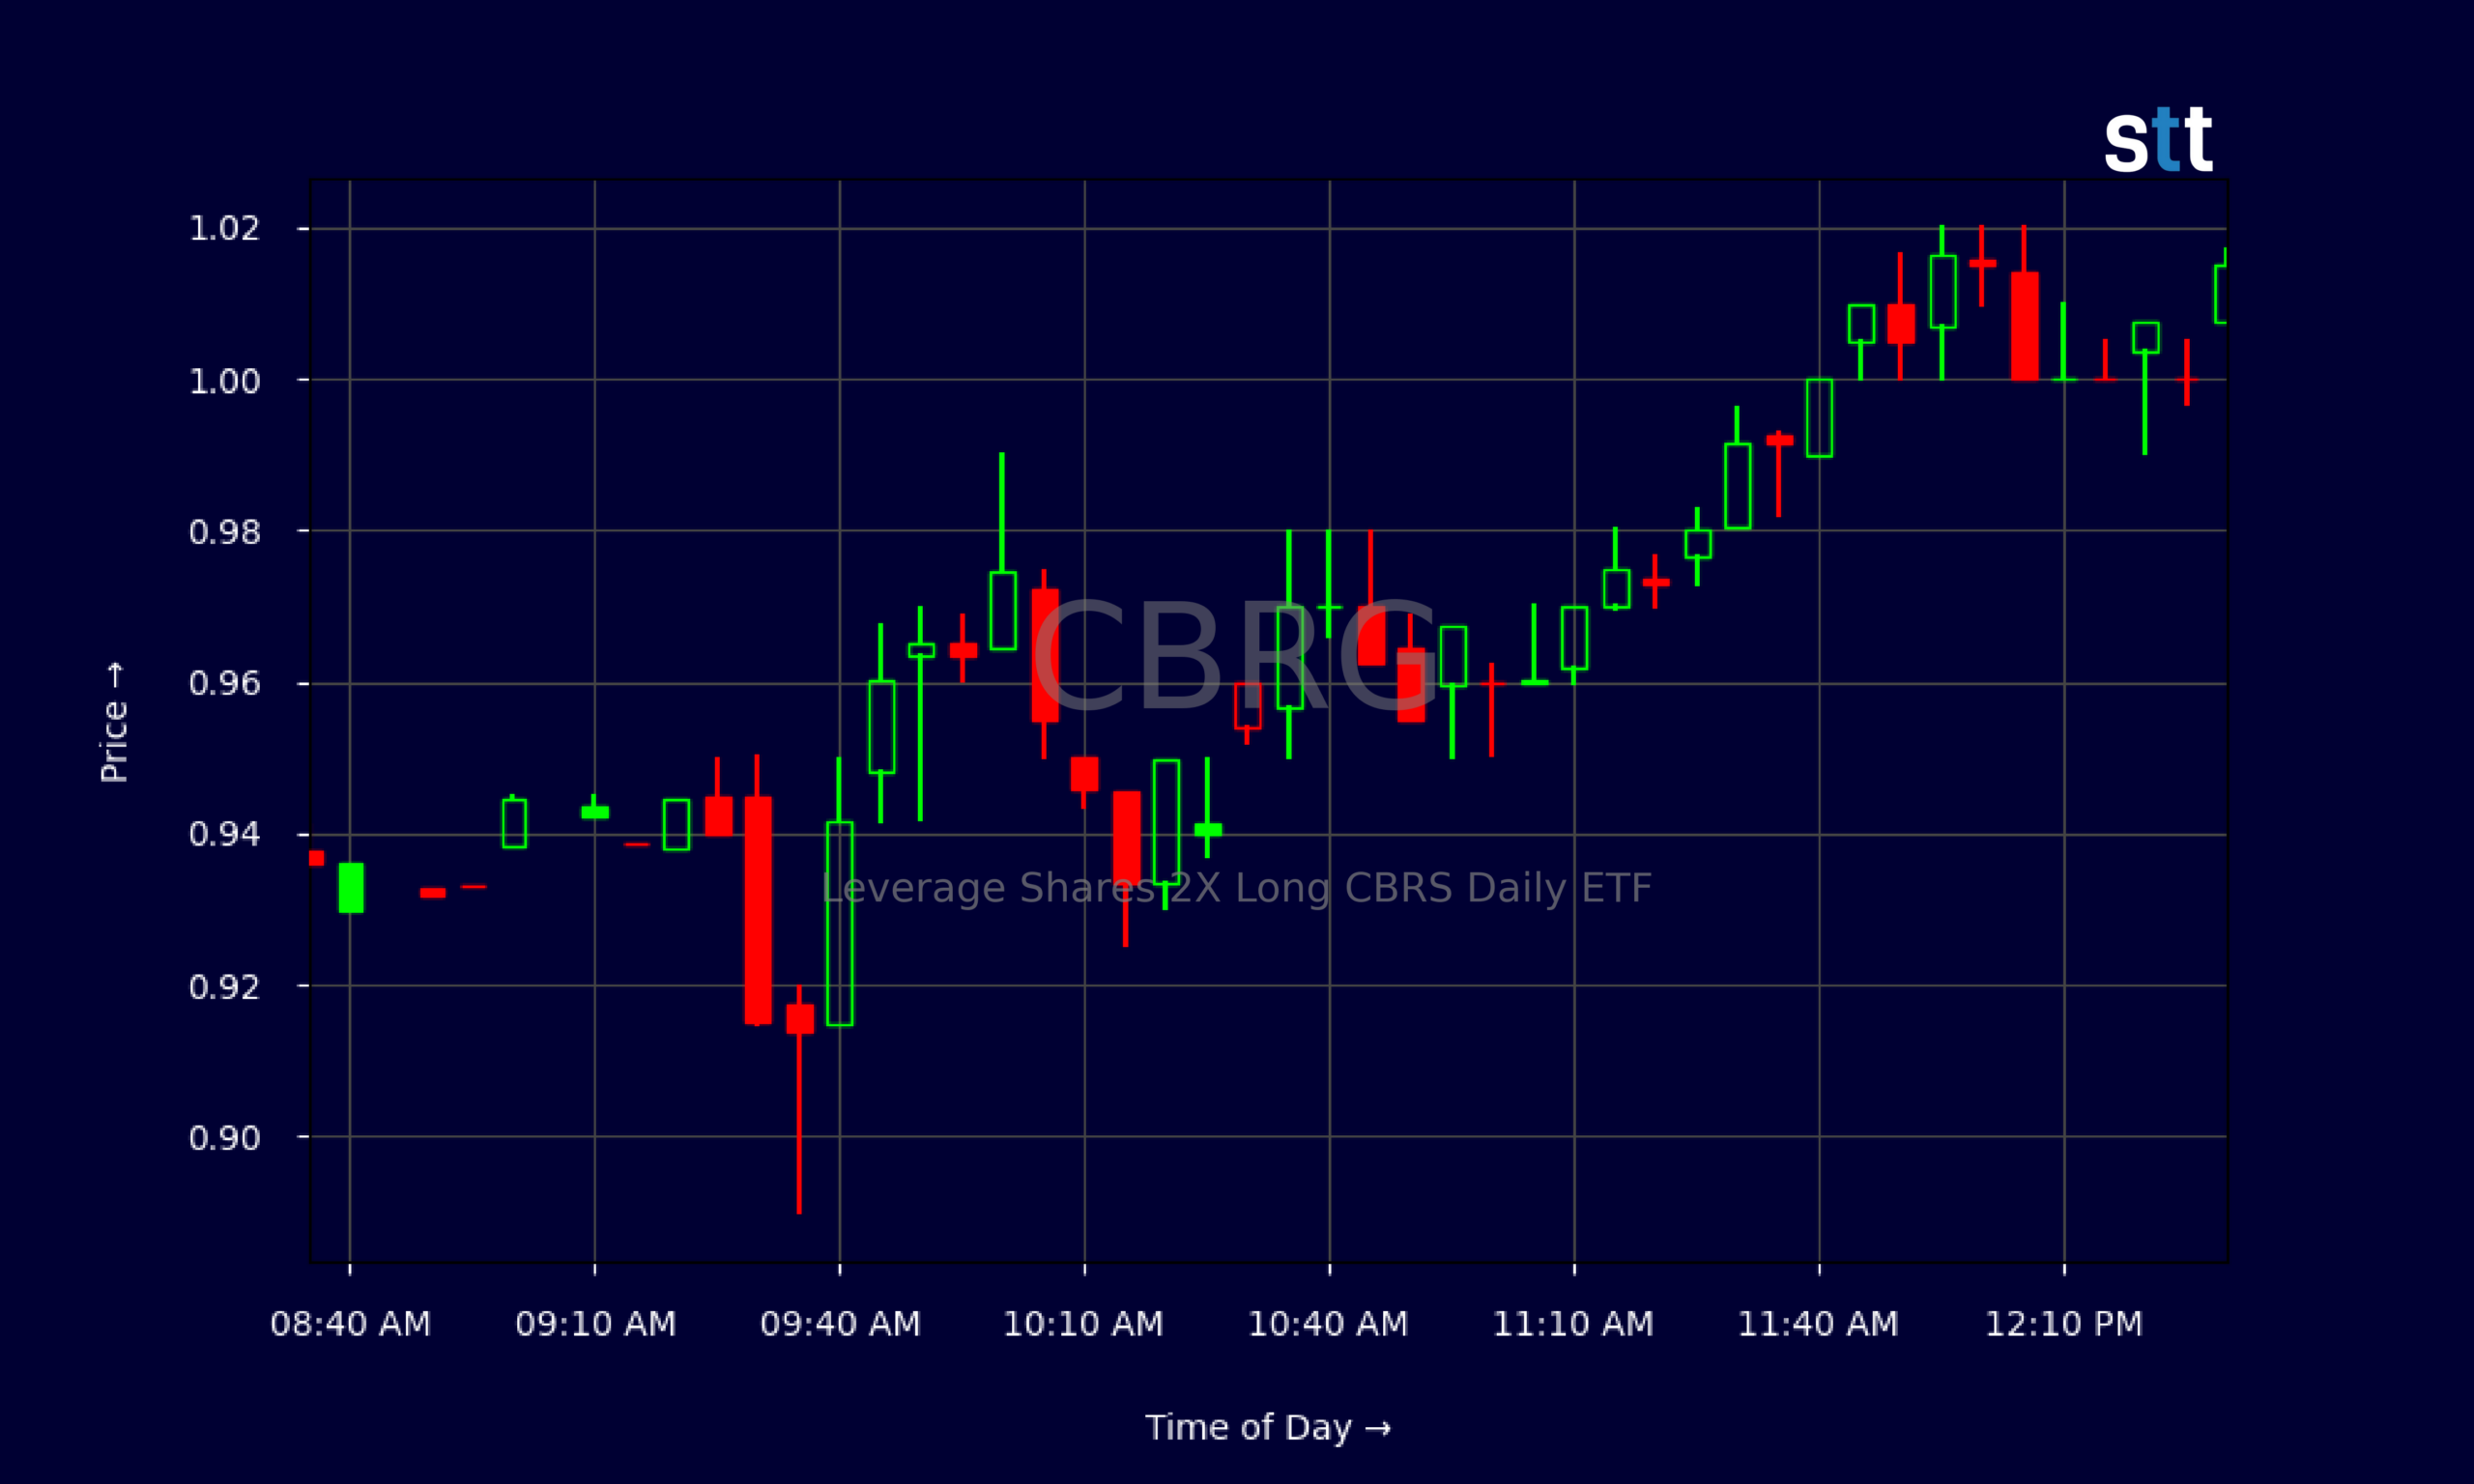
Live Update At 12:33:44 EDT: On Friday, October 23, 2026 Leverage Shares 2X Long CBRS Daily ETF stock [BATS Global Markets: CBRG] is trending up by 9.14%! Discover the key drivers behind this movement as well as our expert analysis in the detailed breakdown below.
Quick Financial Overview
Leverage Shares 2X Long CBRS Daily ETF, trading under ticker CBRG, is a leveraged product built for short-term trading, not long-term holding. The chart makes that crystal clear. At the end of September, CBRG changed hands around $3.20–$3.90. Over the next few weeks, the ETF slid in stages, giving back nearly two-thirds of its value and closing most recently just above $1.
Because CBRG is a leveraged ETF, it aims to deliver roughly 2x the daily return of its underlying exposure. That leverage cuts both ways. Strong moves in the base asset can translate into amplified swings in CBRG, which is why traders see such violent pushes both up and down on this chart.
More Breaking News
- SAIQ Stock Rockets As WISeSat.Space Rides Satellite Momentum
- CCI Stock Jumps As SpaceX Talks Ignite Tower Momentum
- AIXI Stock Draws Trader Focus As Volatility Spikes
- SAIQ Stock Rockets As WISeSat.Space Rides SpaceX And QSOC Hype
Fundamental ratios for CBRG are blank, which is typical for a trading vehicle like this. There is no earnings story to track and no classic valuation to lean on. For active traders, that means price action, volume, and key levels are the main tools. CBRG is behaving more like a pure momentum instrument than a traditional equity.
Why Traders Are Watching CBRG’s Price Action
The daily chart of CBRG reads like a textbook lesson in how leverage magnifies both opportunity and risk. From late September, CBRG ramped as high as $3.90 before momentum cracked. Once the selling started, CBRG put in a series of lower highs and lower lows, dropping through $3, then $2.50, then $2, and finally testing the $0.90–$1.00 area.
For short-term traders who focus on volatility, this is exactly the kind of movement that gets attention. Leverage Shares 2X Long CBRS Daily ETF has shown that when the underlying moves, CBRG doesn’t just drift; it rips. That works for both long and short traders, depending on the intraday trend.
Zoom in to the intraday five‑minute chart and you see a different story. Early in the day, CBRG traded as low as $0.89 and as high as roughly $0.99. After the opening volatility, the range tightened into a band around $0.97–$1.02. This kind of compression often tells traders that the market is catching its breath after a big slide.
CBRG traders now have a clear battleground. The $0.90 area marks recent support where dip buyers stepped in. The $1.05–$1.10 zone overhead lines up with intraday resistance. A push above that band with volume could trigger a short squeeze and a sharper bounce. A clean breakdown below $0.90, on the other hand, would confirm that sellers still control the tape. With no earnings or guidance to anchor expectations, CBRG is all about reading that tug-of-war in real time.
Conclusion
For active traders, CBRG is a reminder of what leveraged ETFs really are: short-term trading tools, not comfortable long-term holds. Leverage Shares 2X Long CBRS Daily ETF has already shown how quickly gains can vanish. A slide from the $3s to near $1 in a few weeks punishes anyone who overstays, but it also opens opportunity for disciplined day traders who respect risk.
Right now, CBRG is trying to stabilize around the $1 area after an aggressive downtrend. That zone becomes a key line in the sand. Above it, traders can map potential bounces toward prior resistance around $1.20–$1.30 and then $1.50. Below it, the path of least resistance stays lower, and any long bias needs to be kept on a tight leash.
Because traditional financial metrics for CBRG are not the driver, the edge comes from preparation, pattern recognition, and fast execution. As Tim Sykes likes to tell traders, “Patterns repeat, traders don’t.” That idea lines up with another core trading principle: clarity before action. As Tim Bohen, lead trainer with StocksToTrade says, “If you’re still guessing at the end of your analysis, it’s probably not a trade worth taking.” Applied here, the message is simple: study how CBRG has moved on big green days and big red days, build a plan around those patterns, and always, always cut losses quickly. This analysis is for educational and research purposes only, but the risk management lessons from CBRG’s chart are very real.
This is stock news, not investment advice. StocksToTrade News delivers real-time stock market updates tailored to highlight the key catalysts driving short-term price movements. Our coverage is designed for active traders and investors who thrive in fast-moving markets, with a focus on volatile sectors like penny stocks, AI stocks, Robinhood stocks and other momentum plays. From earnings reports and FDA approvals to mergers, new contracts, and unusual trading volume, we break down the events that can spark significant price action.
Looking to level up your trading game? Explore StocksToTrade, the ultimate platform for traders. With powerful tools designed for swing and day trading, integrated news scanning, and even social media monitoring, StocksToTrade keeps you one step ahead.
Check out our quick startup guide for new traders!
- How to Read Stock Charts: A Guide for Beginners
- Trading Plan: 6 Steps to Create One
- How To Create a Stock Watchlist
Ready to build your watchlists? Check out these curated lists:
Once your watchlist is set, take the next step and trade with confidence using StocksToTrade’s robust platform. Don’t miss out — grab your 14-day trial for just $7 and experience the edge you need to thrive in today’s fast-paced markets.