
Leverage Shares 2X Long CBRS Daily ETF faces pressure as negative sentiment drives profit-taking; stocks have been trading down by -7.28 percent
Click Here for a Millionaire's POV on Trading CBRG
SUBSCRIBE FOR ALERTSJOIN 50,000+ ACTIVE TRADERS
Key Takeaways
- CBRG has fallen from the $3.60–$3.90 area to near $1.20, showing a sharp momentum unwind.
- Recent intraday trading in CBRG shows tight consolidation around $1.20–$1.25 after a morning flush.
- As a leveraged ETF, CBRG is amplifying moves in its underlying, increasing both intraday opportunity and risk.
- With no clear fundamental data, traders in CBRG are leaning heavily on charts, volume, and volatility signals.
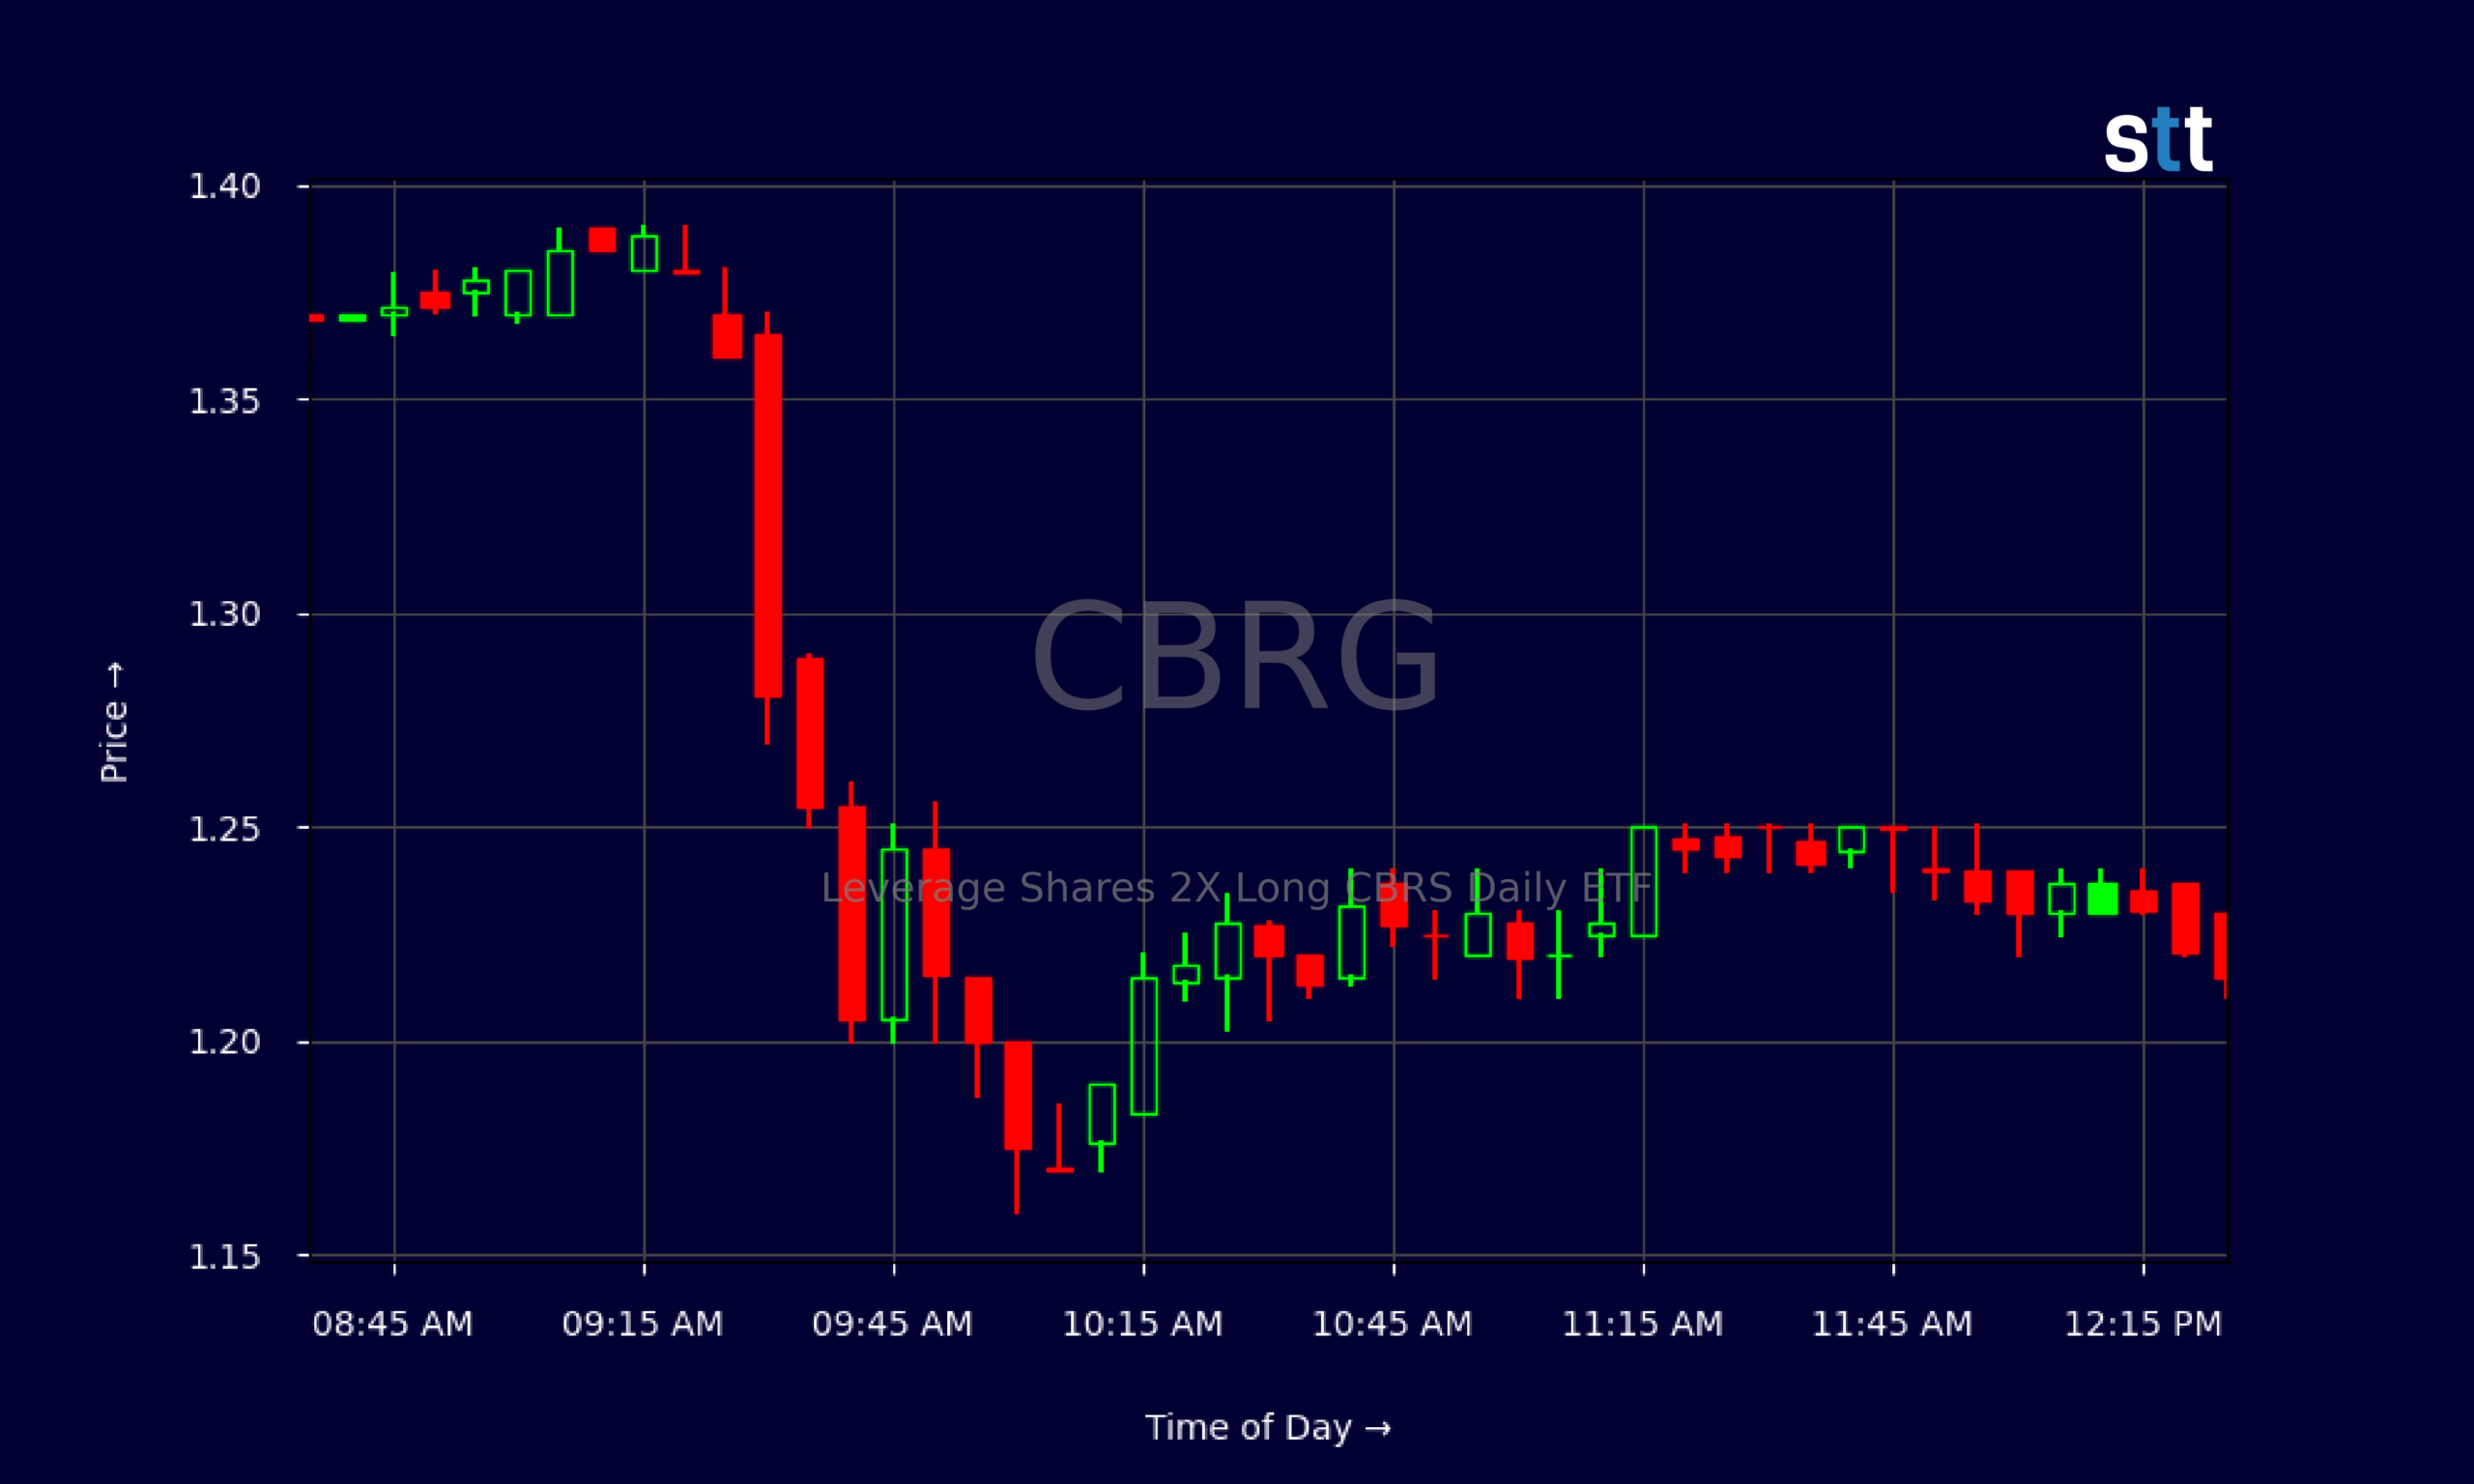
Live Update At 12:32:30 EDT: On Monday, October 19, 2026 Leverage Shares 2X Long CBRS Daily ETF stock [BATS Global Markets: CBRG] is trending down by -7.28%! Discover the key drivers behind this movement as well as our expert analysis in the detailed breakdown below.
Quick Financial Overview
Leverage Shares 2X Long CBRS Daily ETF, trading under the ticker CBRG, is a pure trading vehicle. It is built to magnify the daily moves of its underlying exposure, not to post steady earnings or clean balance sheets. That’s why the usual financial ratios for CBRG are basically blank. For traders, the chart is the financial statement.
Over the past few weeks, CBRG has dropped from closes near $3.60–$3.90 down to roughly $1.20. That is a drawdown of more than 60%, a textbook momentum rollover. Each bounce has been sold, with lower highs from $3.90 to $3.70, then $3.30, then the $2.70 area, before finally washing out.
More Breaking News
- NOK Stock Slides As European ADR Weakness Deepens
- TTD Drops As Evercore Flags Weak Ad Demand Risks
- ONDS Stock Pulls Back As Traders Weigh Rich Valuation
- FMX Stock Holds Up As UBS Trims Price Target, Bond Deal Shines
On the latest trading day, CBRG opened around $1.37 and closed near $1.21, confirming that sellers still control the bigger trend. Intraday data shows heavy early pressure, with a fast slide from the $1.28–$1.30 open down to $1.17 before stabilizing. For active traders, that kind of range—roughly 8–10% in a single session—keeps CBRG firmly on the day-trading radar.
Why Traders Are Watching CBRG Price Action
CBRG has one thing serious traders want: volatility. The ETF’s job is to give 2X exposure to its underlying CBRS theme, and that leverage cuts both ways. In late September and early October, CBRG was a momentum monster, printing highs around $3.90 on 2026/09/25 and holding the $3.20–$3.70 zone for several days. That stretch rewarded aggressive long trading when the trend was up.
Then the air came out.
From 2026/09/29 onward, every rally in CBRG has been weaker than the last. The ETF slipped from $3.28 to $2.76, then to the mid-$2.30s, then into the low $2s. By 2026/10/12, the close near $1.78 signaled a clear break of the prior uptrend. The final leg down into the $1.20s shows what happens when a leveraged product loses its underlying support—losses stack quickly.
Intraday, CBRG now trades like a classic fade-and-base pattern. The premarket and open around $1.36–$1.38 faded into a morning low near $1.17. After that flush, CBRG spent hours chopping between $1.21 and $1.25, with repeated attempts to reclaim $1.25 failing. That tells traders two things: dip buyers are trying to defend this area, but overhead supply is still heavy.
For short-term trading, those levels matter. Momentum traders watching CBRG are eyeing $1.16–$1.17 as the current support zone and $1.25–$1.30 as the first real resistance band. A clean break and hold above that band with volume could trigger a short squeeze-style bounce. A crack below the recent low would confirm the downtrend and open the door to further downside. In a leveraged ETF like CBRG, either scenario can move fast.
Conclusion
CBRG is a reminder that leverage is a tool, not a gift. The same 2X structure that helped CBRG ramp toward $3.90 on the upside has pulled it back to roughly one-third of that level once momentum reversed. With no traditional earnings story, CBRG lives and dies by the tape: price, volume, and volatility. That is exactly why many active traders track this ETF so closely.
Right now, CBRG is trying to carve out a base after a heavy slide. The tight intraday range around $1.20–$1.25 shows traders are in a wait-and-see mode, scalping the range while they watch for the next clean trend. For some, that means stalking a bounce if CBRG can reclaim prior intraday highs. For others, it means waiting for a breakdown through support to lean short. In either case, knowing when not to trade can be as important as pulling the trigger, because plenty of marginal setups simply aren’t worth the risk. As Tim Bohen, lead trainer with StocksToTrade says, “Time and experience have taught me that missed opportunities are part of the game. There’s always another setup around the corner.”
The key is discipline. Leveraged products like CBRG can punish hesitation. As Tim Sykes likes to say, “Cut losses quickly, because big losses start out as small ones.” For traders studying CBRG, the lesson is clear: respect the leverage, trade the chart, and always treat this ETF as a short-term trading vehicle. This analysis is for educational and research purposes only, and every trader must make their own decisions based on their risk tolerance and rules.
This is stock news, not investment advice. StocksToTrade News delivers real-time stock market updates tailored to highlight the key catalysts driving short-term price movements. Our coverage is designed for active traders and investors who thrive in fast-moving markets, with a focus on volatile sectors like penny stocks, AI stocks, Robinhood stocks and other momentum plays. From earnings reports and FDA approvals to mergers, new contracts, and unusual trading volume, we break down the events that can spark significant price action.
Looking to level up your trading game? Explore StocksToTrade, the ultimate platform for traders. With powerful tools designed for swing and day trading, integrated news scanning, and even social media monitoring, StocksToTrade keeps you one step ahead.
Check out our quick startup guide for new traders!
- How to Read Stock Charts: A Guide for Beginners
- Trading Plan: 6 Steps to Create One
- How To Create a Stock Watchlist
Ready to build your watchlists? Check out these curated lists:
Once your watchlist is set, take the next step and trade with confidence using StocksToTrade’s robust platform. Don’t miss out — grab your 14-day trial for just $7 and experience the edge you need to thrive in today’s fast-paced markets.