

LEIFRAS Co. Ltd. surged as investors cheered its most impactful growth announcement; stocks have been trading up by 25.23 percent.
Market Insights For Active LFS Traders
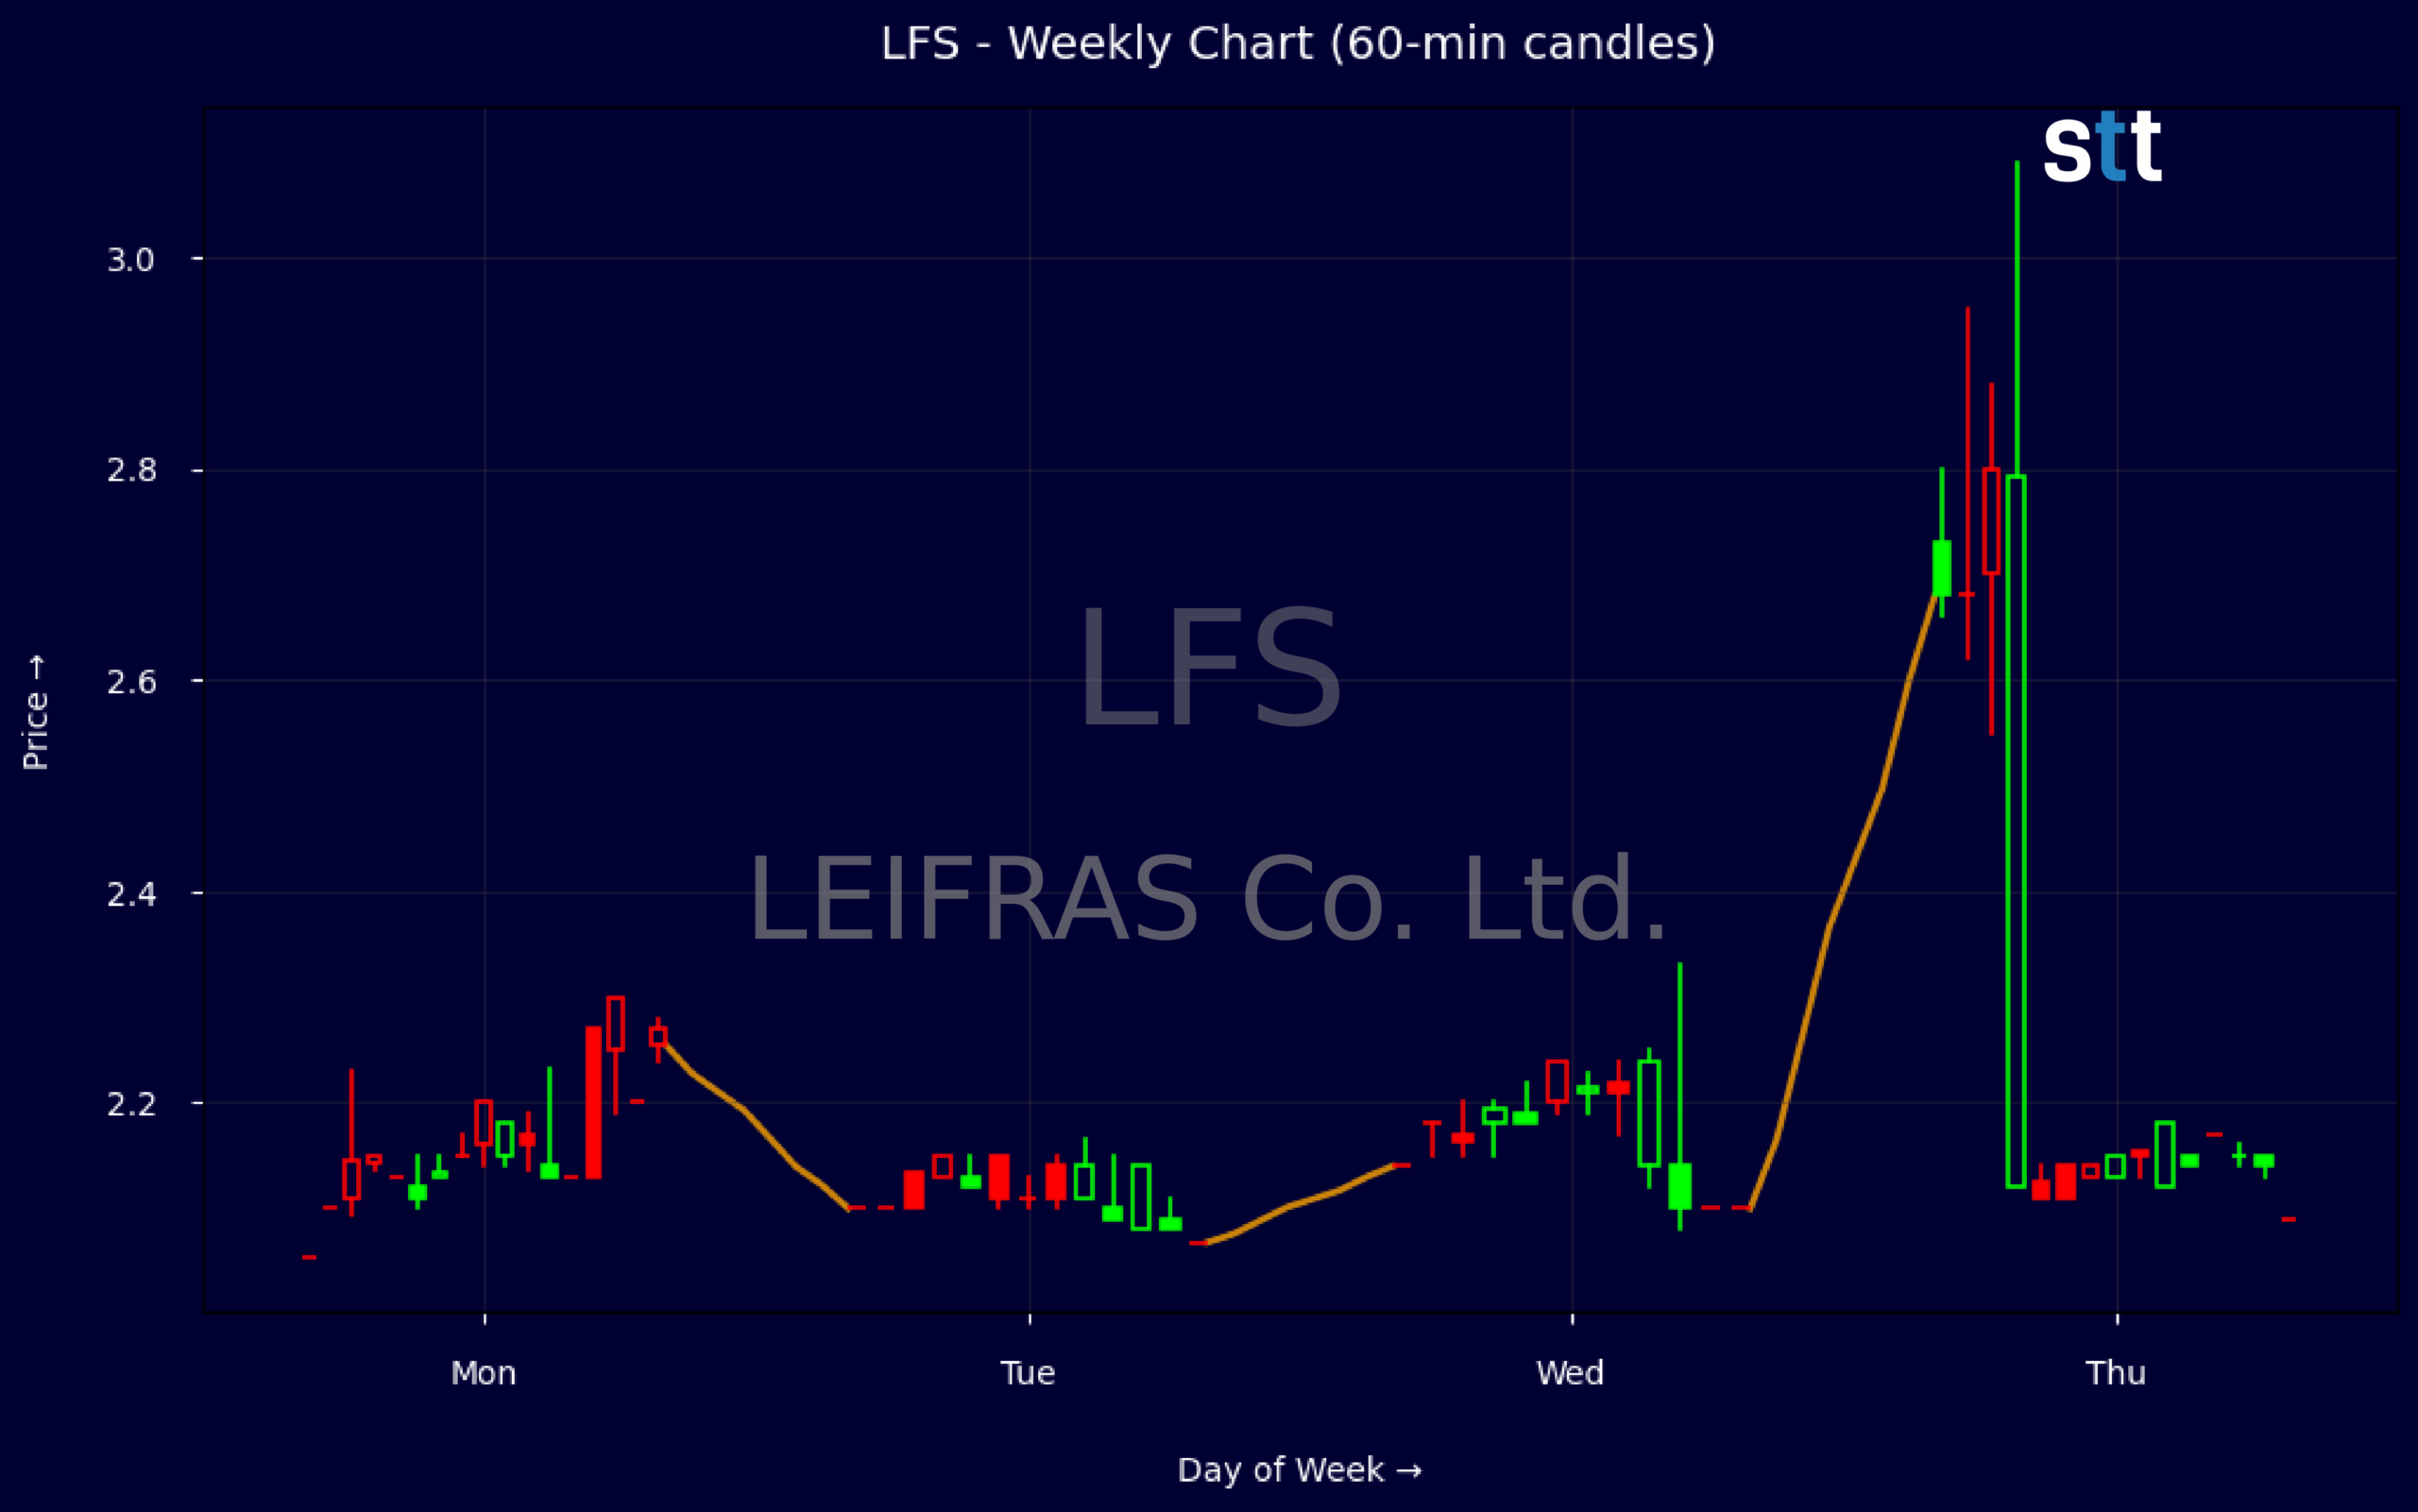
- Weekly chart shows a sharp move from roughly 2.10 to 2.73, signaling fresh momentum in LFS after a quiet stretch.
- Intraday action near 2.12 suggests short-term consolidation after the initial push, with tight range behavior.
- Strong cash position on LEIFRAS Co. Ltd.’s balance sheet gives traders confidence the company can fund operations without near-term stress.
- Valuation metrics like a 0.85 price-to-sales ratio and 5.4 price-to-book point to a market still pricing in growth expectations.
- Leveraged capital structure and elevated equity valuation make risk management critical as LFS trades around recent highs.
Weekly Update Jun 15 – Jun 19, 2026: On Sunday, June 21, 2026 LEIFRAS Co. Ltd. stock [NASDAQ: LFS] is trending up by 25.23%! Discover the key drivers behind this movement as well as our expert analysis in the detailed breakdown below.
Consumer Staples industry expert:
Analyst sentiment – positive
LFS operates as a small-cap player at the intersection of Consumer Staples and education services, with an enterprise value of ~$45m and a modest 0.85x price-to-sales but a rich 5.4x price-to-book, implying high expectations on a relatively light asset base. Balance sheet quality is strong: cash of $2.5bn versus total liabilities of $2.8bn, low long-term debt (0.16 LT debt-to-capital), and solid ROIC at 17.4%, supporting disciplined capital allocation despite lack of disclosed margin metrics.
Technically, LFS has broken out of a tight consolidation: three sessions pinned around 2.05–2.14 were followed by a sharp expansion to a 3.09 intraday high and 2.73 close, confirming a strong upside impulse on elevated volume. The dominant trend is now short-term bullish with an emerging higher-low structure on intraday 5-minute candles. A key actionable level is 2.40–2.45 as first support; sustained trading above this zone favors continuation toward 3.00–3.10.
More Breaking News
- NU Stock Plunges Nearly 20% As Volatility Spikes
- SNDG ETF Slides As Volatility Tests Momentum Traders
- MSTR Stock Holds Key Range As Volatility Tightens
- NRXP Stock Eyes FDA Catalyst As Ketamine Momentum Builds
Near-term catalysts are muted given the absence of fresh news, so price will be driven primarily by technical momentum and sector flows. Versus broader Consumer Staples and education peers, LFS offers superior balance sheet strength and ROIC but trades more like a speculative growth story. I expect outperformance if 2.40 support holds, with a tactical upside target of 3.20 and secondary resistance near 3.50. A definitive downside line-in-the-sand sits at 2.10; a weekly close below turns the setup structurally weaker.
Quick Financial Overview
LEIFRAS Co. Ltd. shows a balance sheet built around liquidity and cash flexibility. Cash and cash equivalents are about $2.52B out of total assets of roughly $4.68B, which means more than half the asset base is in cash. For traders, that usually signals room for ongoing operations, potential expansion, or defensive moves if the market turns. Working capital of about $1.22B suggests the company can handle short-term obligations without strain.
On the risk side, total liabilities sit near $2.83B, with a leverage ratio of 2.5 and long-term debt and lease obligations around $347M. That is not extreme, but it does mean LFS is not a zero-debt, low-risk balance sheet play. Price-to-sales around 0.85 implies the market is valuing the company at just under one year of revenue for each dollar of market cap, while price-to-book at 5.4 shows traders are paying a premium over accounting equity.
Return metrics matter for trading confidence. A 1-year return on invested capital (ROIC) of 17.4% is solid and tells traders that management has been able to generate attractive returns on the capital base. The weekly chart confirms renewed interest: price stepped from about 2.05–2.14 early in the week to a close near 2.73, representing a strong percentage move. Intraday, the 5-minute candle between 2.11 and 2.18, closing near 2.12, shows a tight, controlled range, hinting that after the spike, LFS is pausing as traders reassess risk and reward.
Conclusion
This is stock news, not investment advice. StocksToTrade News delivers real-time stock market updates tailored to highlight the key catalysts driving short-term price movements. Our coverage is designed for active traders and investors who thrive in fast-moving markets, with a focus on volatile sectors like penny stocks, AI stocks, Robinhood stocks and other momentum plays. From earnings reports and FDA approvals to mergers, new contracts, and unusual trading volume, we break down the events that can spark significant price action.
Looking to level up your trading game? Explore StocksToTrade, the ultimate platform for traders. With powerful tools designed for swing and day trading, integrated news scanning, and even social media monitoring, StocksToTrade keeps you one step ahead.
Check out our quick startup guide for new traders!
- How to Read Stock Charts: A Guide for Beginners
- Trading Plan: 6 Steps to Create One
- How To Create a Stock Watchlist
Ready to build your watchlists? Check out these curated lists:
Once your watchlist is set, take the next step and trade with confidence using StocksToTrade’s robust platform. Don’t miss out — grab your 14-day trial for just $7 and experience the edge you need to thrive in today’s fast-paced markets.