

Keel Infrastructure Corp. surged as investors cheered its major government-backed transport project win; stocks have been trading up by 14.55 percent.
Key Takeaways
- Shares of Keel Infrastructure Corp. have bounced from a recent low near $1.90 to around $2.17, showing short-term momentum after a sharp multi-week pullback.
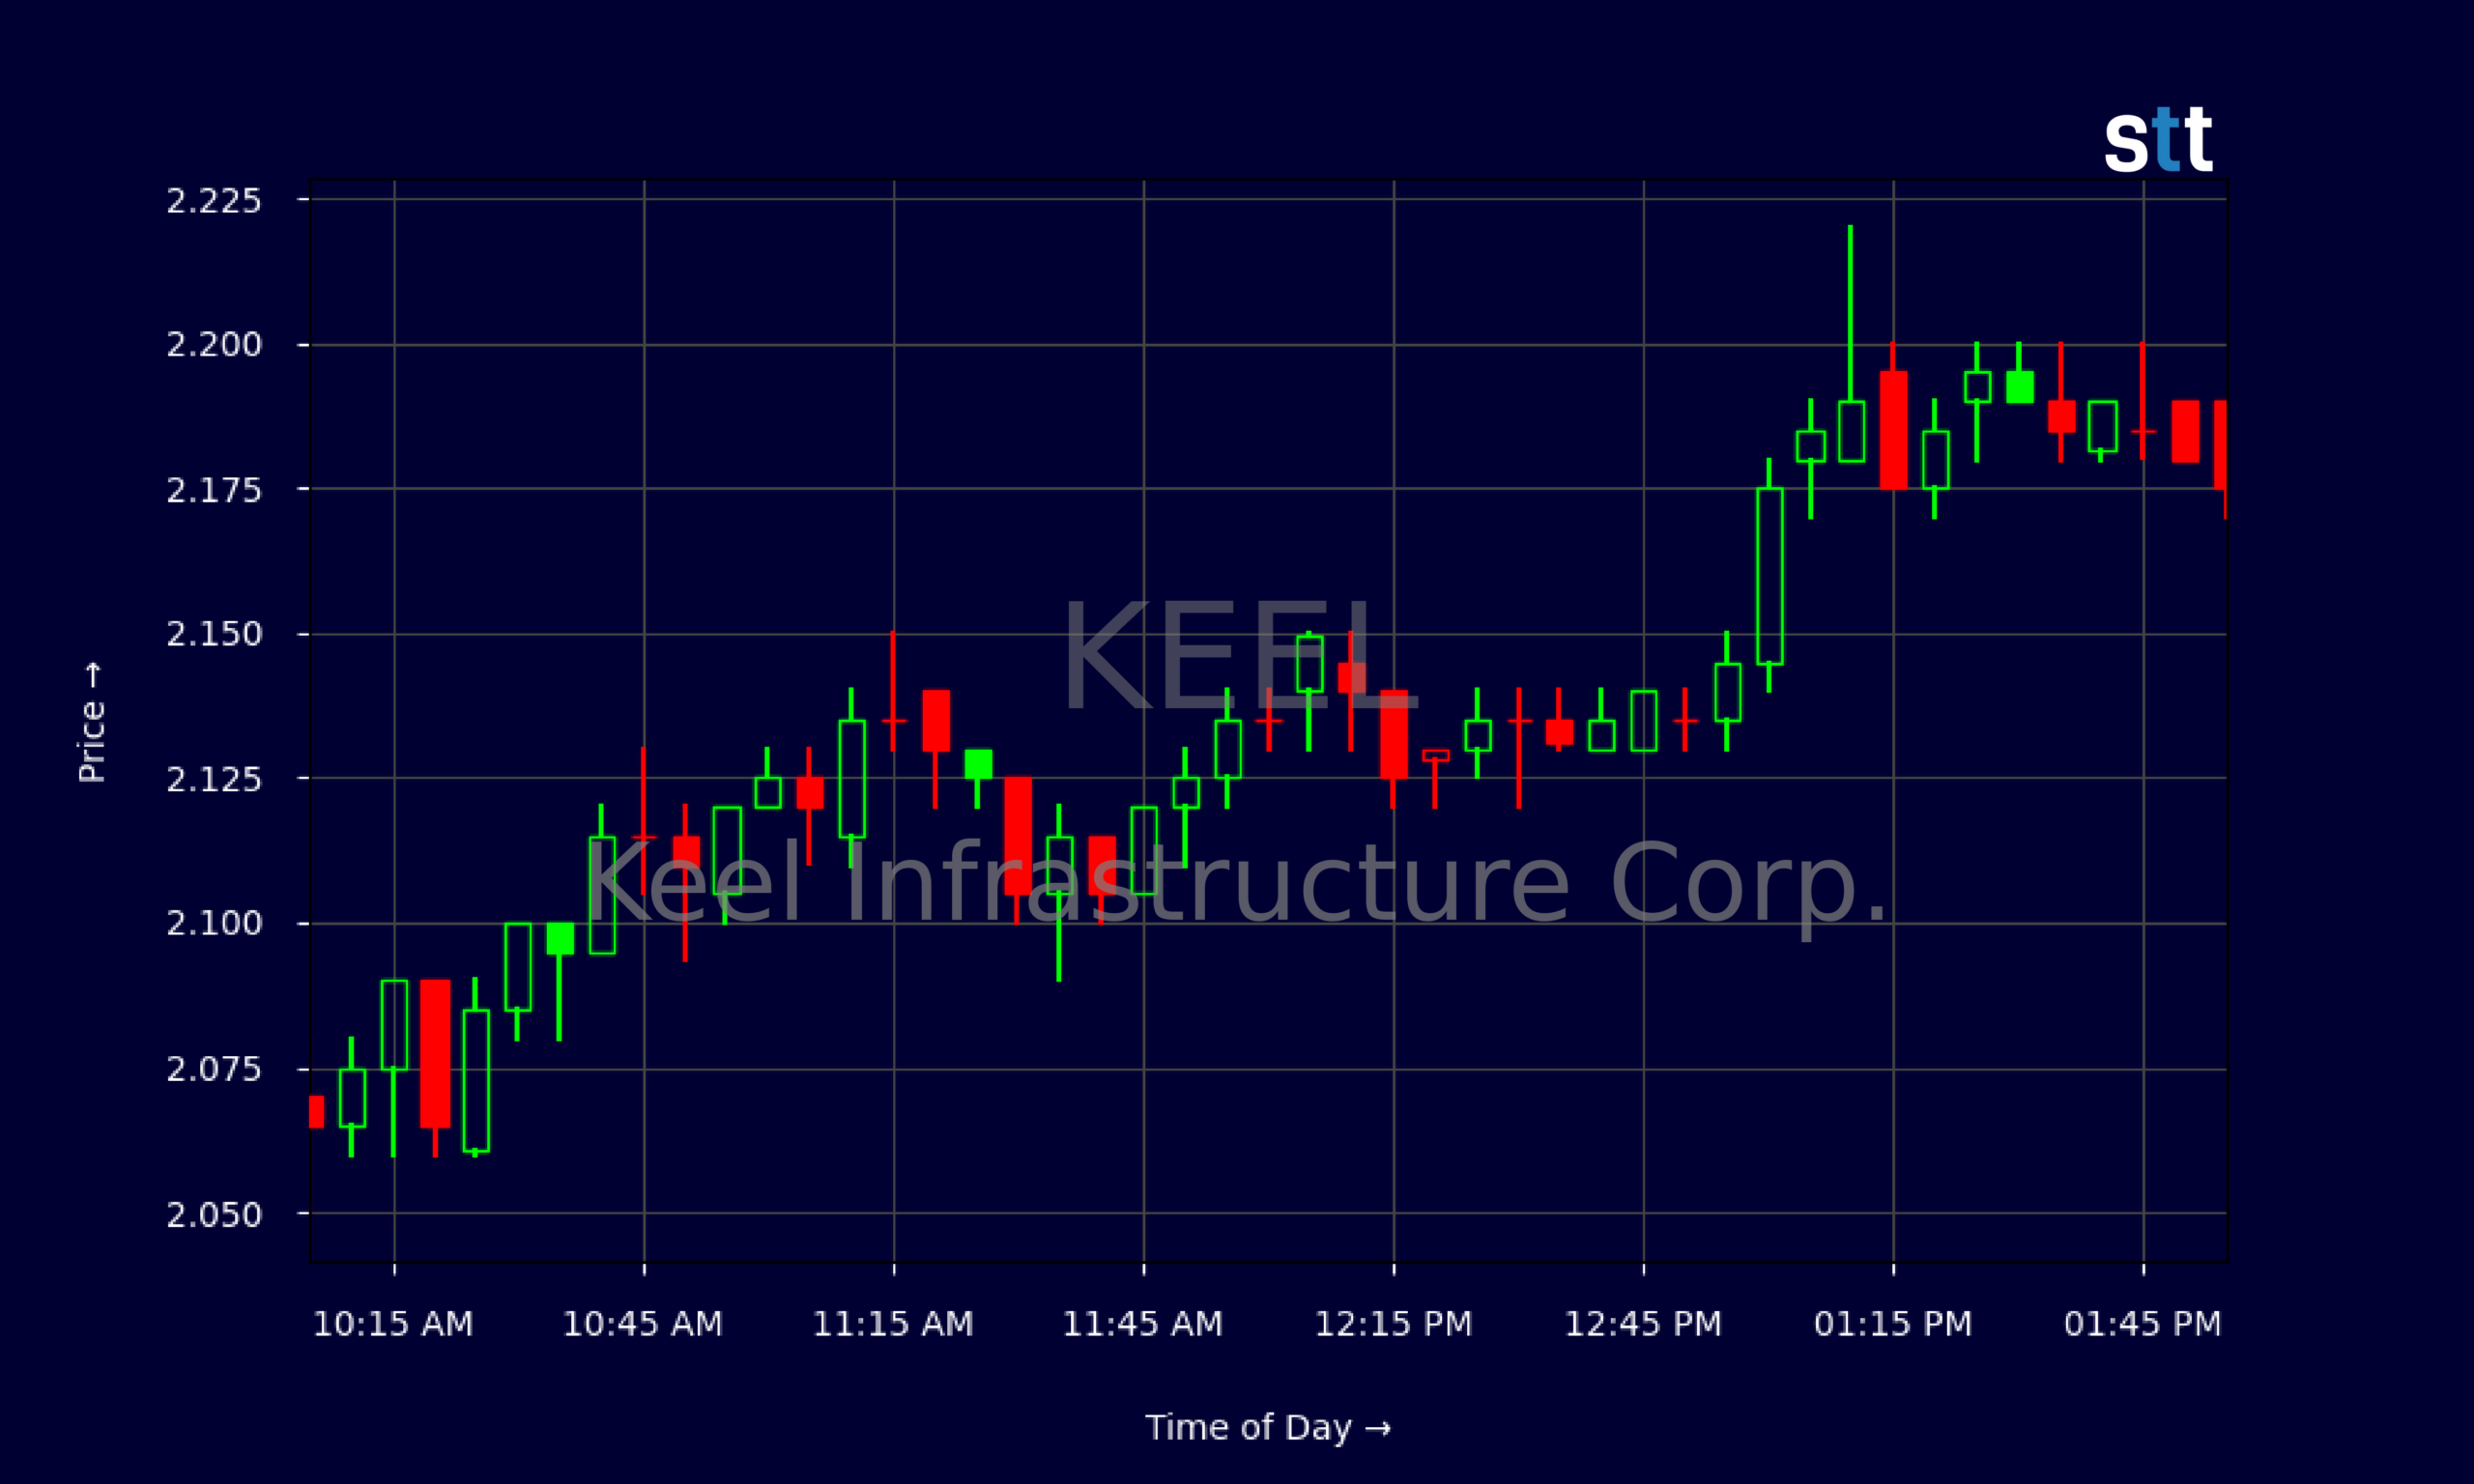
- The intraday KEEL chart shows steady accumulation, with higher lows and tight consolidation between $2.10 and $2.20 for much of the session.
- KEEL is generating about $229.3M in annual revenue but still posts deep losses, with profit margins heavily negative across the board.
- The balance sheet shows strong liquidity, with $715.5M in cash and a very high current ratio, but leverage remains elevated.
- Active traders are watching whether KEEL can build a base above $2.00 and turn heavy cash burn into a credible path toward profitability.
Live Update At 14:02:17 EST: On Tuesday, November 03, 2026 Keel Infrastructure Corp. stock [NASDAQ: KEEL] is trending up by 14.55%! Discover the key drivers behind this movement as well as our expert analysis in the detailed breakdown below.
Quick Financial Overview
KEEL is a classic small-cap infrastructure name with big top-line growth and even bigger red ink. Over the last twelve months, Keel Infrastructure Corp. generated about $229.3M in revenue, with revenue growing at mid-teens rates over three to five years. On paper, that growth looks solid. Under the hood, it’s rough.
Profitability metrics for KEEL are deeply negative. EBIT margin sits around -192%, and net margins are near -191%. That tells traders every dollar of revenue still comes with almost two dollars of losses. Return on equity near -42% and return on assets around -32% confirm that Keel Infrastructure Corp. is not yet using its capital efficiently.
More Breaking News
- EWTX Stock Pops As Cash Surges And Phase 3 Nears
- AEHL Stock Pulls Back As Volatility Grips Low-Float Name
- Duolingo Stock Jumps As Q3 Growth Tops Expectations
- IREN Stock Slumps As Musk’s Neocloud Warning Rattles AI Trade
On the flip side, KEEL’s balance sheet is loaded with liquidity. Keel Infrastructure Corp. holds roughly $715.5M in cash and short-term investments, more than enough to cover its $55.1M in current liabilities. A current ratio over 16 and quick ratio above 13 show short-term safety, while a total-debt-to-equity ratio over 3 signals heavy long-term leverage. For traders, KEEL sits in that tricky middle ground: financially secure near term, but racing the clock to fix its business model.
Why Traders Are Watching KEEL Price Action
The chart is where things get interesting. KEEL spent early 2026 trading above $3.00, topping around $3.23 before sliding into a steady downtrend. By late October, Keel Infrastructure Corp. had fallen into the mid-$2s, then the low $2s. That’s a heavy drawdown, and many momentum traders would have walked away.
But in the last several sessions, KEEL started acting differently. After printing lows around $1.86–$1.90, Keel Infrastructure Corp. bounced and closed at $2.1694 on the most recent day, a clean recovery from the open at $1.93. Day traders watching level 2 would notice how KEEL stair-stepped higher intraday. The 5‑minute chart shows a strong morning push from about $1.98 to above $2.10, followed by a slow grind higher with higher lows all afternoon.
This kind of controlled uptrend, with price pinned between $2.10 and $2.20, often signals accumulation rather than a random bounce. For KEEL, that action comes while the company reports significant operating losses but holds a thick cash cushion and $1.42B in total assets. Keel Infrastructure Corp. is spending heavily, losing about $65.0M in the latest quarter, yet still posts positive EBITDA and large non-cash charges from depreciation and impairment.
For active traders, that combination—broken long-term chart, strong cash, heavy losses, and tightening intraday ranges—sets up potential volatility pockets. If KEEL breaks over recent resistance in the $2.40–$2.50 zone, momentum traders will pay attention. If it fails and cracks back under $2.00, short-biased traders will look for another leg down.
Conclusion
Keel Infrastructure Corp. is not a safe, sleepy dividend play. KEEL is a speculative story built on growing revenue, massive capex, and a long road to profitability. The latest quarter shows $30.4M in operating revenue against $150.4M in total expenses, leaving a brutal operating loss of roughly $118.1M. Cash flow from operations is negative, and free cash flow is around -$95.9M. That’s the definition of a work in progress.
Yet KEEL’s $715.5M cash pile and working capital of roughly $841.3M give Keel Infrastructure Corp. serious runway. The company can afford to keep building, even with long-term debt above $1.02B. For chart-focused traders, that means the fundamental “blow-up” risk is lower in the near term, while price can still move fast on any shift in sentiment around infrastructure, rates, or earnings progress.
Right now, KEEL trades near $2.17 after a big drop from the $3s. The 5‑minute and daily charts both show signs of stabilization, but not a confirmed trend change. This is where disciplined traders earn their keep—by planning, not hoping. As Tim Bohen, lead trainer with StocksToTrade says, “There’s a pattern in everything; you just have to stick around long enough to see it.” As Tim Sykes always says, “Cut losses quickly; small losses are better than big ones.” Anyone trading KEEL should treat it the same way: respect the volatility, stick to a clear plan, and let the chart—not emotions—do the talking.
This is stock news, not investment advice. StocksToTrade News delivers real-time stock market updates tailored to highlight the key catalysts driving short-term price movements. Our coverage is designed for active traders and investors who thrive in fast-moving markets, with a focus on volatile sectors like penny stocks, AI stocks, Robinhood stocks and other momentum plays. From earnings reports and FDA approvals to mergers, new contracts, and unusual trading volume, we break down the events that can spark significant price action.
Looking to level up your trading game? Explore StocksToTrade, the ultimate platform for traders. With powerful tools designed for swing and day trading, integrated news scanning, and even social media monitoring, StocksToTrade keeps you one step ahead.
Check out our quick startup guide for new traders!
- How to Read Stock Charts: A Guide for Beginners
- Trading Plan: 6 Steps to Create One
- How To Create a Stock Watchlist
Ready to build your watchlists? Check out these curated lists:
Once your watchlist is set, take the next step and trade with confidence using StocksToTrade’s robust platform. Don’t miss out — grab your 14-day trial for just $7 and experience the edge you need to thrive in today’s fast-paced markets.