

J-Star Holding Co. Ltd. stocks have been trading down by -21.93 percent amid heightened concern from the most negative headline.
Market Insights For Active Traders
- Weekly chart shows J-Star Holding Co. Ltd. exploding from sub-$1 to above $1.70 before pulling back, signaling an early-stage momentum phase.
- Intraday 5-minute action swinging between $1.44 and $2.34 highlights heavy volatility and active short-term trading.
- Revenue near $10M with a price-to-sales around 3.2 frames YMAT as a small-cap growth-style name.
- Balance sheet leverage and negative equity increase risk, but also set up a classic high-reward speculative profile.
- Traders are focusing on whether recent gains hold above prior breakout levels near $1.30–$1.50.
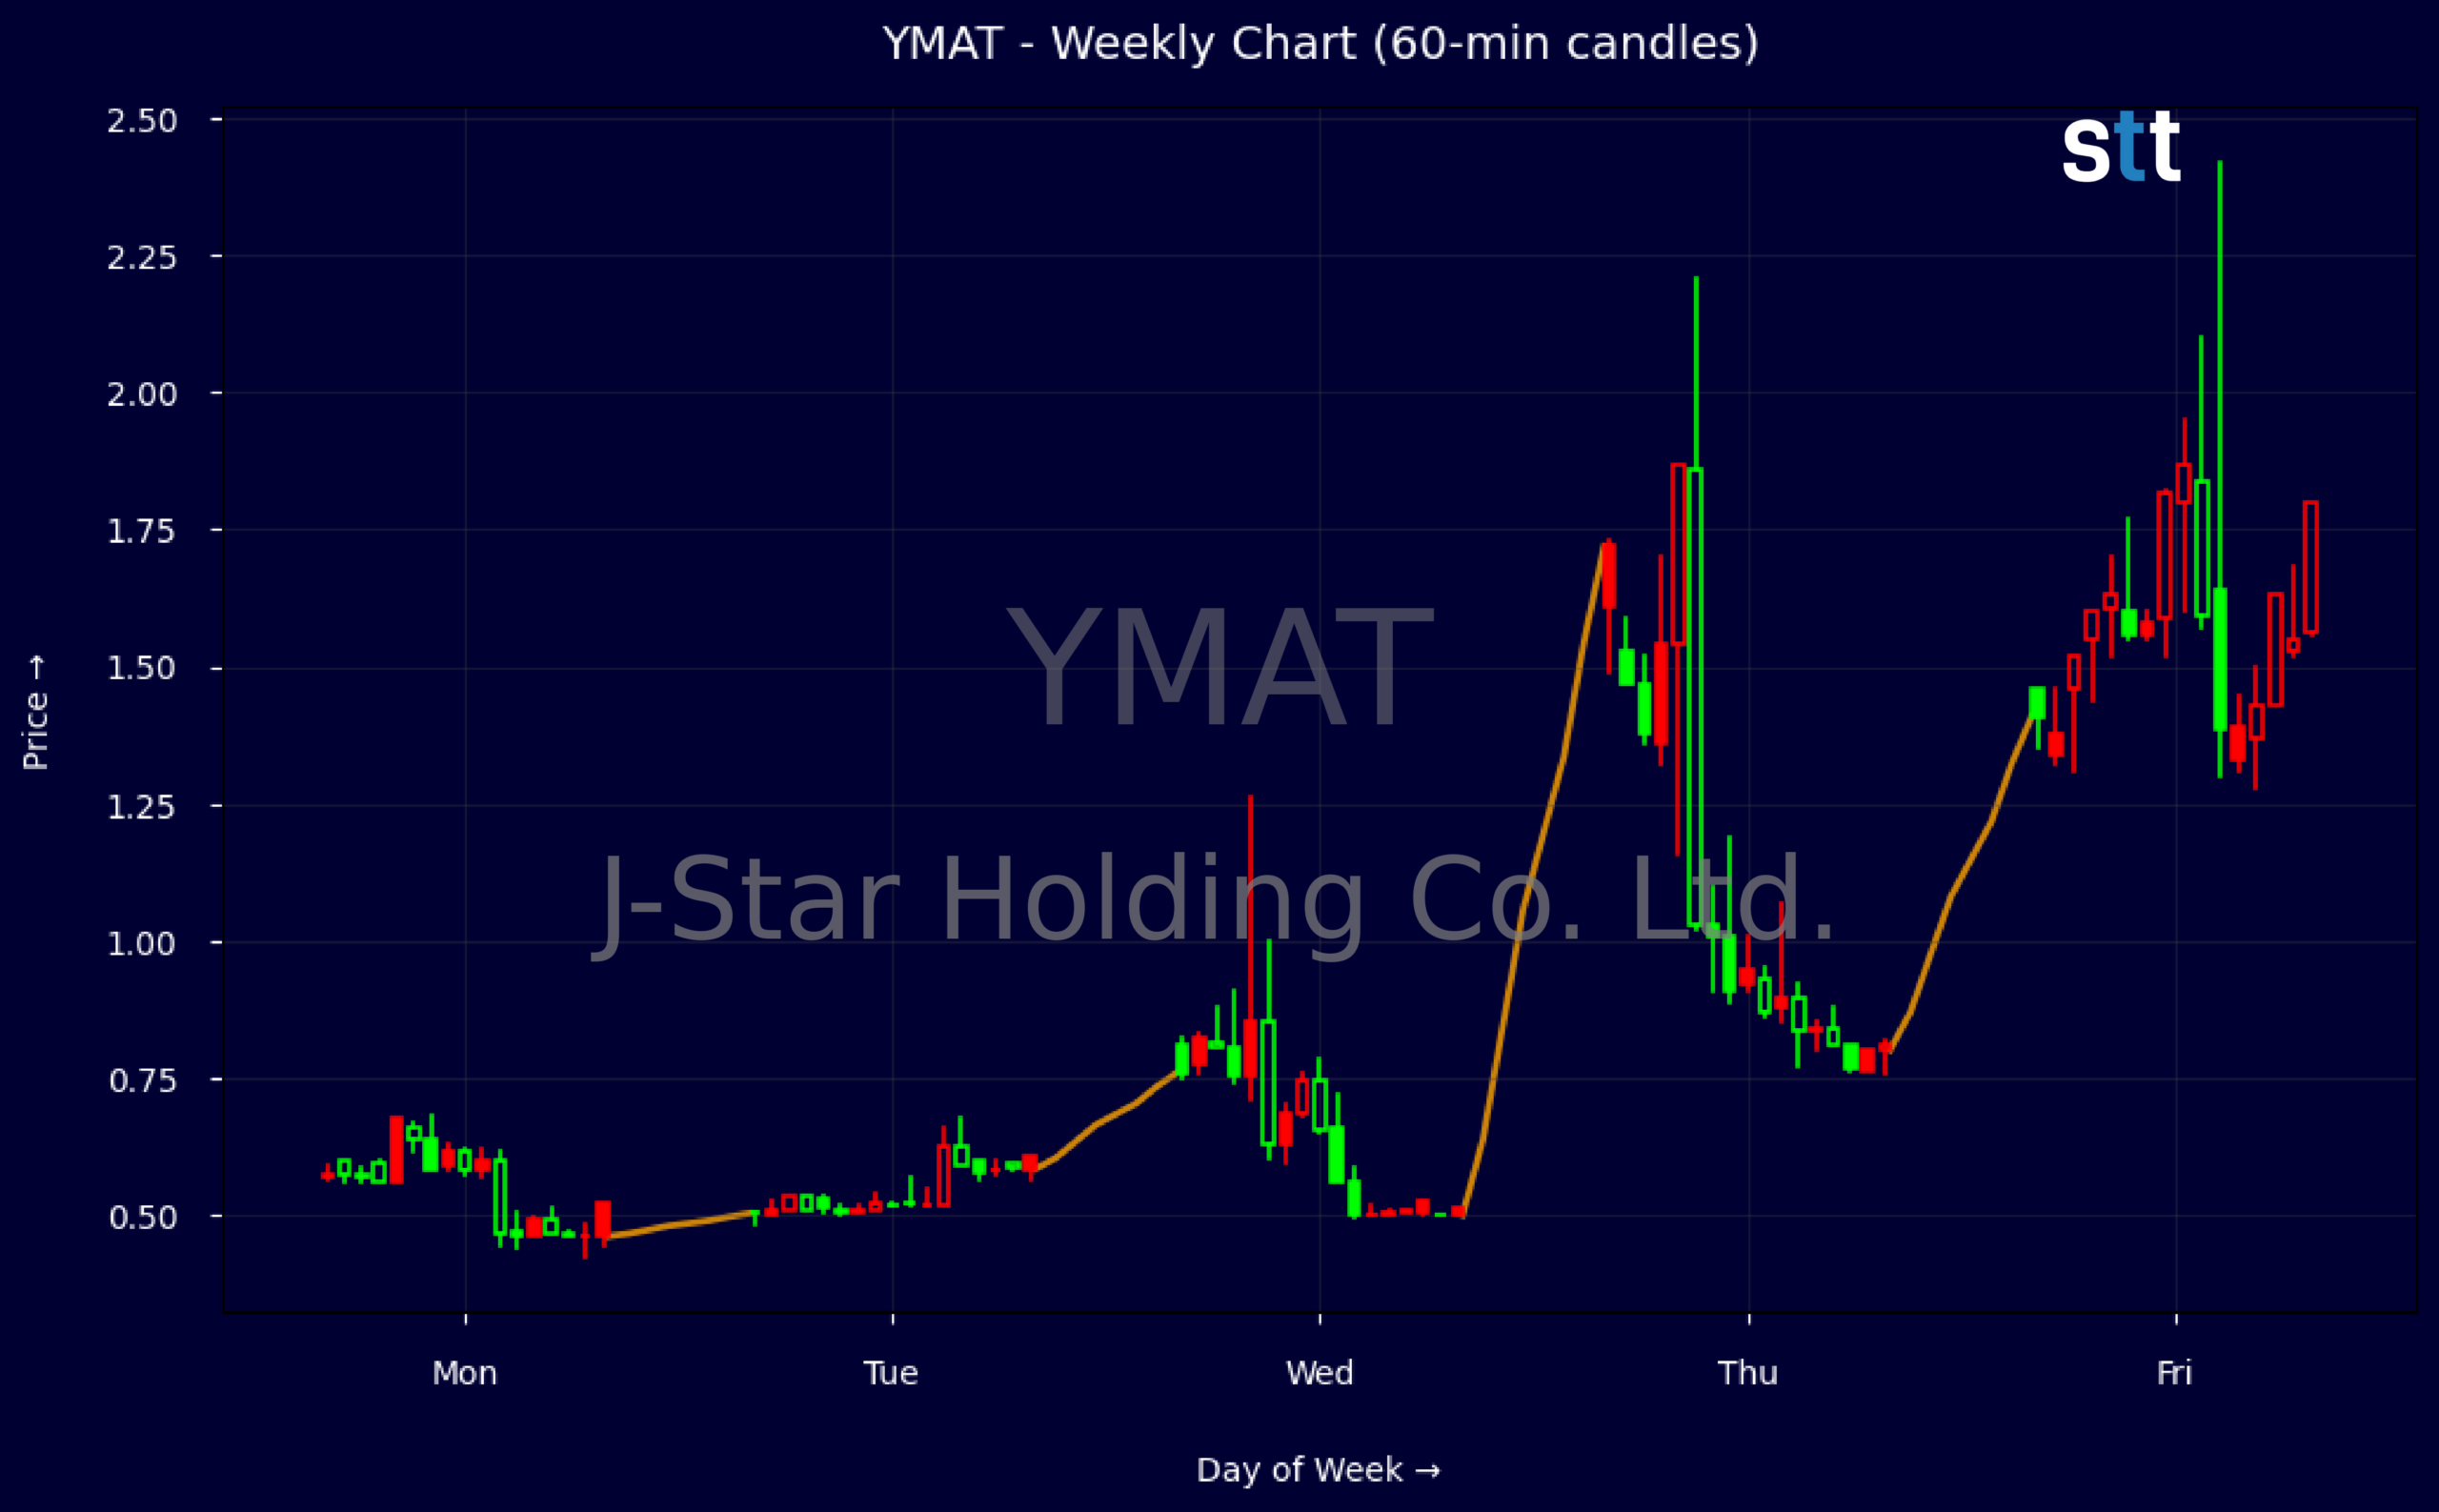
Weekly Update May 11 – May 15, 2026: On Sunday, May 17, 2026 J-Star Holding Co. Ltd. stock [NASDAQ: YMAT] is trending down by -21.93%! Discover the key drivers behind this movement as well as our expert analysis in the detailed breakdown below.
Consumer Discretionary industry expert:
Analyst sentiment – negative
YMAT operates from a weak fundamental base despite modest scale, with revenue of roughly $9.9 million and a price-to-sales multiple of 3.23 implying the market is already pricing in meaningful growth. The balance sheet is strained: negative equity of about $6.8 million, working capital deeply negative, and leverage ratio near 1.9 with current debt exceeding $11.6 million. Returns on assets and equity are effectively zero, indicating no demonstrable value creation to date, and cash reserves are minimal.
Technically, YMAT has shifted from sub-$0.60 trading into a high-volatility breakout, spiking to $1.72 before closing the latest week at $1.4599. The dominant trend on the weekly tape is short-term bullish but vulnerable, with a wide range and likely heavy speculative volume concentrated above $1.30. A clear actionable level is $1.30: above it, momentum buyers remain in control; a decisive close below suggests failed breakout and favors a tactical short back toward the $0.80–$0.90 congestion zone.
More Breaking News
- WKHS Stock Draws Traders As EV Orders Grow And AI Pivot Emerges
- GPN Rises As Global Payments Scores Wave Of Upgrades
- MPT Stock Slides As Traders Focus On Debt And Cash Flow
- REGN Stock Jumps As Bullish Data And Targets Pile Up
With no material news flow, the move appears technically driven rather than fundamentally anchored, leaving YMAT at a disadvantage versus Consumer Discretionary and Hotels, Lodging & Leisure peers that generally exhibit positive equity and sustainable margins. Into the next quarter, I view $1.80–$2.00 as strong resistance and $1.00 as first meaningful support. My base-case 3–6 month fair-value range is $0.80–$1.00, implying a negative risk-reward skew from current levels despite recent momentum.
Quick Financial Overview
J-Star Holding Co. Ltd., trading under ticker YMAT, is a small-cap name with about $9.9M in revenue and a price-to-sales ratio near 3.2. That valuation is not extreme for a speculative growth play, but it does not leave much margin for error if revenue stalls. Book value per share runs around $0.62, while the stock has recently traded several times above that, showing traders are pricing in future potential rather than current balance sheet strength.
The latest balance sheet shows total assets of about $7.2M against total liabilities of roughly $13.9M, leaving common equity deeply negative around -$6.8M. Current debt of about $11.6M far exceeds cash of under $0.1M, which means liquidity is tight and funding risk is real. A leverage ratio near 1.9 and long-term debt a little over $1.0M add to that risk profile, even though long-term debt relative to capital is modest.
On the chart, weekly data shows YMAT moving from roughly $0.50–$0.60 into a spike above $1.70 before closing the latest week near $1.46. That is still a strong move off the lows but well off the recent high, a classic sign of profit taking after an early breakout wave. Intraday, a wide $1.44–$2.34 range with a $1.60 close confirms aggressive two-sided trading and fading momentum off the intraday peak.
Conclusion
The Story Behind The Move And What Comes Next
For traders, YMAT is a textbook high-volatility small-cap: strong short-term price action layered on top of a fragile balance sheet. J-Star Holding Co. Ltd. has shown it can attract speculative flows, with a move from under $1 into the mid-$1s and briefly higher, but the financials remind you this is not a low-risk compounder. Negative equity, limited cash, and meaningful current debt mean sentiment and liquidity can shift the tape quickly.
From a trading lens, the key question is whether YMAT can build a base above prior resistance in the $1.30–$1.50 zone. Holding that range would signal that early buyers are defending their positions and might pave the way for another push toward recent highs if volume returns. Losing that band on heavy volume would suggest the breakout has failed, opening room for a deeper pullback toward the prior sub-$1 area.
For now, J-Star Holding Co. Ltd. sits in a classic “prove it” zone where both risk and reward are elevated. Traders should size carefully, respect the wide intraday swings, and avoid overstaying if momentum fades. As I tell my students, “In thin, leveraged names like YMAT, your edge is not predicting the story, it’s reacting faster than the crowd when the key price levels break.” As Tim Bohen, lead trainer with StocksToTrade says, “I focus on what a stock is doing, not what I want it to do. Let the stock prove itself before you make a move.”
This is stock news, not investment advice. StocksToTrade News delivers real-time stock market updates tailored to highlight the key catalysts driving short-term price movements. Our coverage is designed for active traders and investors who thrive in fast-moving markets, with a focus on volatile sectors like penny stocks, AI stocks, Robinhood stocks and other momentum plays. From earnings reports and FDA approvals to mergers, new contracts, and unusual trading volume, we break down the events that can spark significant price action.
Looking to level up your trading game? Explore StocksToTrade, the ultimate platform for traders. With powerful tools designed for swing and day trading, integrated news scanning, and even social media monitoring, StocksToTrade keeps you one step ahead.
Check out our quick startup guide for new traders!
- How to Read Stock Charts: A Guide for Beginners
- Trading Plan: 6 Steps to Create One
- How To Create a Stock Watchlist
Ready to build your watchlists? Check out these curated lists:
Once your watchlist is set, take the next step and trade with confidence using StocksToTrade’s robust platform. Don’t miss out — grab your 14-day trial for just $7 and experience the edge you need to thrive in today’s fast-paced markets.