
JBDI Holdings Limited faces intensified selling pressure as regulatory probes overshadow outlook, with stocks have been trading down by -27.99 percent.
Click Here for a Millionaire's POV on Trading JBDI
SUBSCRIBE FOR ALERTSJOIN 50,000+ ACTIVE TRADERS
Key Takeaways
- Price action in JBDI shows a violent breakout from the $1 area to above $3, signaling intense momentum trading.
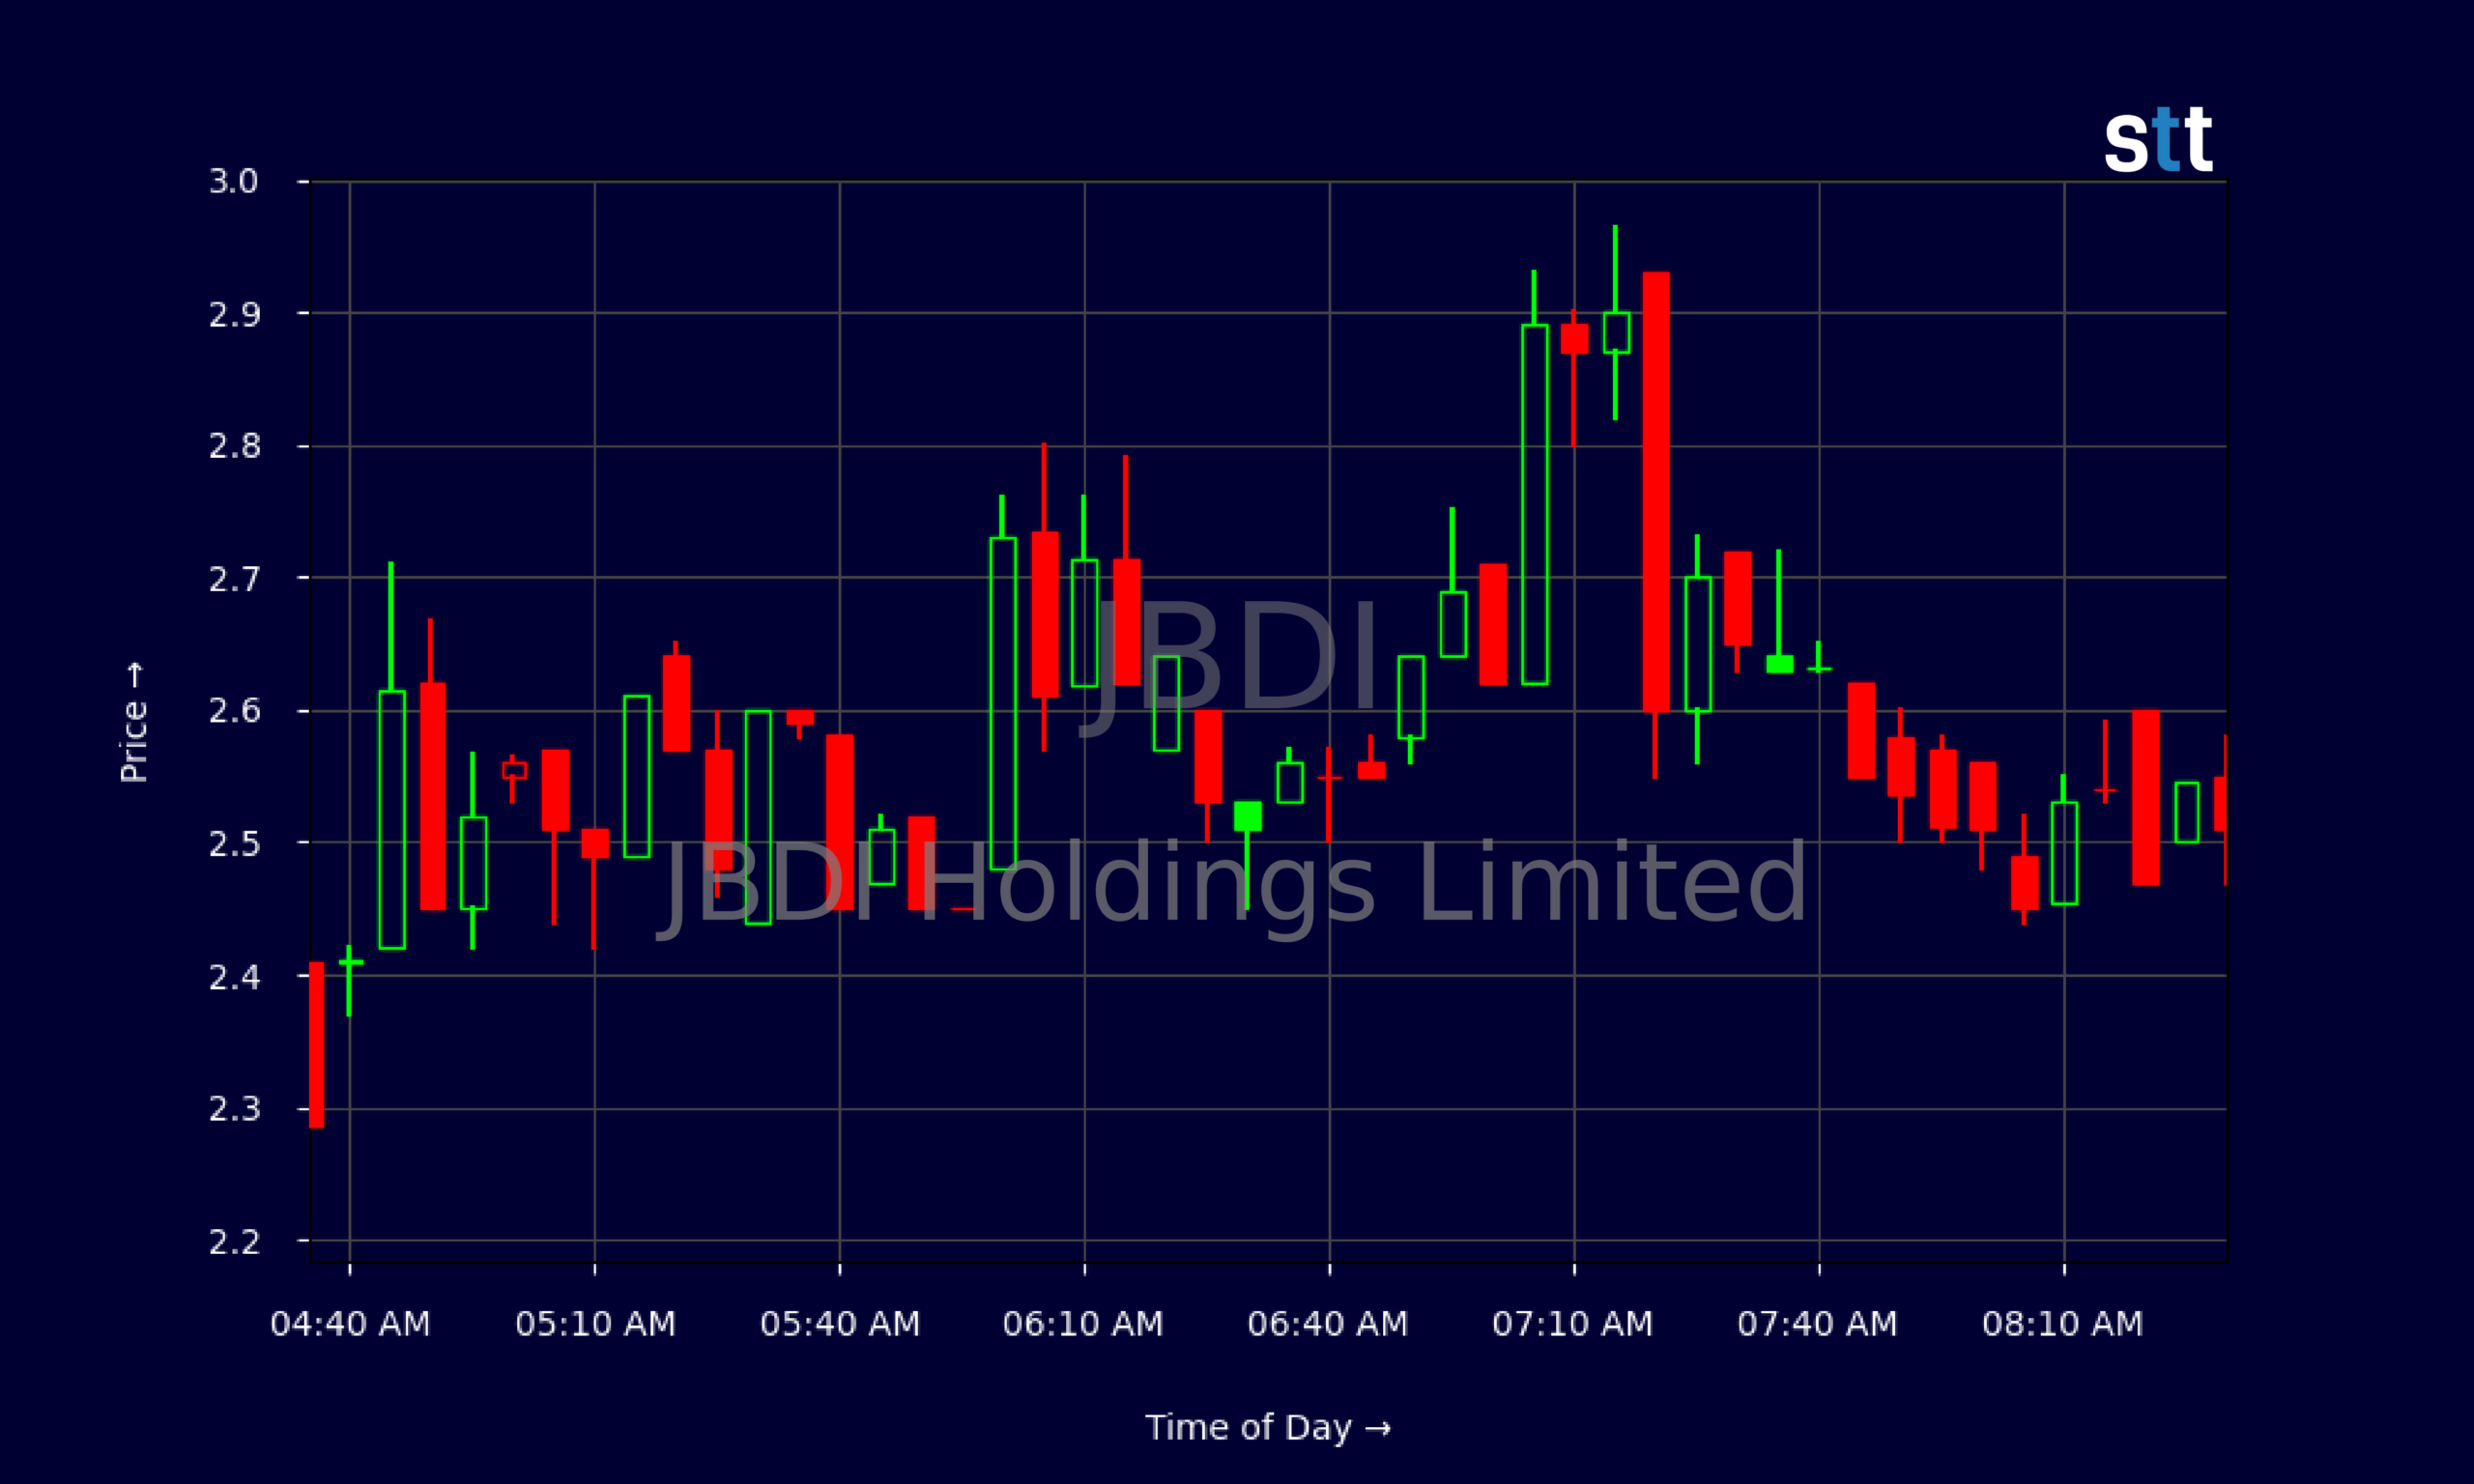
- Intraday JBDI action features wide 5‑minute ranges, highlighting elevated risk and opportunity for active traders.
- JBDI Holdings Limited runs with modest leverage and meaningful cash, giving the company some financial flexibility.
- Revenue of about $8.5M against a compact asset base suggests JBDI is a small but active operator.
- Traders are tracking whether JBDI can hold above former resistance near $1 as a new support zone.
Live Update At 08:33:22 EDT: On Wednesday, October 14, 2026 JBDI Holdings Limited stock [NASDAQ: JBDI] is trending down by -27.99%! Discover the key drivers behind this movement as well as our expert analysis in the detailed breakdown below.
Quick Financial Overview
JBDI Holdings Limited is trading like a classic low‑priced momentum name, but its financials give useful context for that chart. JBDI generated about $8.52M in revenue over the latest period, with revenue per share under $1, which fits the profile of a small, thinly capitalized operator rather than a large, stable business. Enterprise value sits around $31.76M, so traders are paying roughly 1.1 times sales and about 2.5 times book value for JBDI at recent prices.
On the balance‑sheet side, JBDI shows total assets of roughly $6.29M, with cash around $1.96M and receivables near $1.98M. That means a big chunk of JBDI’s asset base is liquid or near‑liquid, which matters if the company hits a rough patch. Total liabilities are about $2.45M, versus equity of $3.84M, giving JBDI a leverage ratio of 1.6 and long‑term debt that is manageable against equity.
More Breaking News
- JBDI Stock Rockets On Volatile Low-Float Breakout
- BAC Stock Drops As $1.2B Treasury Fine Hits Compliance Credibility
- JBLU Stock Slides As Wall Street Slashes Price Targets
- SDEV Stock Whipsaws As Momentum Traders Pile In
Return on capital near 2.9% is modest, but JBDI is not drowning in debt or locked into heavy fixed obligations. For traders, that translates into a stock where the story is more about sentiment and price action than immediate financial distress.
Why Traders Are Watching JBDI’s Price Action
JBDI has turned into a textbook case of how quickly a low‑priced stock can shift character. On the daily chart, JBDI spent late September and early October chopping around the $1 zone, with closes mostly between $0.95 and $1.19. That phase looked like quiet base‑building. Then came the recent session where JBDI opened near $2 and ripped to a high of $9.50 before settling at $3.43. That’s a monster intraday range and a sharp close well above the prior base.
For momentum traders, JBDI now checks several boxes: big percentage move, expanding range, and a clear prior consolidation zone around $1 that can be used as a reference level. The 5‑minute chart backs this up. JBDI’s intraday tape shows repeated swings of $0.20–$0.40 within minutes, with pushes from the low $2s into the $2.90–$3 zone and back. That kind of volatility is what short‑term traders thrive on, but it also punishes anyone who overstays or sizes too big.
The key now is whether JBDI Holdings Limited can stabilize above key intraday support levels. Pre‑spike resistance near $1.10–$1.20 on the daily has been blown out. On the intraday chart, JBDI has been testing the mid‑$2s repeatedly, with quick bounces, suggesting an emerging battle line between aggressive dip buyers and profit‑takers. If JBDI holds this band and coils, traders will watch for another breakout attempt toward the prior spike zone. If it fails, a fast unwind back toward the $1 base is on the table.
Conclusion
JBDI is showing the exact type of high‑velocity move that attracts active traders hunting for opportunity. The fundamentals of JBDI Holdings Limited are small‑scale but not broken: meaningful cash, moderate liabilities, and revenue that supports an ongoing business. That backdrop reduces the immediate fear of a blow‑up, but it does not justify chasing blindly. The real driver here is psychology and liquidity, not slow‑and‑steady cash flow growth.
On the chart, JBDI has transformed from a sleepy $1 name into a fast‑moving trader’s stock. The massive spike from the $1 area toward $9.50, followed by a close in the $3s, tells traders that JBDI is now on watchlists across the momentum community. The intraday 5‑minute swings show both opportunity and danger; tight risk management is not optional here.
For traders studying JBDI, the game plan centers on key levels and strict discipline. Prior resistance near $1 now acts as a line in the sand on the downside, while the mid‑$2s and low‑$3s are the current battlefield. In Tim Sykes’ words, “The hottest stocks can crash the fastest, so I focus less on the story and more on the chart and my risk.” As Tim Bohen, lead trainer with StocksToTrade says, “The best way to learn is by tracking trades, wins, losses, and lessons learned. Every trade has something to teach.” JBDI fits that mindset perfectly right now: a dynamic chart, clear levels, and a setup that rewards preparation over prediction.
This is stock news, not investment advice. StocksToTrade News delivers real-time stock market updates tailored to highlight the key catalysts driving short-term price movements. Our coverage is designed for active traders and investors who thrive in fast-moving markets, with a focus on volatile sectors like penny stocks, AI stocks, Robinhood stocks and other momentum plays. From earnings reports and FDA approvals to mergers, new contracts, and unusual trading volume, we break down the events that can spark significant price action.
Looking to level up your trading game? Explore StocksToTrade, the ultimate platform for traders. With powerful tools designed for swing and day trading, integrated news scanning, and even social media monitoring, StocksToTrade keeps you one step ahead.
Check out our quick startup guide for new traders!
- How to Read Stock Charts: A Guide for Beginners
- Trading Plan: 6 Steps to Create One
- How To Create a Stock Watchlist
Ready to build your watchlists? Check out these curated lists:
Once your watchlist is set, take the next step and trade with confidence using StocksToTrade’s robust platform. Don’t miss out — grab your 14-day trial for just $7 and experience the edge you need to thrive in today’s fast-paced markets.