
JBDI Holdings Limited faces mounting selling pressure as regulatory probe headlines intensify, with stocks have been trading down by -27.11 percent.
Click Here for a Millionaire's POV on Trading JBDI
SUBSCRIBE FOR ALERTSJOIN 50,000+ ACTIVE TRADERS
Key Takeaways
- Shares of JBDI ripped from near $1 to above $3, flashing classic low-float breakout action on the daily chart.
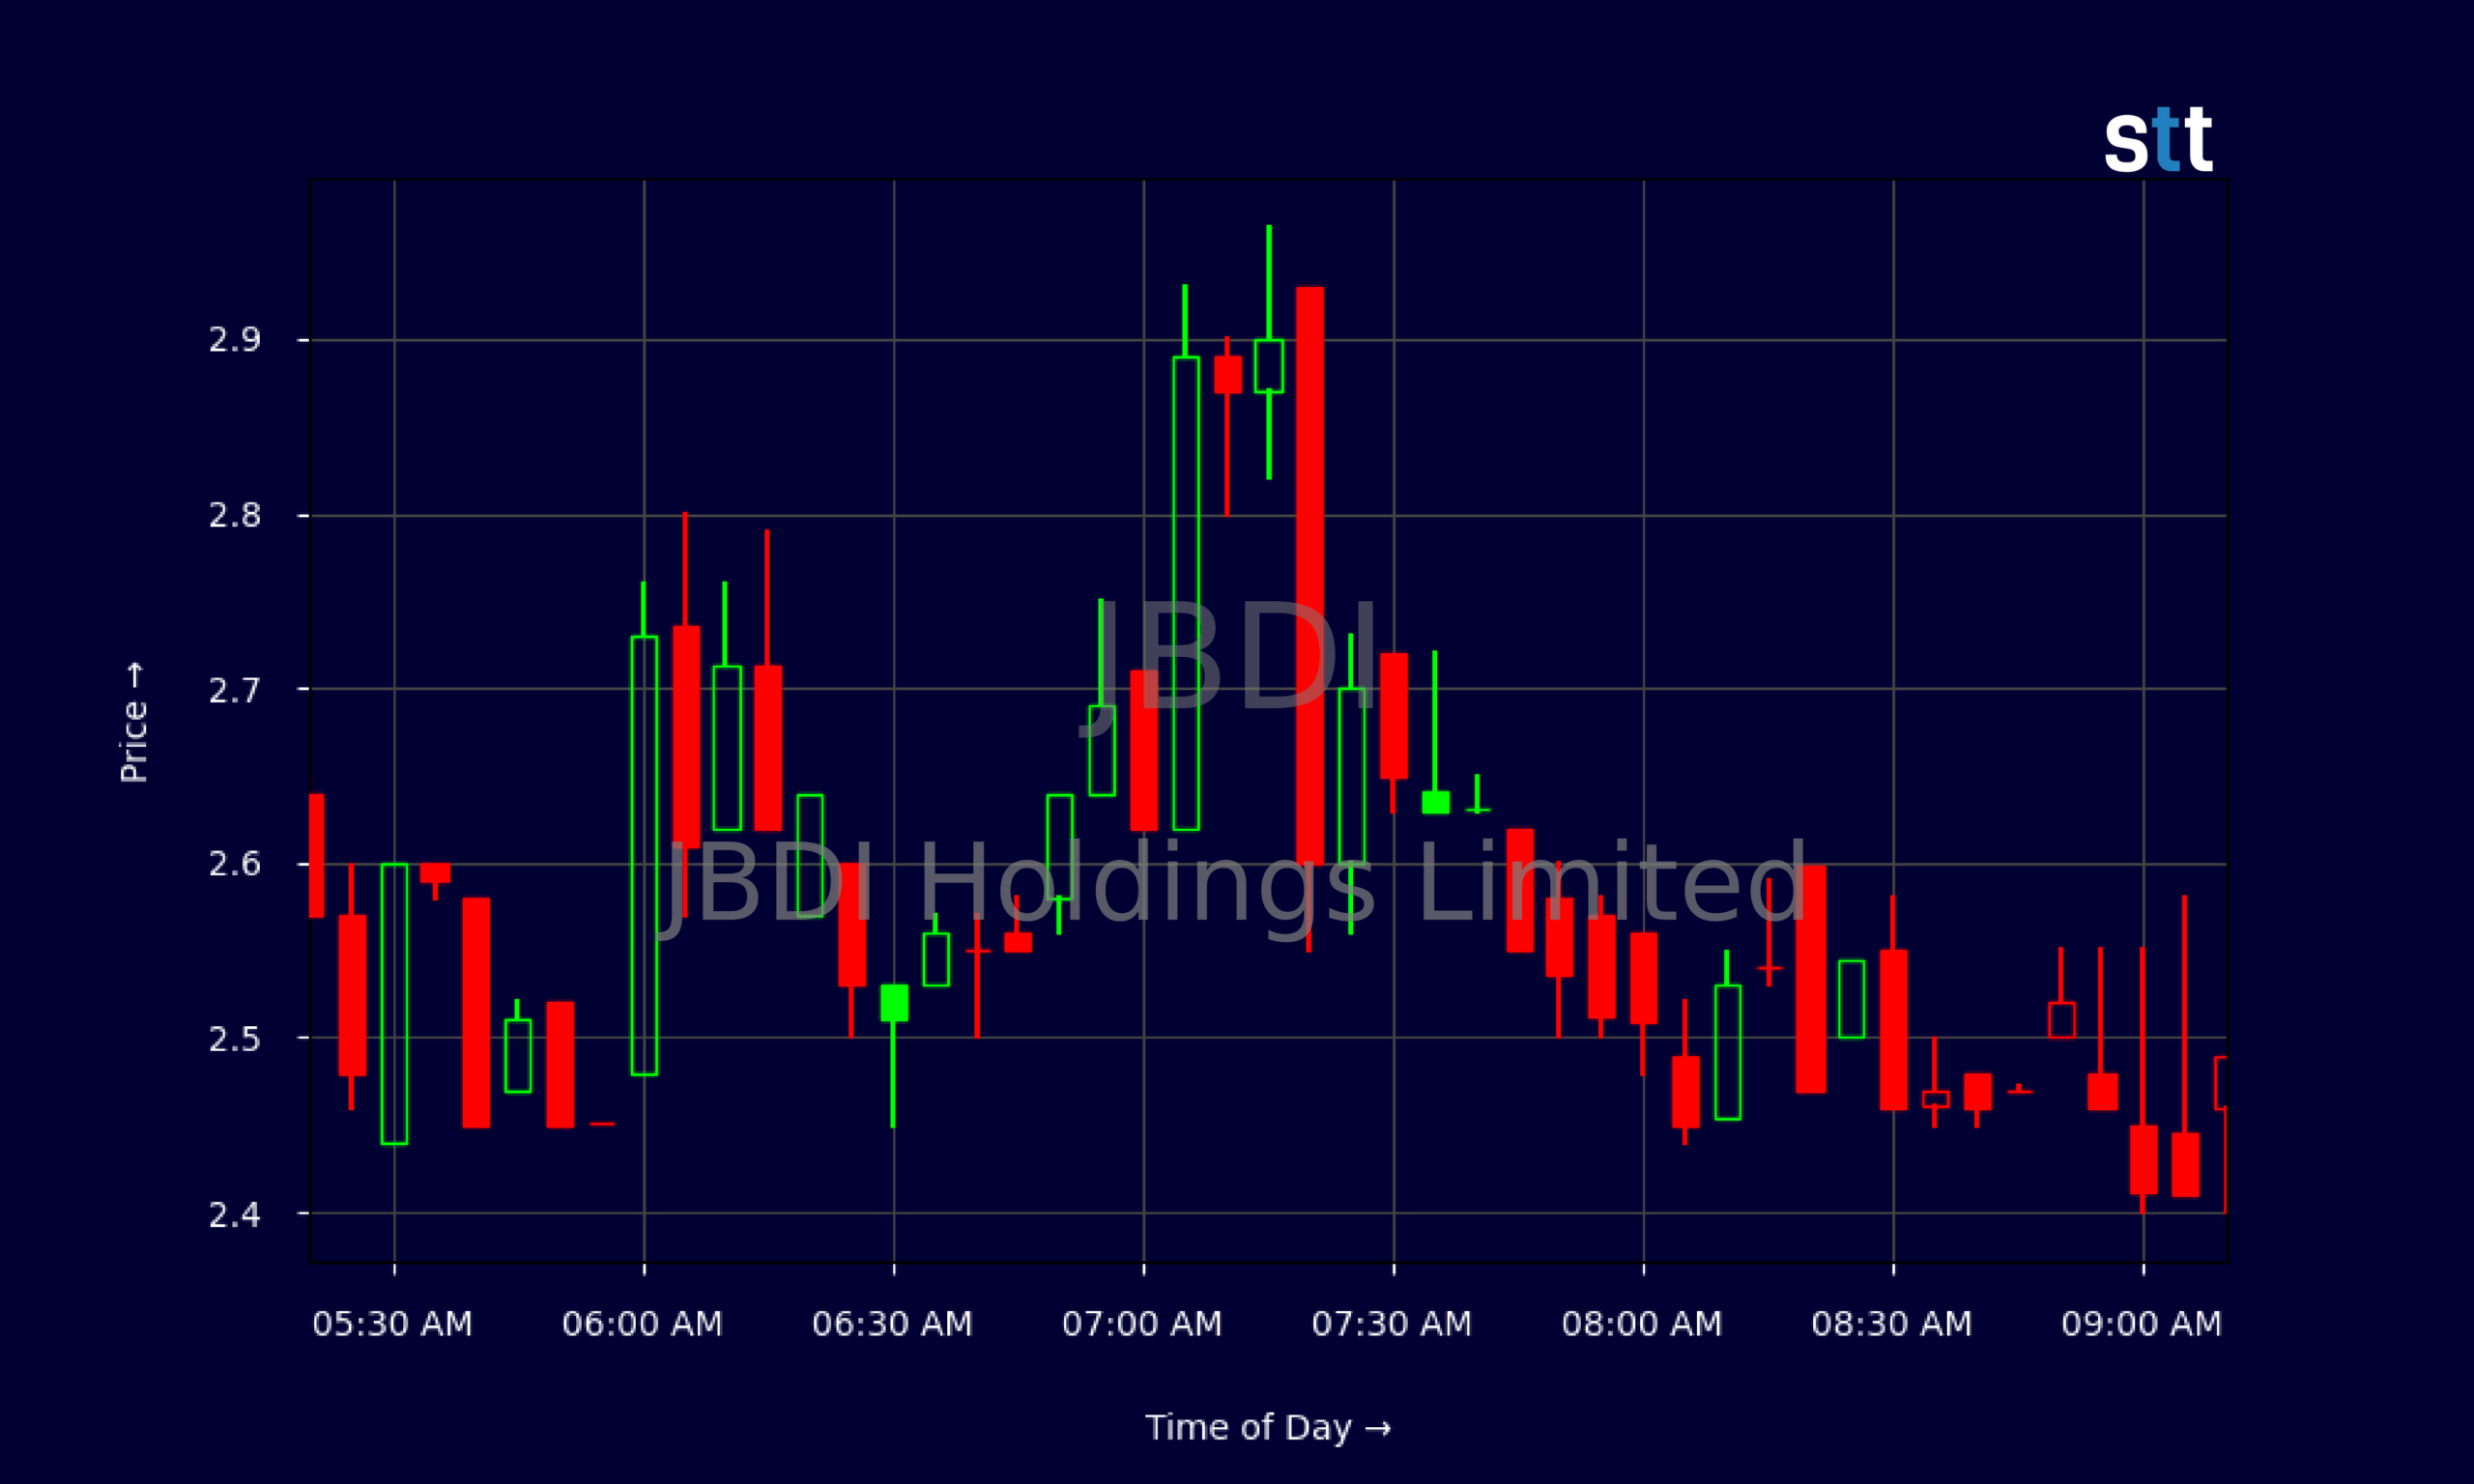
- Intraday JBDI trading shows wide 5‑minute candles, with $2.40–$2.70 acting as a key battle zone for momentum.
- JBDI Holdings Limited posts roughly $8.52M in revenue with solid cash and working capital backing the recent price spike.
- Valuation on JBDI now sits at about 2.5x book and 1.1x sales, levels where momentum traders often pile in but also bail fast.
- Active traders are watching whether JBDI can hold above prior $1 consolidation and build a new trading range.
Live Update At 09:17:33 EDT: On Wednesday, October 14, 2026 JBDI Holdings Limited stock [NASDAQ: JBDI] is trending down by -27.11%! Discover the key drivers behind this movement as well as our expert analysis in the detailed breakdown below.
Quick Financial Overview
JBDI Holdings Limited is behaving like a classic small-cap momentum play backed by a surprisingly sturdy balance sheet. Revenue stands around $8.52M, with JBDI generating about $0.90 in sales per share. That is not huge, but for a thinly traded name like JBDI, it gives traders a real business to anchor the chart.
On the balance sheet, JBDI carries roughly $6.29M in total assets and $3.84M in equity. Cash is about $1.96M, and working capital sits near $3.40M, which signals that JBDI can cover near-term bills without scrambling for funding. Long-term leases and debt are modest relative to equity, and the leverage ratio around 1.6 is manageable for a small operator.
More Breaking News
- Scinai Immunotherapeutics Regains Nasdaq Compliance, Draws Trader Focus
- SDEV Stock Whipsaws As Volatility Dominates Trading
- JOBY Stock Slides As Barclays Downgrade Rattles eVTOL Hopes
- Micron Stock Slides As ITC Patent Fight Rattles AI Memory Trade
Valuation-wise, JBDI trades at about 1.12x sales and roughly 2.48x book value. For momentum traders, that combination often means there is room for narrative and volatility. Return on capital around 2.9% is not explosive, but it shows JBDI is at least putting money to work. Put together, the financials say JBDI is speculative, but not empty — a key distinction when you’re day trading wild charts.
Why Traders Are Watching JBDI’s Wild Price Swings
The chart is where JBDI really gets loud. For weeks, JBDI drifted around the $1 zone, printing closes between $0.95 and $1.19. That tight band built a base. Then JBDI suddenly exploded, with the latest daily candle showing a move from a $2 open to a $9.50 high before fading to a $3.43 close. That’s the type of range that grabs chat rooms and scanners fast.
Zooming into the 5‑minute chart, JBDI shows aggressive spikes and deep dips from the open. Early in the session, JBDI pushed into the $2.70–$3.00 zone, then chopped lower into the mid‑$2s. You can see repeated tests around $2.40–$2.60, suggesting short-term traders are battling over control. When JBDI squeezes above $2.70, candles stretch quickly; when it loses $2.40, bids disappear just as fast.
This is textbook low-float behavior, even though we don’t have the float data here. The structure alone shows JBDI attracting short sellers chasing the fade and momentum traders surfing the spikes. JBDI Holdings Limited has now clearly broken out above its prior $1 range, so that area becomes a longer-term line in the sand. As long as JBDI stays well above that zone, breakout traders will keep it on watch for secondary runs, morning gap plays, and late-day squeezes. The story is less about fundamentals and more about whether JBDI can remain the “hot stock of the day” on scanners.
Conclusion
JBDI Holdings Limited now sits in that dangerous sweet spot for active traders — big recent move, real but modest fundamentals, and plenty of room for emotion to drive price. The balance sheet shows JBDI with solid cash, positive equity, and manageable liabilities, so the stock is not just a shell. At the same time, JBDI’s valuations around 2.5x book and 1.1x sales are not extreme for a small, speculative name, which leaves room for both upside blowouts and sharp pullbacks.
For day traders, the main focus is the chart. JBDI has shifted from a quiet $1 stock to a volatile $2–$3+ runner with intraday swings of $0.50 or more. That offers opportunity, but it also punishes anyone who hesitates. The key levels are the new breakout zone above $2, the intraday pivot band around $2.40–$2.70, and the psychological $3 level. As Tim Bohen, lead trainer with StocksToTrade says, “The best trades are the ones you can make without emotion. Plan it, then execute it as if it’s routine.” That mindset is especially relevant when a stock like JBDI starts attracting more volume and hype, because following a pre-planned trading process can help keep you from chasing or panic-selling in these fast swings.
As Tim Sykes likes to remind traders, “The market doesn’t owe you anything — protect yourself first, profits second.” JBDI is a live example. Respect the volatility, size down, and stick to your trading plan. This analysis is for educational and research purposes only, but if you study JBDI’s price action, you’ll see many of the same patterns that show up again and again in low-priced momentum names.
This is stock news, not investment advice. StocksToTrade News delivers real-time stock market updates tailored to highlight the key catalysts driving short-term price movements. Our coverage is designed for active traders and investors who thrive in fast-moving markets, with a focus on volatile sectors like penny stocks, AI stocks, Robinhood stocks and other momentum plays. From earnings reports and FDA approvals to mergers, new contracts, and unusual trading volume, we break down the events that can spark significant price action.
Looking to level up your trading game? Explore StocksToTrade, the ultimate platform for traders. With powerful tools designed for swing and day trading, integrated news scanning, and even social media monitoring, StocksToTrade keeps you one step ahead.
Check out our quick startup guide for new traders!
- How to Read Stock Charts: A Guide for Beginners
- Trading Plan: 6 Steps to Create One
- How To Create a Stock Watchlist
Ready to build your watchlists? Check out these curated lists:
Once your watchlist is set, take the next step and trade with confidence using StocksToTrade’s robust platform. Don’t miss out — grab your 14-day trial for just $7 and experience the edge you need to thrive in today’s fast-paced markets.