

Iovance Biotherapeutics Inc. stocks have been trading down by -19.32 percent amid heightened scrutiny of its cancer therapy prospects.
Key Takeaways
- IOVA has pushed from the low $12s to the high $14s over recent sessions, with strong swings and tight daily closes signaling an active trading range.
- Recent intraday action on Iovance Biotherapeutics Inc. shows a sharp spike toward $17 followed by fast selling, a classic shakeout pattern that momentum traders track closely.
- Iovance Biotherapeutics Inc. is still losing money, with negative margins and cash burn, but a strong cash position and low debt give IOVA runway to keep funding operations.
- Key ratios for IOVA highlight high revenue growth but deeply negative returns on capital, which means traders are betting more on future progress than current profitability.
- With biotech sentiment choppy, traders are using clear support and resistance levels on IOVA’s chart to frame short-term trading plans and manage risk.
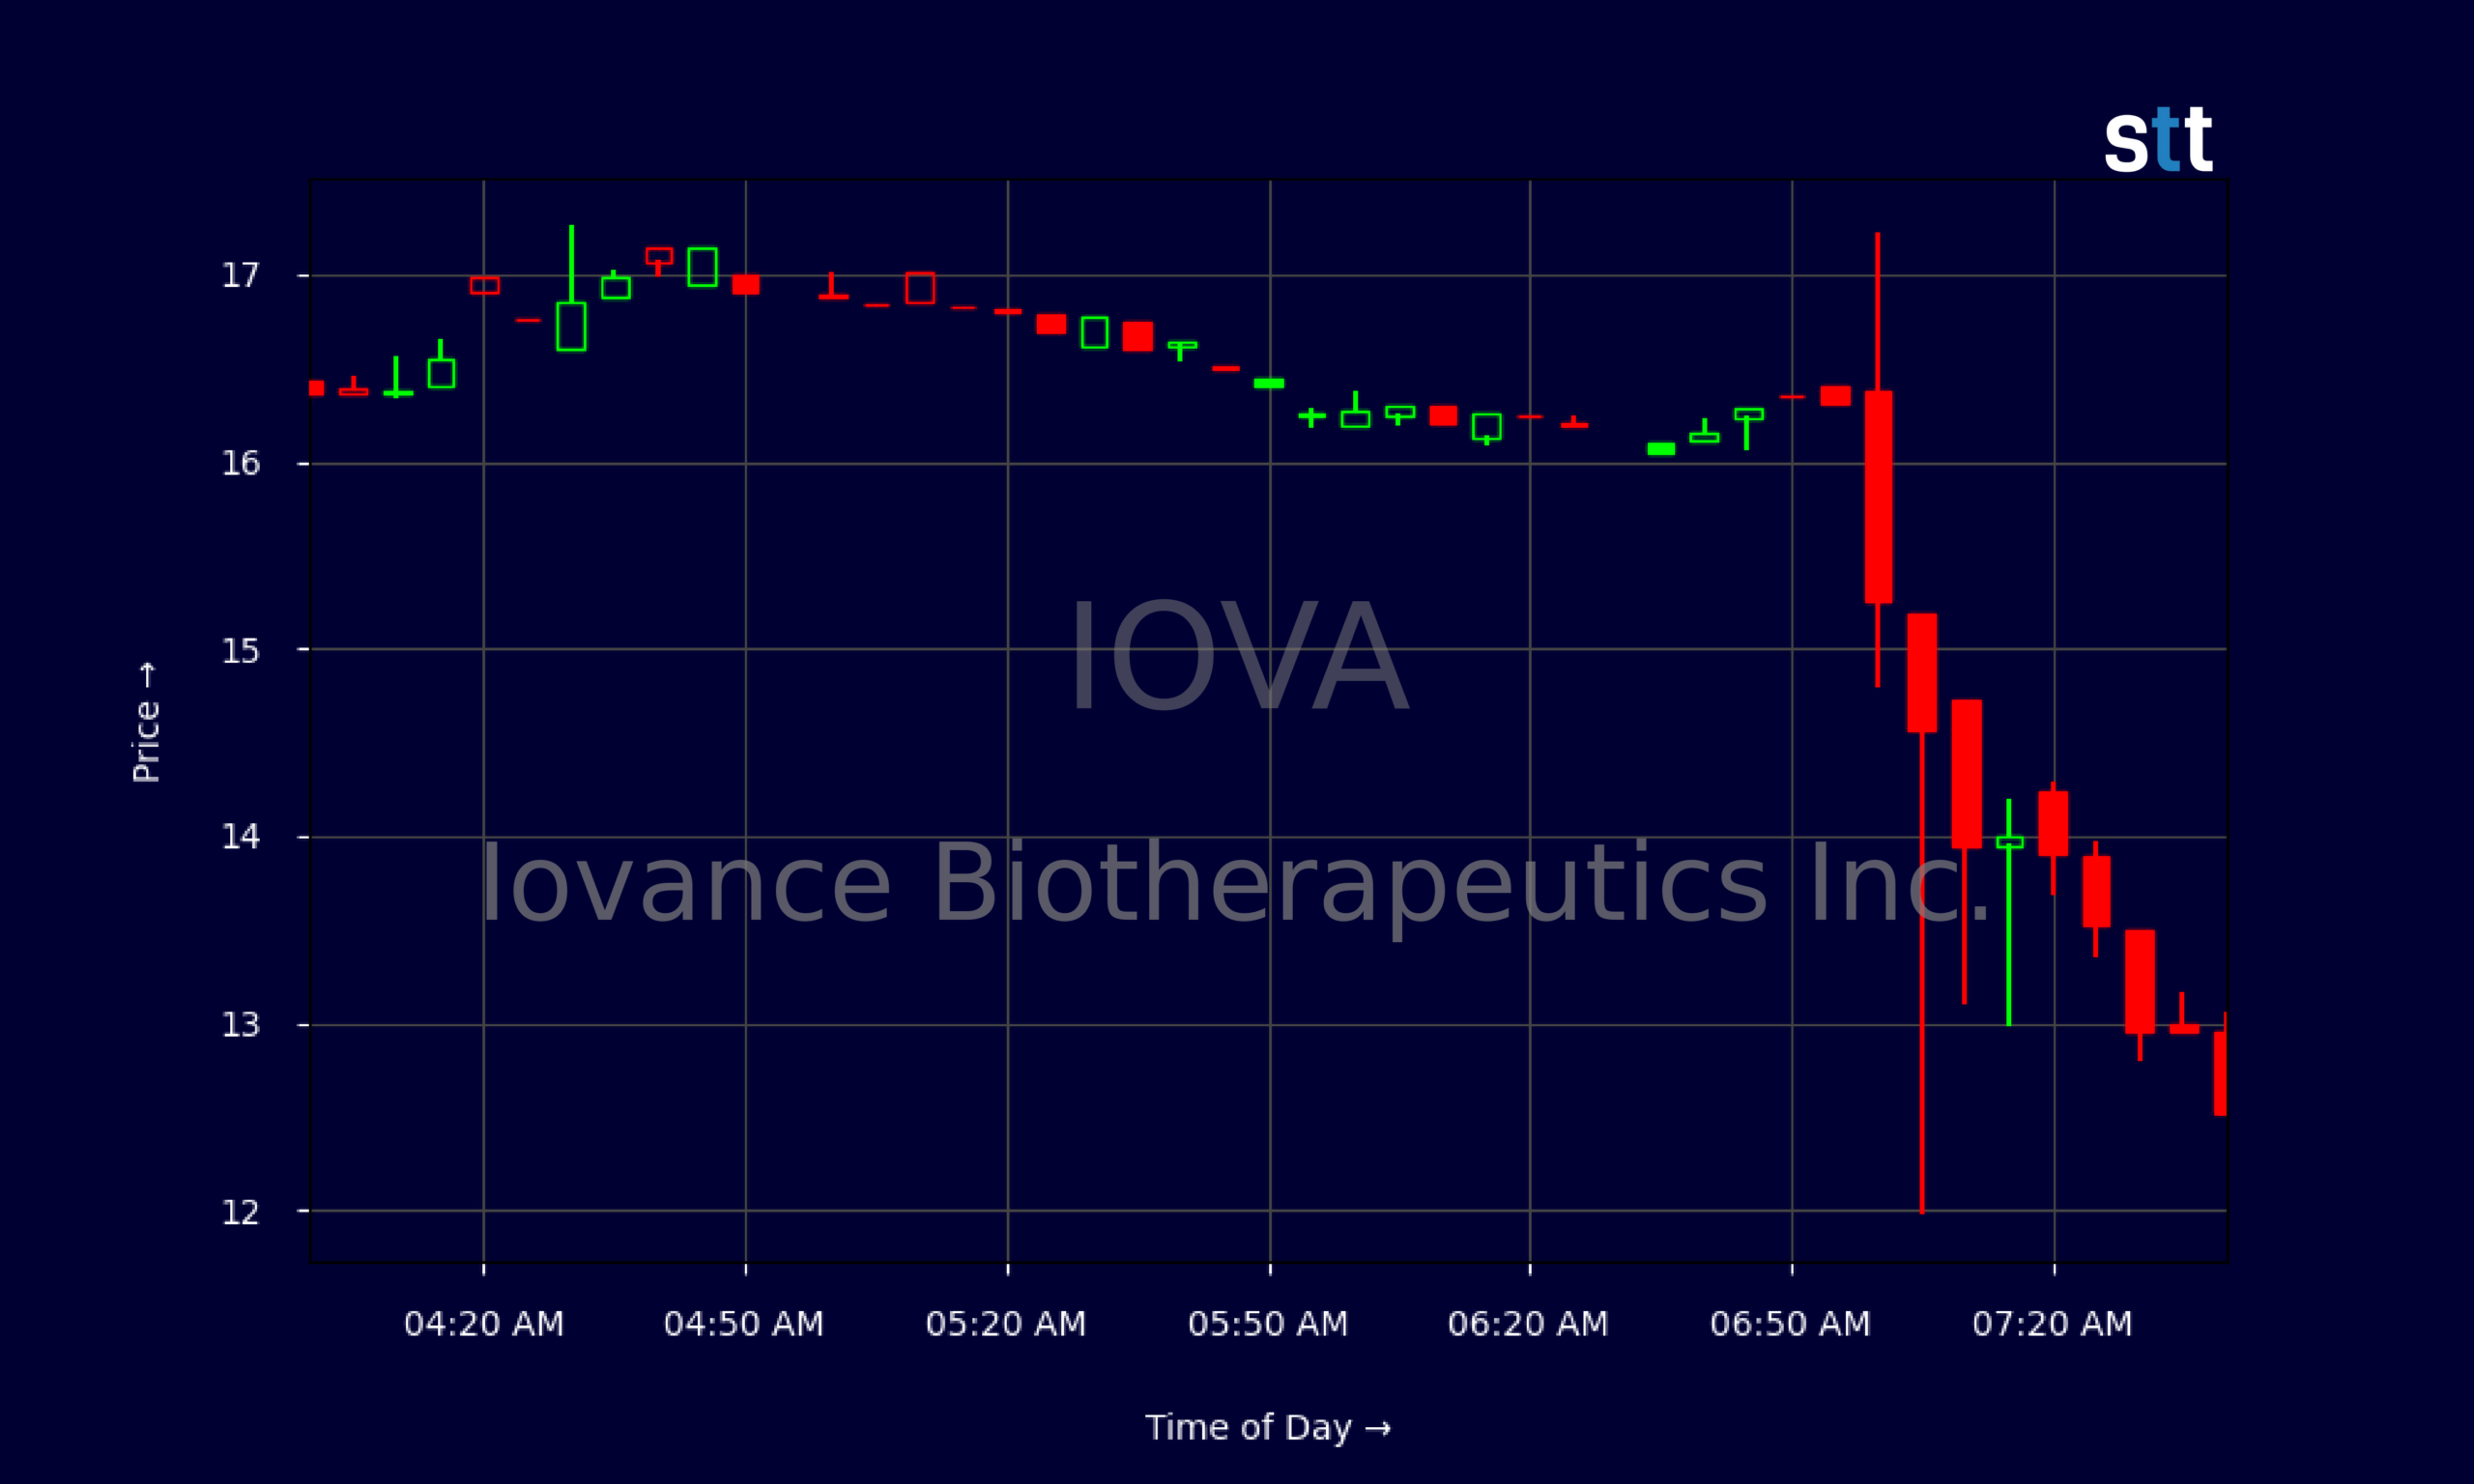
Live Update At 07:47:14 EDT: On Thursday, October 29, 2026 Iovance Biotherapeutics Inc. stock [NASDAQ: IOVA] is trending down by -19.32%! Discover the key drivers behind this movement as well as our expert analysis in the detailed breakdown below.
Quick Financial Overview
Iovance Biotherapeutics Inc. is a classic high-risk, high-reward biotech story. IOVA is growing revenue fast, posting about $263.5M in sales and more than 1,000% growth over three years. But the company is still far from profitable. Profit margins are deeply negative, with EBIT margin near -89% and return on equity and assets also sharply below zero. For traders, that screams “story stock” — the market is pricing in future potential, not current earnings.
On the balance sheet, IOVA shows about $915.5M in total assets and roughly $179.5M in total liabilities. Long-term debt runs around $43.3M, with a very low debt-to-equity ratio of 0.06. That’s important. It means Iovance Biotherapeutics Inc. is not over-levered, even while burning cash.
More Breaking News
- GOOG Stock Slides As Core Ads Miss And Legal Risks Mount
- BKYI Stock Surges As Middle East Deals Ignite Momentum
- Sprouts Farmers Market Falls 24% After Outlook Cut
- Glaukos (GKOS) Jumps As iDose TR Data And Retinal Deal Fuel Bullish Setup
Liquidity looks solid for now. Current ratio near 4.4 and quick ratio around 3.7 suggest IOVA can cover near-term bills without scrambling for emergency funding. Operating cash flow is negative at roughly -$60.8M for the latest quarter, and free cash flow around -$66.3M, so the company still leans on capital markets. For traders, this mix — strong cash, low debt, big burn — keeps IOVA squarely in the speculative biotech bucket, where headlines and sentiment can move the stock fast.
Why Traders Are Watching IOVA Price Action
The chart is where IOVA really tells its story. On the daily time frame, Iovance Biotherapeutics Inc. has bounced hard off the low $12s, with closes recently in the mid-to-high $14s. That’s a meaningful percentage move in a short window. The stock has printed several long intraday wicks, showing both aggressive buying and profit-taking within the same session.
Look at the day with a close at $14.81 after opening around $14.30. IOVA pushed as high as $14.91 and dipped to $14.18 before closing near the top of the range. That type of candle often signals dip buyers stepping in and shorts covering late. Across recent days, Iovance Biotherapeutics Inc. has repeatedly tested the mid-$14 area and snapped back from dips into the $13s. Traders read that as emerging support.
Zooming in, the 5‑minute intraday data shows a premarket rip from roughly $16.60 up toward $17.25, then a failed push and heavy selling back into the mid-$14s and lower. That is a textbook trap zone. Late chasers into $17 got punished; disciplined traders who waited for the fade had multiple scalp opportunities as IOVA unwound.
This kind of range — roughly $12 on the downside to $17 on the upside in a short span — keeps Iovance Biotherapeutics Inc. on many screeners. Volatility is the lifeblood of active trading. While the fundamentals of IOVA are still deeply red, the tape shows strong participation and liquidity. For day traders and swing traders, that matters more than a clean income statement.
Conclusion
Iovance Biotherapeutics Inc. sits at the intersection of ambitious biotech story and pure trading vehicle. Fundamentally, IOVA is burning cash, posting about -$47.3M in quarterly net losses and negative returns across almost every profitability metric. Yet it holds over $110M in cash, modest debt, and nearly $357.4M in working capital. That gives IOVA room to keep executing, which is why the market still assigns a rich price-to-sales multiple above 20 and a price-to-book ratio near 9.
From a trading perspective, the recent run from roughly $12 to the mid-$14s — plus intraday spikes into the $17s — shows that Iovance Biotherapeutics Inc. can move fast in both directions. Breakouts can be powerful, but failures are just as sharp. That’s the environment where discipline pays.
Traders studying IOVA should map the clear levels: support in the low-to-mid $13s, resistance in the high $14s and around $17. Combine that with volume and intraday price action rather than falling in love with the story. As Tim Sykes likes to say, “trade the price action, not the hype.” That aligns with another core trading principle: as Tim Bohen, lead trainer with StocksToTrade says, “I never chase price. The best opportunities allow me to enter on my terms, not when I’m feeling pressured.”. For IOVA, that means planning trades around volatility, cutting losses quickly, and letting the chart — not emotions — guide every decision. This is educational and research material only, but the lessons in how IOVA trades are very real.
This is stock news, not investment advice. StocksToTrade News delivers real-time stock market updates tailored to highlight the key catalysts driving short-term price movements. Our coverage is designed for active traders and investors who thrive in fast-moving markets, with a focus on volatile sectors like penny stocks, AI stocks, Robinhood stocks and other momentum plays. From earnings reports and FDA approvals to mergers, new contracts, and unusual trading volume, we break down the events that can spark significant price action.
Looking to level up your trading game? Explore StocksToTrade, the ultimate platform for traders. With powerful tools designed for swing and day trading, integrated news scanning, and even social media monitoring, StocksToTrade keeps you one step ahead.
Check out our quick startup guide for new traders!
- How to Read Stock Charts: A Guide for Beginners
- Trading Plan: 6 Steps to Create One
- How To Create a Stock Watchlist
Ready to build your watchlists? Check out these curated lists:
Once your watchlist is set, take the next step and trade with confidence using StocksToTrade’s robust platform. Don’t miss out — grab your 14-day trial for just $7 and experience the edge you need to thrive in today’s fast-paced markets.