

Iovance Biotherapeutics Inc. stocks have been trading down by -31.47 percent following sentiment-driven concerns over its cancer therapy prospects.
Key Takeaways
- IOVA has been grinding higher, with recent closes pushing toward the upper end of its multi-week range.
- The intraday chart shows wild premarket swings, then heavy profit-taking and consolidation — classic day-trader terrain.
- Iovance Biotherapeutics Inc. carries strong liquidity, with a current ratio above 4, giving the company runway despite steep losses.
- Profitability remains deeply negative, but triple‑digit revenue growth keeps momentum traders focused on IOVA’s upside narrative.
- Active traders are watching whether IOVA can hold recent gains and build a new base above prior resistance.
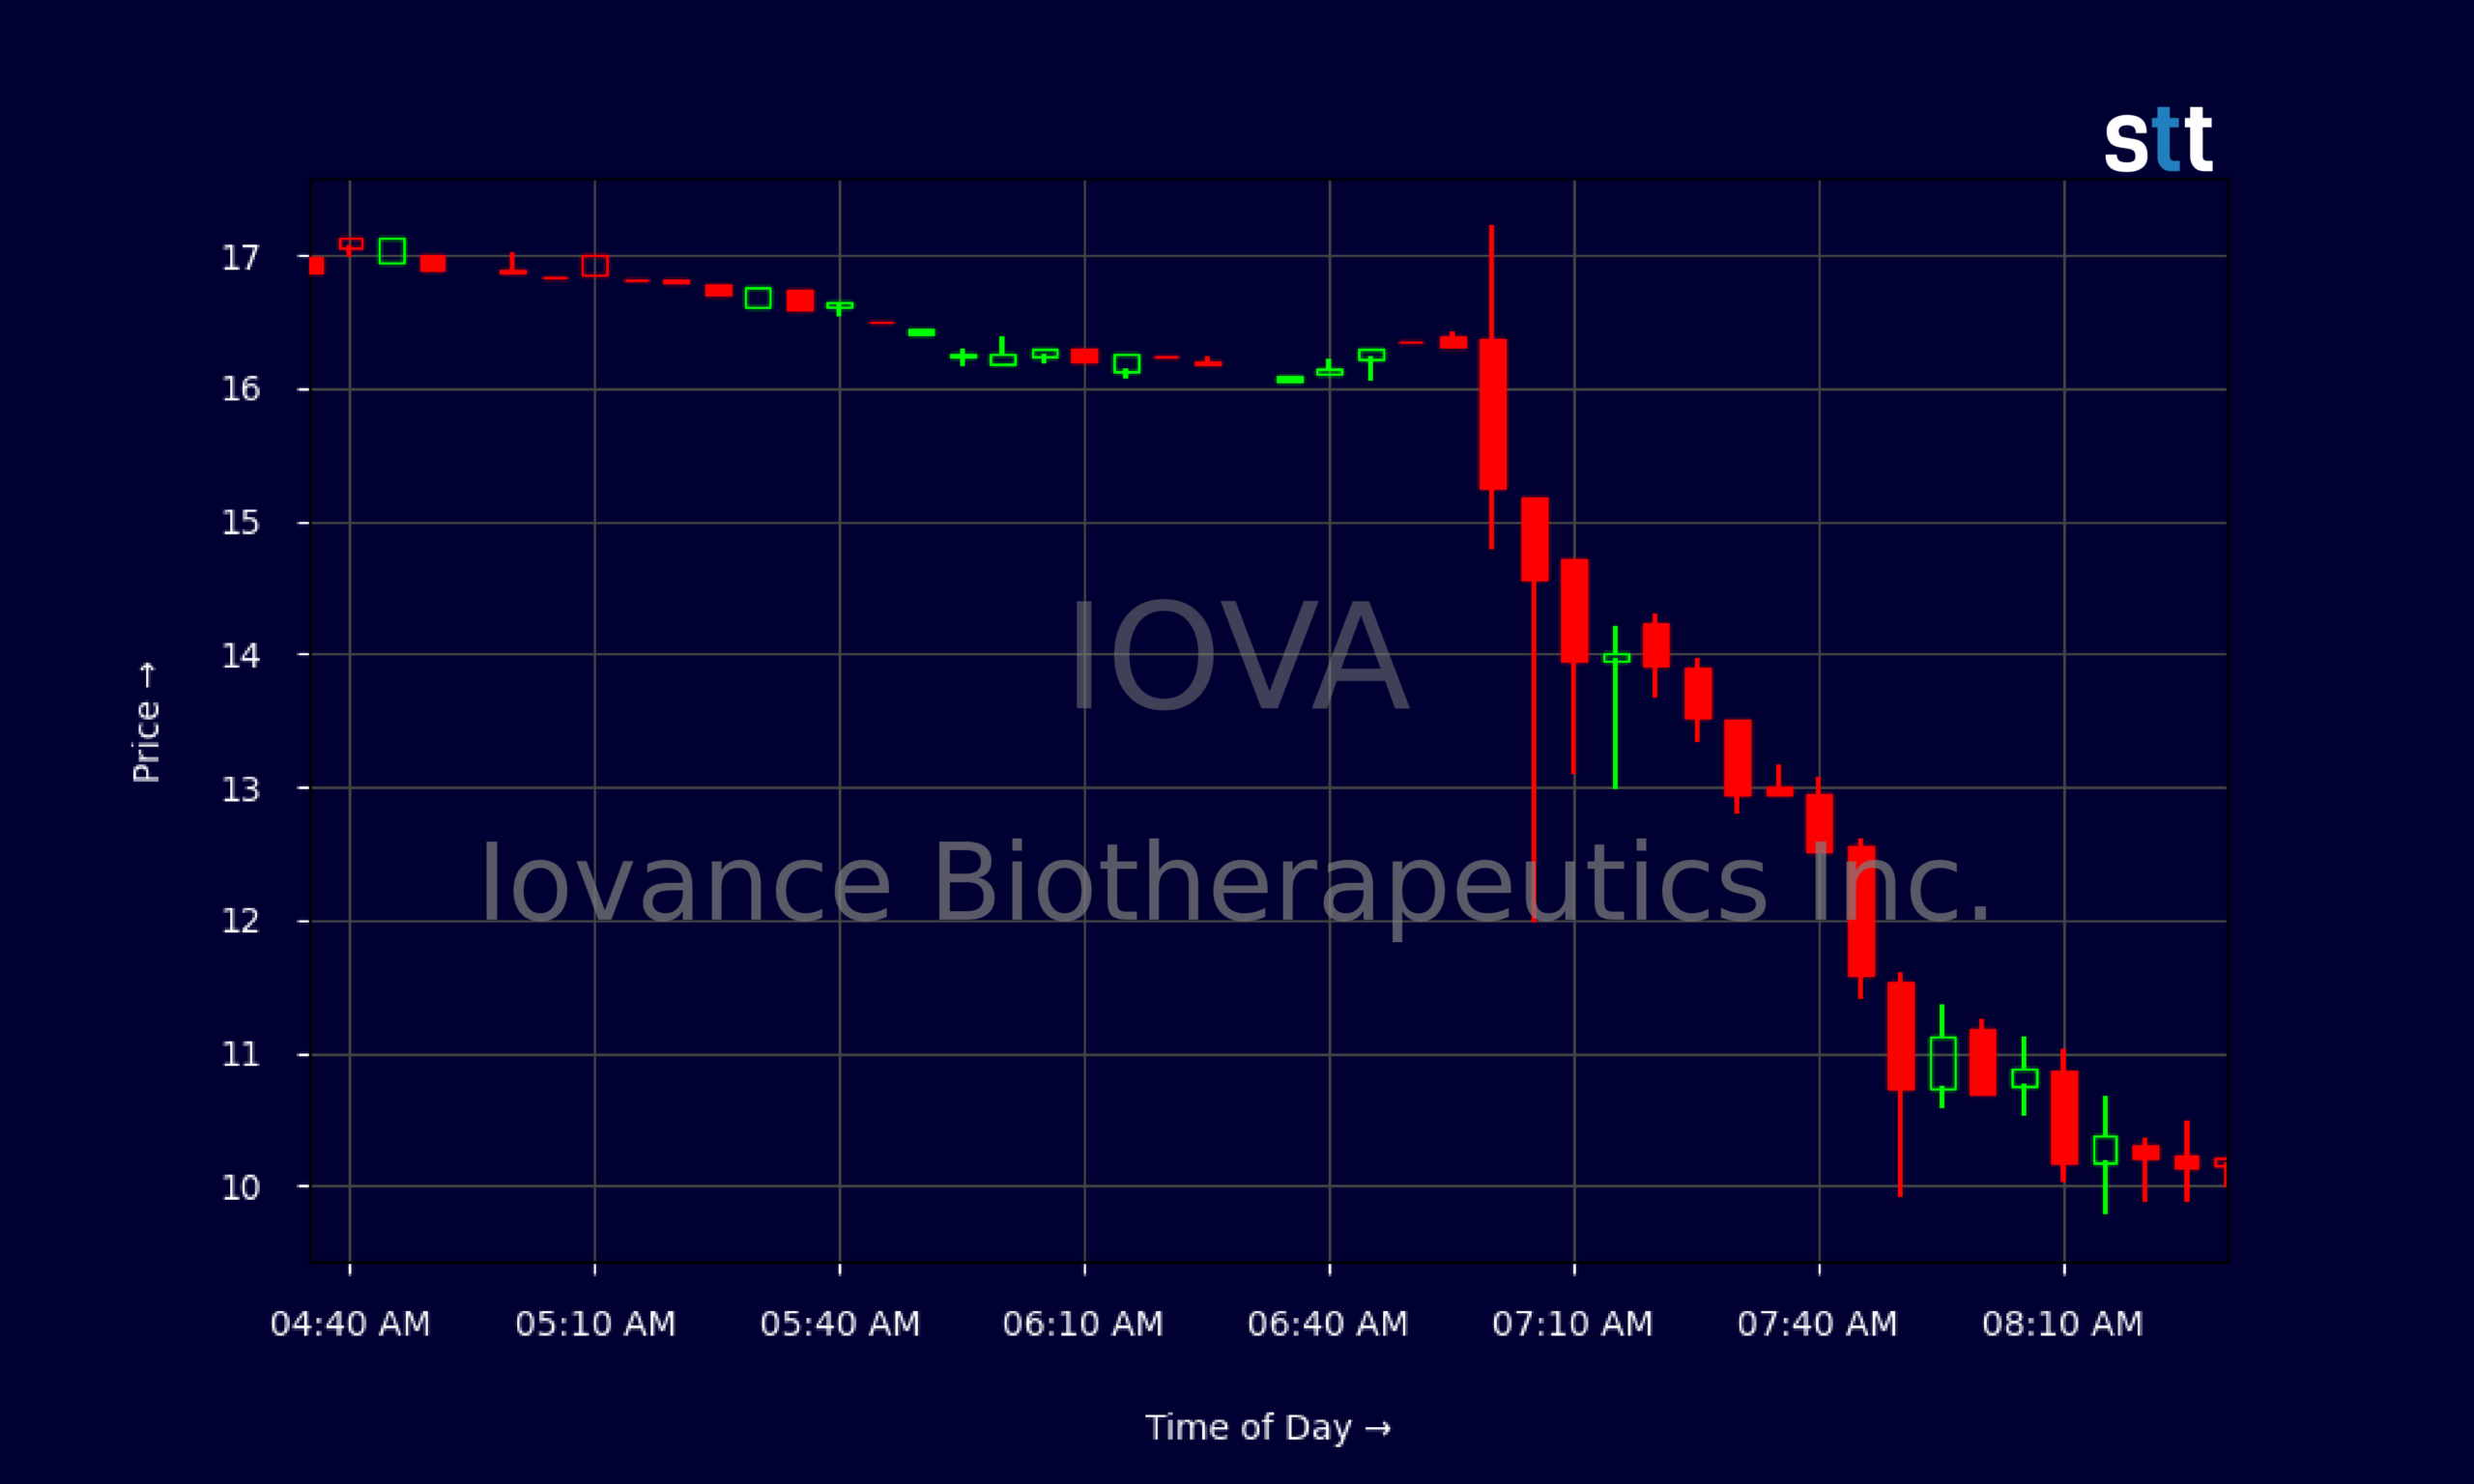
Live Update At 08:35:16 EDT: On Thursday, October 29, 2026 Iovance Biotherapeutics Inc. stock [NASDAQ: IOVA] is trending down by -31.47%! Discover the key drivers behind this movement as well as our expert analysis in the detailed breakdown below.
Quick Financial Overview
Iovance Biotherapeutics Inc., trading under ticker IOVA, is a classic high‑beta biotech story: big growth, heavy losses, and plenty of volatility. Revenue over the last year sits around $263.5M, and revenue growth over three years is above 1,000%. That gets momentum traders interested fast. But profitability is nowhere in sight. IOVA’s EBIT margin is near -89%, and return on equity is around -59%, so the core business is burning cash to scale.
On the latest quarterly numbers (period ended 2026/06/30), IOVA posted about $99.3M in revenue and a net loss of roughly $47.3M, or -$0.11 per share. Operating cash flow was negative at about -$60.8M, though free cash flow was slightly better at around -$66.3M. That is not unusual for a biotech building out commercial operations.
More Breaking News
- ICLR Stock Jumps As ICON plc Lifts 2026 Guidance
- Life Time Group Holdings Falls 2% Ahead of Earnings
- ITUB Stock Slides As Traders Dig Into Bank’s Fundamentals
- Amrize Ltd Falls 7% After Sales Miss and Weak Outlook
What keeps IOVA in play is its balance sheet. The company shows roughly $110.8M in cash, total current assets near $464.3M, and current liabilities around $106.8M. That gives Iovance Biotherapeutics Inc. a current ratio of 4.4 and low debt — total debt to equity is only about 0.06. For traders, that means dilution risk is always on the table, but near‑term solvency isn’t the story right now. The story is execution and price action.
Why Traders Are Watching IOVA Price Action
IOVA’s chart is doing exactly what short‑term traders want: moving. On the daily data, Iovance Biotherapeutics Inc. has spent recent sessions stair‑stepping higher. Closes have climbed from the low‑$13s to the high‑$14s, with the most recent prints around $14.81 after tagging intraday highs near $14.91. That’s a solid bounce from earlier dips toward $12.90–$13.00, and it shows dip buyers are still lurking.
Every candle tells a story. Look at the day where IOVA opened near $12.515 and closed just under $12.92 after hitting $13.15. That’s early selling pressure but support into the close. A few sessions later, the stock pushed from an open near $13.86 to a close over $14.20, with highs near $14.74. The pattern for Iovance Biotherapeutics Inc. is clear: sellers show up on strength, but they’re not crushing the trend. The stock keeps grinding back.
The intraday 5‑minute chart for IOVA shows even more drama. Pre‑market, the stock spiked as high as $17.21 from around $16.38, then faded hard down into the low‑$14s by early regular hours. After that, Iovance Biotherapeutics Inc. chopped between roughly $10 and $13, with sharp swings and failed bounces — textbook liquidity for day trading. Big ranges give scalpers room, but they also punish traders who don’t respect risk.
When you blend this price action with IOVA’s fundamentals — fast revenue growth, deep losses, and decent cash — you get a stock that behaves like a trading vehicle more than a stable compounder. That’s why so many active traders keep Iovance Biotherapeutics Inc. on watch: it trends, it flushes, and it gives second chances.
Conclusion
Iovance Biotherapeutics Inc. sits in that familiar biotech sweet spot for active trading — not tiny, not stable, just volatile enough to matter. IOVA has a market backdrop of heavy spending and negative margins, but also strong top‑line growth and a relatively clean balance sheet. With a price‑to‑sales multiple above 20 and price‑to‑book around 9, traders are clearly paying up for future potential, not current profits.
On the tape, IOVA is showing constructive action. Higher lows on the daily chart, persistence near recent highs, and big intraday ranges all tell the same story: Iovance Biotherapeutics Inc. remains a battleground between momentum chasers and profit‑takers. As long as support levels in the low‑$13s to mid‑$14s keep holding, breakout traders will be looking for a sustained push through the recent high zone.
For newer traders following IOVA, the lesson is simple. Respect volatility, define your risk, and don’t marry the story. As Tim Bohen, lead trainer with StocksToTrade says, “Preparation is half the trade. By the time the bell rings, my decisions are nearly made.” Tim Sykes says it best: “Cut losses quickly, because holding and hoping is not a strategy, it’s a disaster plan.” That mindset fits Iovance Biotherapeutics Inc. perfectly. Use the numbers and the chart for education and research, make a plan before every trade, and let the price action do the talking. This is a trading vehicle, not a promise.
This is stock news, not investment advice. StocksToTrade News delivers real-time stock market updates tailored to highlight the key catalysts driving short-term price movements. Our coverage is designed for active traders and investors who thrive in fast-moving markets, with a focus on volatile sectors like penny stocks, AI stocks, Robinhood stocks and other momentum plays. From earnings reports and FDA approvals to mergers, new contracts, and unusual trading volume, we break down the events that can spark significant price action.
Looking to level up your trading game? Explore StocksToTrade, the ultimate platform for traders. With powerful tools designed for swing and day trading, integrated news scanning, and even social media monitoring, StocksToTrade keeps you one step ahead.
Check out our quick startup guide for new traders!
- How to Read Stock Charts: A Guide for Beginners
- Trading Plan: 6 Steps to Create One
- How To Create a Stock Watchlist
Ready to build your watchlists? Check out these curated lists:
Once your watchlist is set, take the next step and trade with confidence using StocksToTrade’s robust platform. Don’t miss out — grab your 14-day trial for just $7 and experience the edge you need to thrive in today’s fast-paced markets.