INVE Technologies Inc. stocks have been trading up by 22.97 percent after announcing a transformative AI-driven product partnership.
Click Here for a Millionaire's POV on Trading INVE
SUBSCRIBE FOR ALERTSJOIN 50,000+ ACTIVE TRADERS
Key Takeaways
- Shares of INVE Technologies Inc. have chopped between roughly $2.22 and $2.45 over recent sessions, signaling tight range-bound trading.
- The latest intraday surge from about $2.29 to the mid-$2.70s shows INVE attracting short-term momentum traders.
- INVE sits on roughly $119.4M in cash with minimal debt, giving the company strong financial runway despite ongoing losses.
- Profitability remains weak for INVE, with negative margins and free cash flow, keeping it in turnaround territory.
- Traders are tracking whether INVE can turn its cash cushion and low price‑to‑book ratio into a sustainable trend.
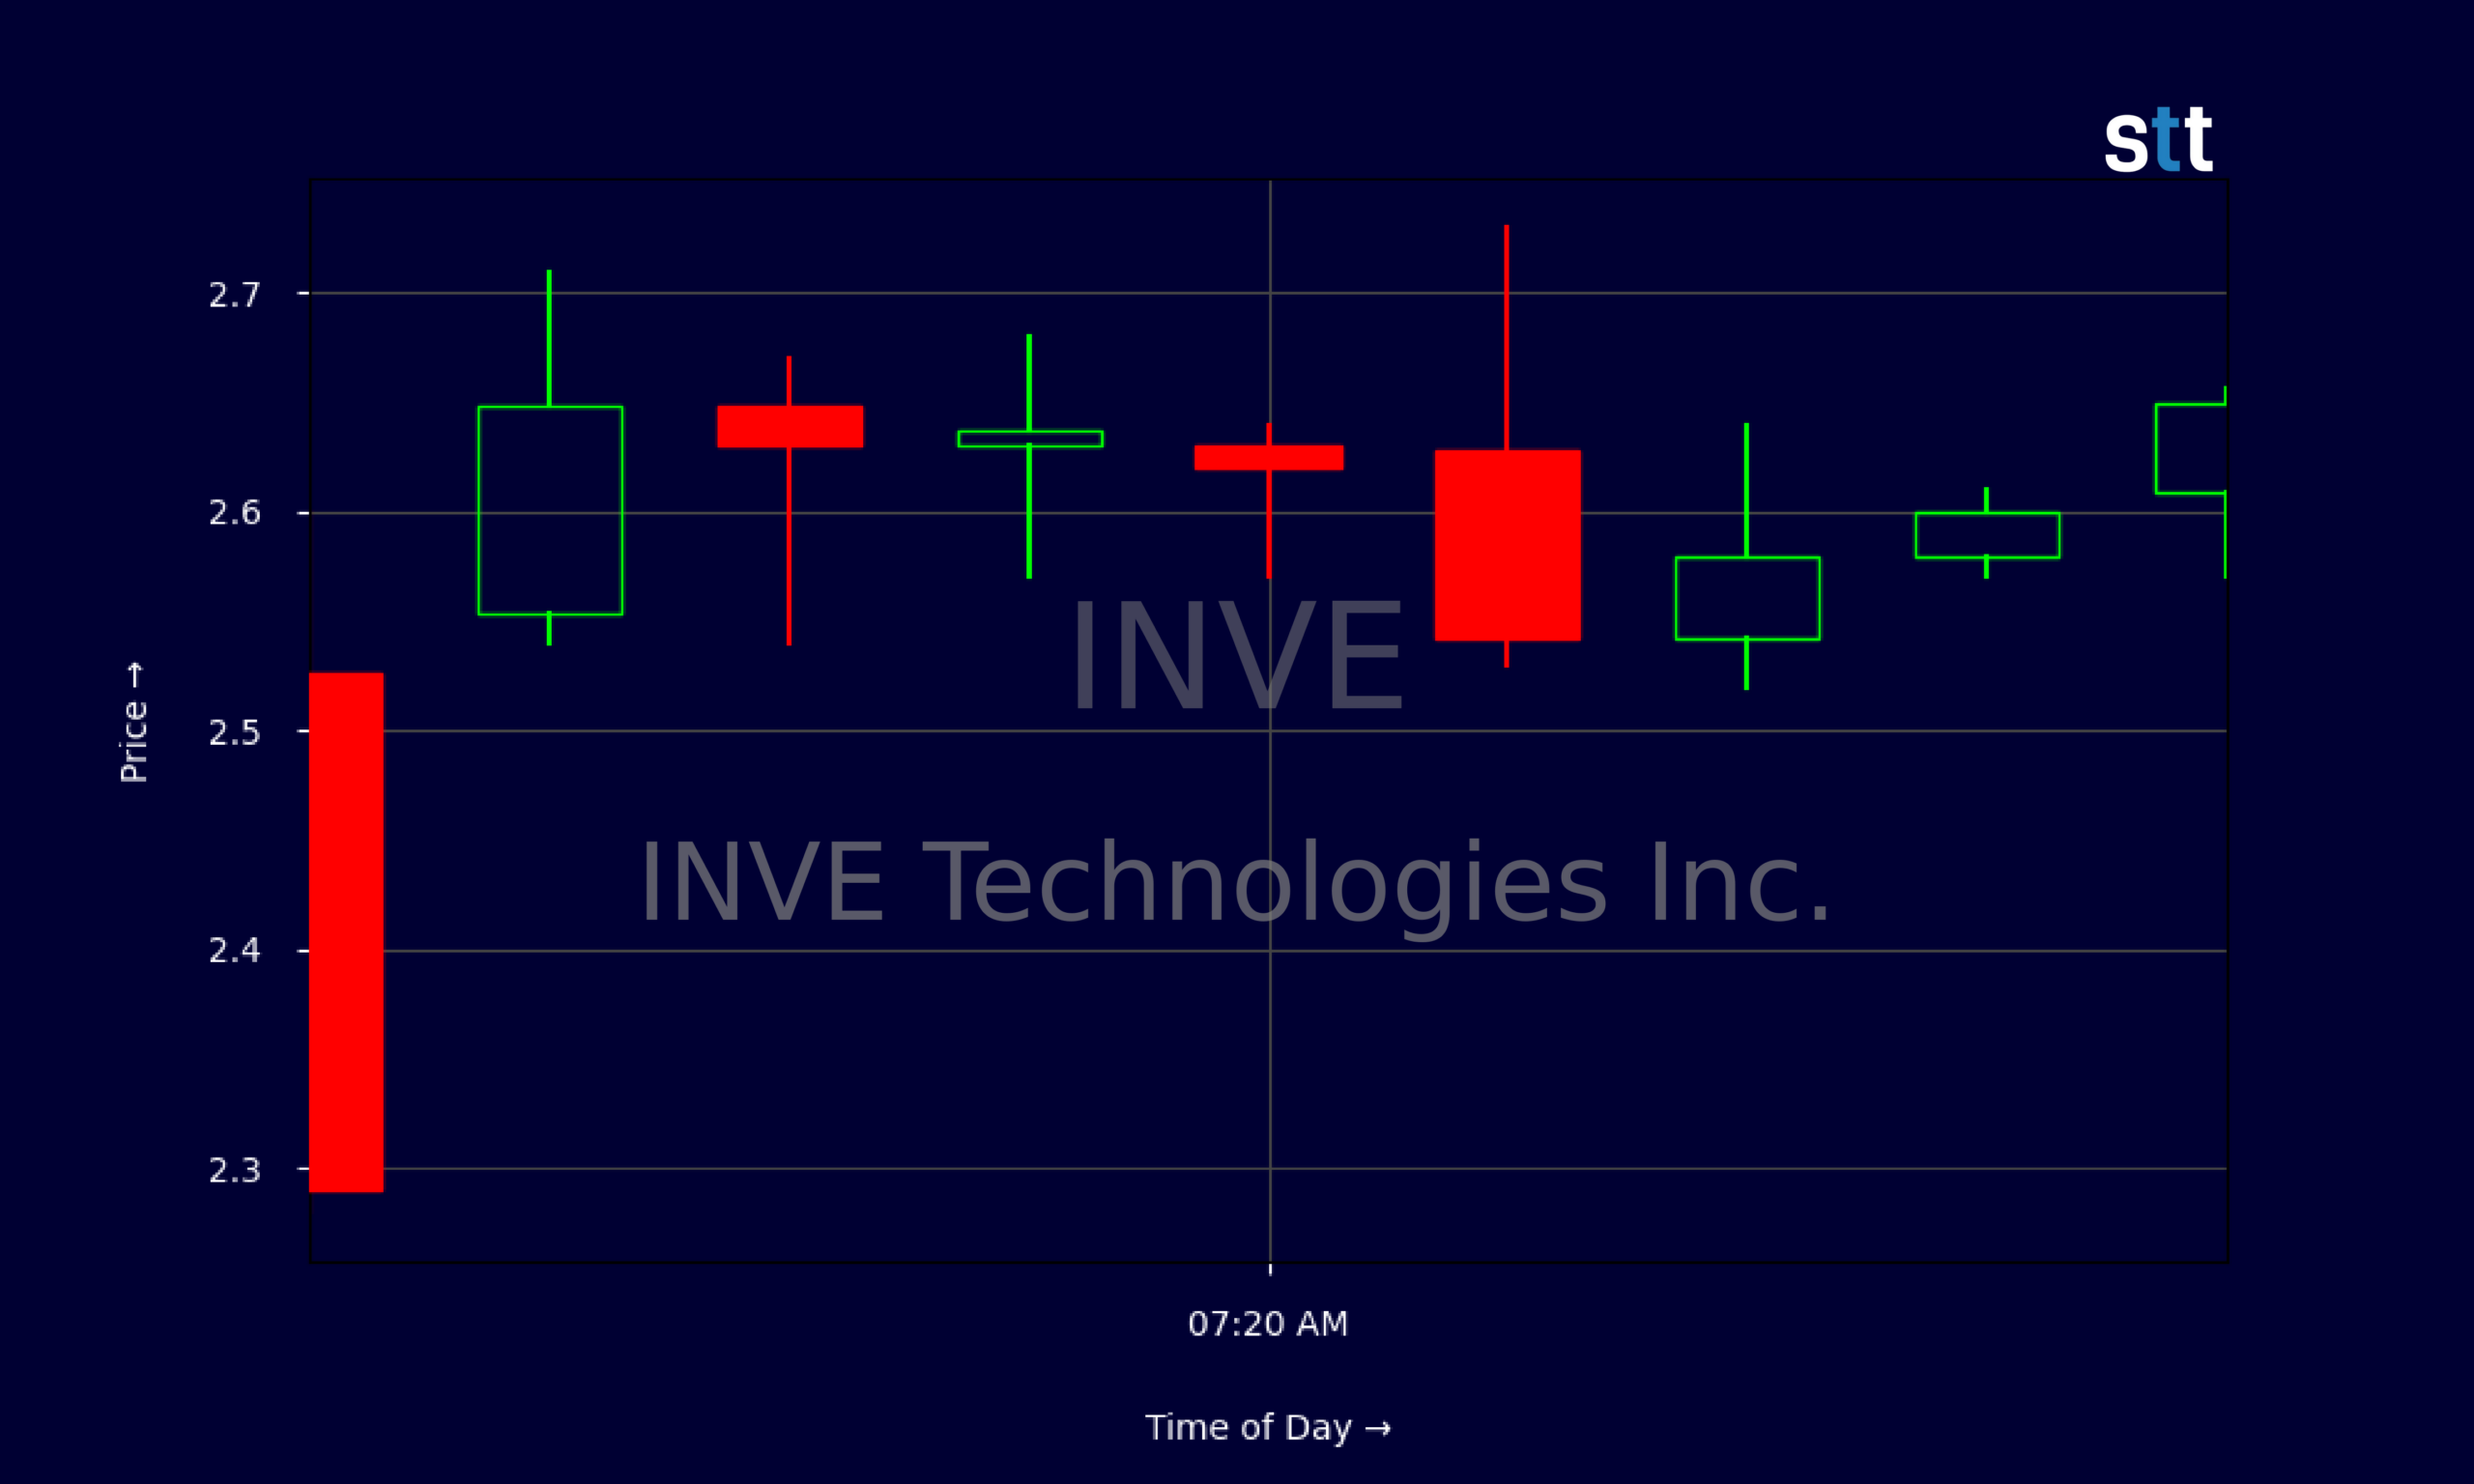
Live Update At 07:46:56 EDT: On Wednesday, October 21, 2026 INVE Technologies Inc. stock [NASDAQ: INVE] is trending up by 22.97%! Discover the key drivers behind this movement as well as our expert analysis in the detailed breakdown below.
Quick Financial Overview
INVE Technologies Inc. is a classic cash‑rich, loss‑making small cap. Revenue for the latest reported quarter sits around $5.7M, yet INVE is still burning money. Net income from continuing operations was about -$4.7M, and free cash flow came in near -$5.1M. For traders, that screams “story stock” rather than steady cash generator.
Margins are rough. INVE posts an EBIT margin near -88.1% and a profit margin around -59.5%. Gross margin of 15.9% shows the core business has limited pricing power right now. At the same time, the balance sheet looks surprisingly clean. INVE reports around $119.4M in cash and short‑term investments against only about $0.4M in long‑term debt.
More Breaking News
- RBNE Stock Craters As Volatile Price Action Grabs Trader Focus
- SPCH Leverage Shares 2X Long SPCX Daily Draws Active Traders
- KEY Stock Draws Bullish Targets As Bank Analysts Reset
- SSPC Leverage Shares 2X Short SPCX Daily Draws Active Traders After Sharp Swing
Key liquidity ratios for INVE are huge. The current ratio is roughly 20.4 and the quick ratio about 18.7, which means the company has far more liquid assets than short‑term obligations. Price‑to‑book near 0.44 tells traders the market values INVE stock at less than half its book value. That combination of heavy cash, low debt, and a discounted valuation is exactly why active traders keep INVE on watch, despite its ongoing operating losses.
Why Traders Are Watching INVE Price Action
INVE Technologies Inc. has been drifting in a narrow channel on the daily chart. Over the last several sessions, INVE has traded roughly between $2.22 on the low side and about $2.45 on the high side, with many closes clustering in the $2.35–$2.40 region. That kind of tight coil often sets up the next bigger move, up or down, once volume picks a side.
Look at the single‑day intraday tape and the story gets more interesting. INVE opened near $2.29 and quickly pushed to around $2.60, then churned higher into the $2.70s. That is a strong percentage move in a short window. For active traders who scan for volatility and range expansion, this kind of action is a clear signal that INVE can still move when liquidity shows up.
Under the hood, INVE remains a turnaround. Revenue has shrunk over both three‑ and five‑year windows, and return on equity on a trailing basis is negative. Yet INVE’s huge cash pile and very low leverage create a safety buffer that many small caps do not have. If sentiment flips, traders know INVE has enough capital to fund a pivot or restructure without running straight into a balance‑sheet wall.
That’s why chart‑focused traders keep cycling back to INVE. The stock offers a mix of compressed daily range, explosive intraday spikes, and a capital structure that reduces bankruptcy risk in the near term. The key is waiting for that clean break above resistance or fail at support that turns INVE’s quiet sideways drift into a tradable trend.
Conclusion
INVE Technologies Inc. sits at a crossroads that seasoned traders recognize. On one side, INVE is still losing money with deep negative margins and ongoing cash burn. Revenue trends are weak and the latest quarter shows operating income firmly in the red. On the other side, INVE holds over $119M in cash, carries almost no debt, and trades below book value. That split between ugly earnings and strong liquidity is what creates opportunity for traders who know how to manage risk.
The recent intraday run from the low $2s into the $2.70s shows that INVE can attract momentum and volume when the tape wakes up. Short‑term traders will zero in on support near the low $2.20s and resistance around the mid‑$2.40s to see where INVE breaks next. Longer‑term swing traders will watch whether the company can stabilize revenue and gradually improve margins while leaning on that thick cash cushion.
For those studying INVE’s chart and fundamentals, this is a textbook example of a cash‑heavy, beaten‑down story where timing matters more than prediction. As Tim Sykes loves to remind his students, “Patterns repeat, but your job is to cut losses quickly and only stick around when the price action confirms your thesis.” That mindset lines up with the discipline many modern day traders emphasize. As Tim Bohen, lead trainer with StocksToTrade says, “I never chase price. The best opportunities allow me to enter on my terms, not when I’m feeling pressured.” INVE gives traders that kind of educational setup: clear levels, defined risk, and enough volatility to reward discipline — but only for those who treat it as a trading lesson, not a guarantee.
This is stock news, not investment advice. StocksToTrade News delivers real-time stock market updates tailored to highlight the key catalysts driving short-term price movements. Our coverage is designed for active traders and investors who thrive in fast-moving markets, with a focus on volatile sectors like penny stocks, AI stocks, Robinhood stocks and other momentum plays. From earnings reports and FDA approvals to mergers, new contracts, and unusual trading volume, we break down the events that can spark significant price action.
Looking to level up your trading game? Explore StocksToTrade, the ultimate platform for traders. With powerful tools designed for swing and day trading, integrated news scanning, and even social media monitoring, StocksToTrade keeps you one step ahead.
Check out our quick startup guide for new traders!
- How to Read Stock Charts: A Guide for Beginners
- Trading Plan: 6 Steps to Create One
- How To Create a Stock Watchlist
Ready to build your watchlists? Check out these curated lists:
Once your watchlist is set, take the next step and trade with confidence using StocksToTrade’s robust platform. Don’t miss out — grab your 14-day trial for just $7 and experience the edge you need to thrive in today’s fast-paced markets.