
INVE Technologies Inc. surged as breakthrough product news energized investors, with stocks have been trading up by 14.41 percent.
Click Here for a Millionaire's POV on Trading INVE
SUBSCRIBE FOR ALERTSJOIN 50,000+ ACTIVE TRADERS
Key Takeaways
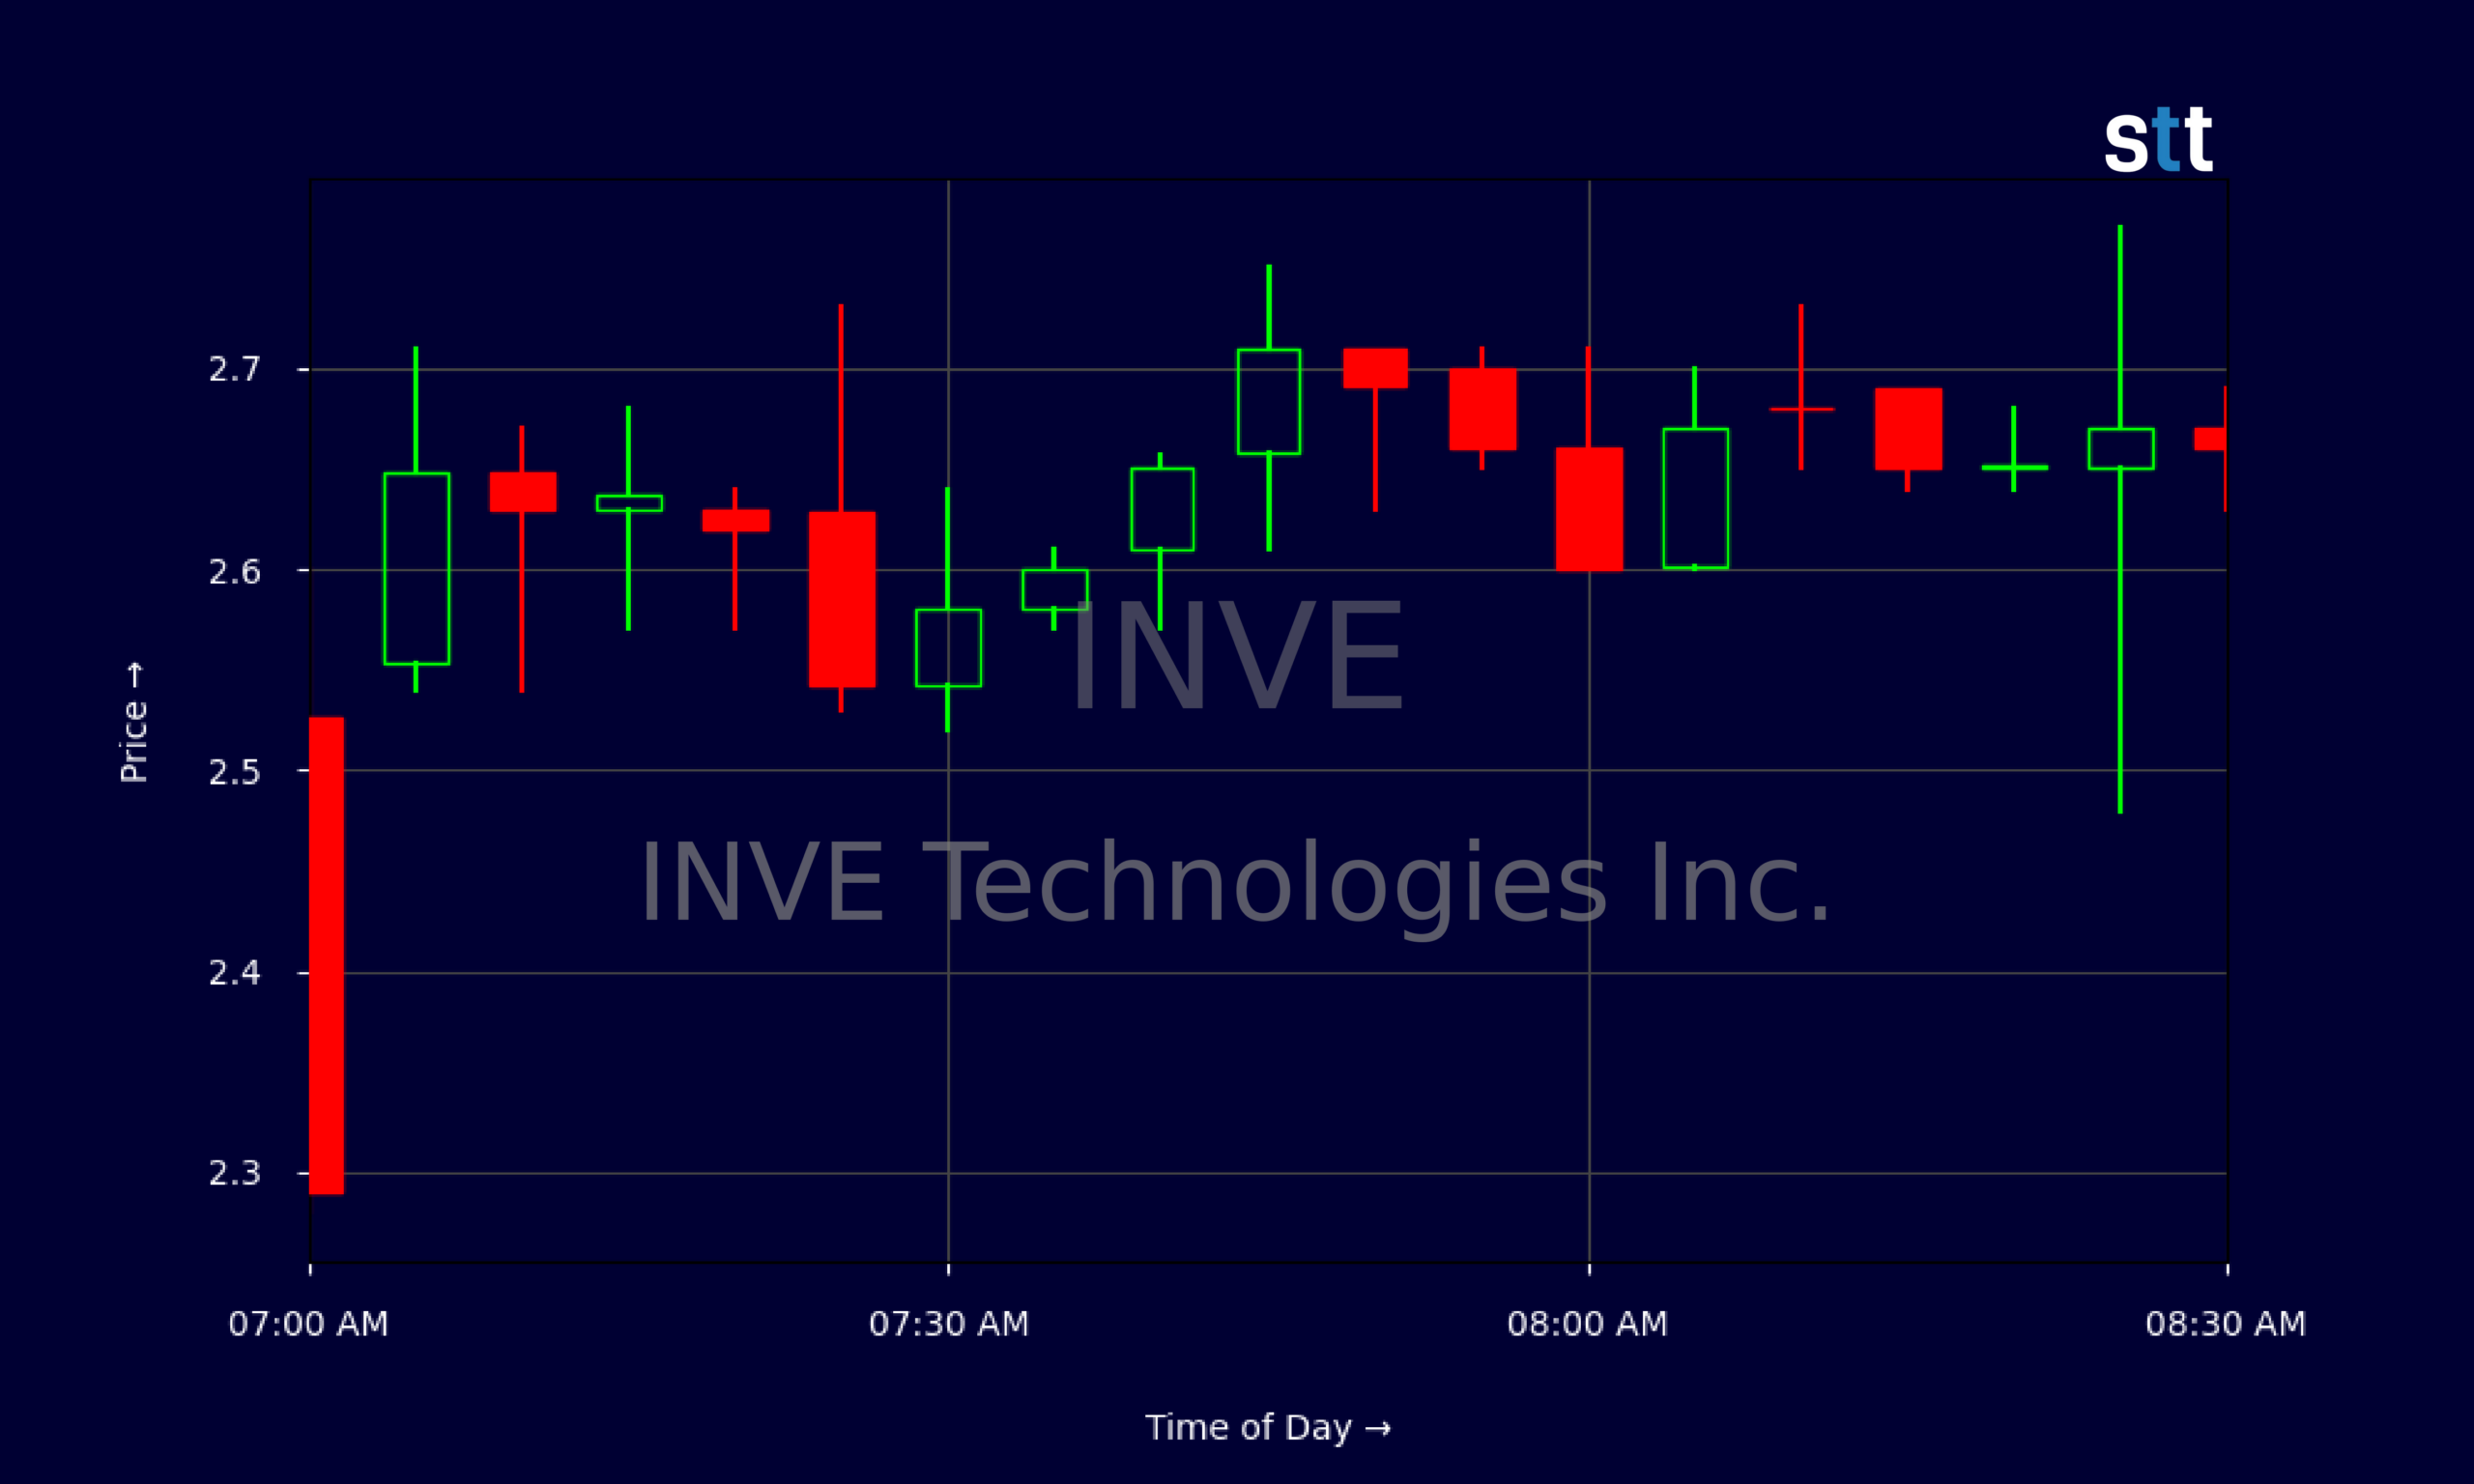
- Price action in INVE shows a slow grind up from the low-$2.30s into the mid-$2.60s, with tighter intraday ranges signaling active but controlled trading.
- The latest quarter shows INVE Technologies Inc. losing money on operations, yet sitting on roughly $119M in cash and almost no debt, a rare combo in small caps.
- Key ratios for INVE highlight weak margins but a very strong current ratio above 20, giving traders confidence the company can weather extended drawdowns.
- Intraday spikes toward $2.75 show speculative interest in INVE, but repeated fades warn traders to respect overhead supply and manage risk tightly.
Live Update At 08:32:35 EDT: On Wednesday, October 21, 2026 INVE Technologies Inc. stock [NASDAQ: INVE] is trending up by 14.41%! Discover the key drivers behind this movement as well as our expert analysis in the detailed breakdown below.
Quick Financial Overview
INVE Technologies Inc. is a classic “cash-rich, profit-poor” small-cap story right now. The latest quarterly numbers show revenue of about $5.7M, but operating income was a loss of roughly $5.5M. That means the core business of INVE is not yet pulling its weight. Gross margin sits near 16%, which is thin, so every dollar of sales leaves little room to cover expenses.
Where INVE stands out is the balance sheet. The company holds about $119M in cash and equivalents, against only around $0.4M of long-term debt. Current assets of roughly $132M dwarf current liabilities of about $6.5M, giving INVE a huge current ratio near 20. That’s runway.
More Breaking News
- AIXI Stock Whipsaws As Traders Chase AI Volatility
- SPCX Stock Rallies As Starlink Mobile And AI Ambitions Scale Up
- CoreWeave CRWV Stock Rebounds As Wall Street Bites On AI Growth
- KEY Stock Draws Bullish Targets As Bank Analysts Reset
For traders, this mix matters. INVE is not priced like a high-flying growth name — the price-to-book ratio sits near 0.44, meaning the market values the stock at less than half of its stated equity. At the same time, negative free cash flow of roughly $5.1M in the quarter shows the burn is real. INVE traders are watching whether management can flip that script before the cash cushion loses its shine.
Why Traders Are Watching INVE’s Price Action
INVE has been trading in a tight range on the daily chart, but under the surface, the tape tells a more interesting story. Over the last several sessions, INVE closed mostly between $2.22 and $2.42. That’s a shallow channel, yet the intraday data shows repeated pushes higher, especially into the premarket and early regular hours.
Look at the 5‑minute candles: INVE opened the session around $2.29 at 07:00, then ramped quickly toward the mid‑$2.60s, with prints as high as about $2.77 in the 07:25–08:25 window. That’s a sizeable intraday extension from prior daily closes around $2.22–$2.30. For short-term traders, those kinds of range expansions are exactly where the opportunity — and risk — live.
Each spike in INVE has been met with selling near the upper $2.60s to $2.70s area, showing clear overhead supply. Buyers are there, but they’re not stampeding. This creates a textbook day-trading setup: range expansion, quick pops, and then fades back into the mid-range.
At the same time, the underlying fundamentals of INVE Technologies Inc. give a floor that many pure story stocks don’t have. A big cash balance and minimal debt often limit bankruptcy fears, which can embolden swing traders to hold through noise. But the ugly profit margins and negative operating cash flow remind serious traders that INVE is still a turnaround, not a victory lap.
Conclusion
INVE sits at an interesting crossroads for active traders. On one hand, the chart shows a stock slowly grinding higher from the low-$2.30s into the mid-$2.60s, with intraday bursts that reward nimble trading. On the other, the fundamentals reveal a company that has yet to prove it can convert that hefty cash pile into a consistently profitable operation.
For short-term players, INVE Technologies Inc. is all about levels. The $2.20s have acted as a support zone on the daily chart, while the $2.65–$2.75 band is emerging as a clear area of supply. Breaks above that zone with real volume could invite a momentum squeeze. Fails there, as we’ve seen on recent spikes, keep INVE locked in a choppy consolidation. That’s why having a process matters just as much as having a watchlist. As Tim Bohen, lead trainer with StocksToTrade says, “A consistent trading routine beats sporadic action every time. Show up daily, and you’ll start to see the patterns others miss.”
The balance sheet gives INVE time, but not a free pass. Revenue has been shrinking over the past three and five years, and negative free cash flow shows that burn is not just an accounting quirk. This is where trader discipline matters. As Tim Sykes loves to say, “Cut losses quickly, because small mistakes become big disasters when you let hope replace a trading plan.” For anyone studying INVE, the lesson is clear: respect the chart, respect the risk, and let price action — not emotion — lead the way.
This is stock news, not investment advice. StocksToTrade News delivers real-time stock market updates tailored to highlight the key catalysts driving short-term price movements. Our coverage is designed for active traders and investors who thrive in fast-moving markets, with a focus on volatile sectors like penny stocks, AI stocks, Robinhood stocks and other momentum plays. From earnings reports and FDA approvals to mergers, new contracts, and unusual trading volume, we break down the events that can spark significant price action.
Looking to level up your trading game? Explore StocksToTrade, the ultimate platform for traders. With powerful tools designed for swing and day trading, integrated news scanning, and even social media monitoring, StocksToTrade keeps you one step ahead.
Check out our quick startup guide for new traders!
- How to Read Stock Charts: A Guide for Beginners
- Trading Plan: 6 Steps to Create One
- How To Create a Stock Watchlist
Ready to build your watchlists? Check out these curated lists:
Once your watchlist is set, take the next step and trade with confidence using StocksToTrade’s robust platform. Don’t miss out — grab your 14-day trial for just $7 and experience the edge you need to thrive in today’s fast-paced markets.