Inter & Co. Inc. stocks have been trading down by -7.69 percent amid heightened concerns over its latest financial performance.
Click Here for a Millionaire's POV on Trading INTR
SUBSCRIBE FOR ALERTSJOIN 50,000+ ACTIVE TRADERS
Market Insights For Active Traders
- Weekly chart shows Inter & Co. Inc. consolidating between $5.27 and $5.88 after a brief push toward recent highs.
- Intraday action shows a sharp fade from the $5.80s to near $5.22, signaling aggressive selling into strength.
- Revenue near $8.4B with a low profit margin and negative recent growth keeps Inter & Co. Inc. firmly in turnaround territory.
- Valuation around 2x sales and roughly 1.2x book gives traders a defined fundamental floor to weigh against weak profitability.
- Capital structure shows high leverage, so price dips in INTR can move fast when risk sentiment shifts.
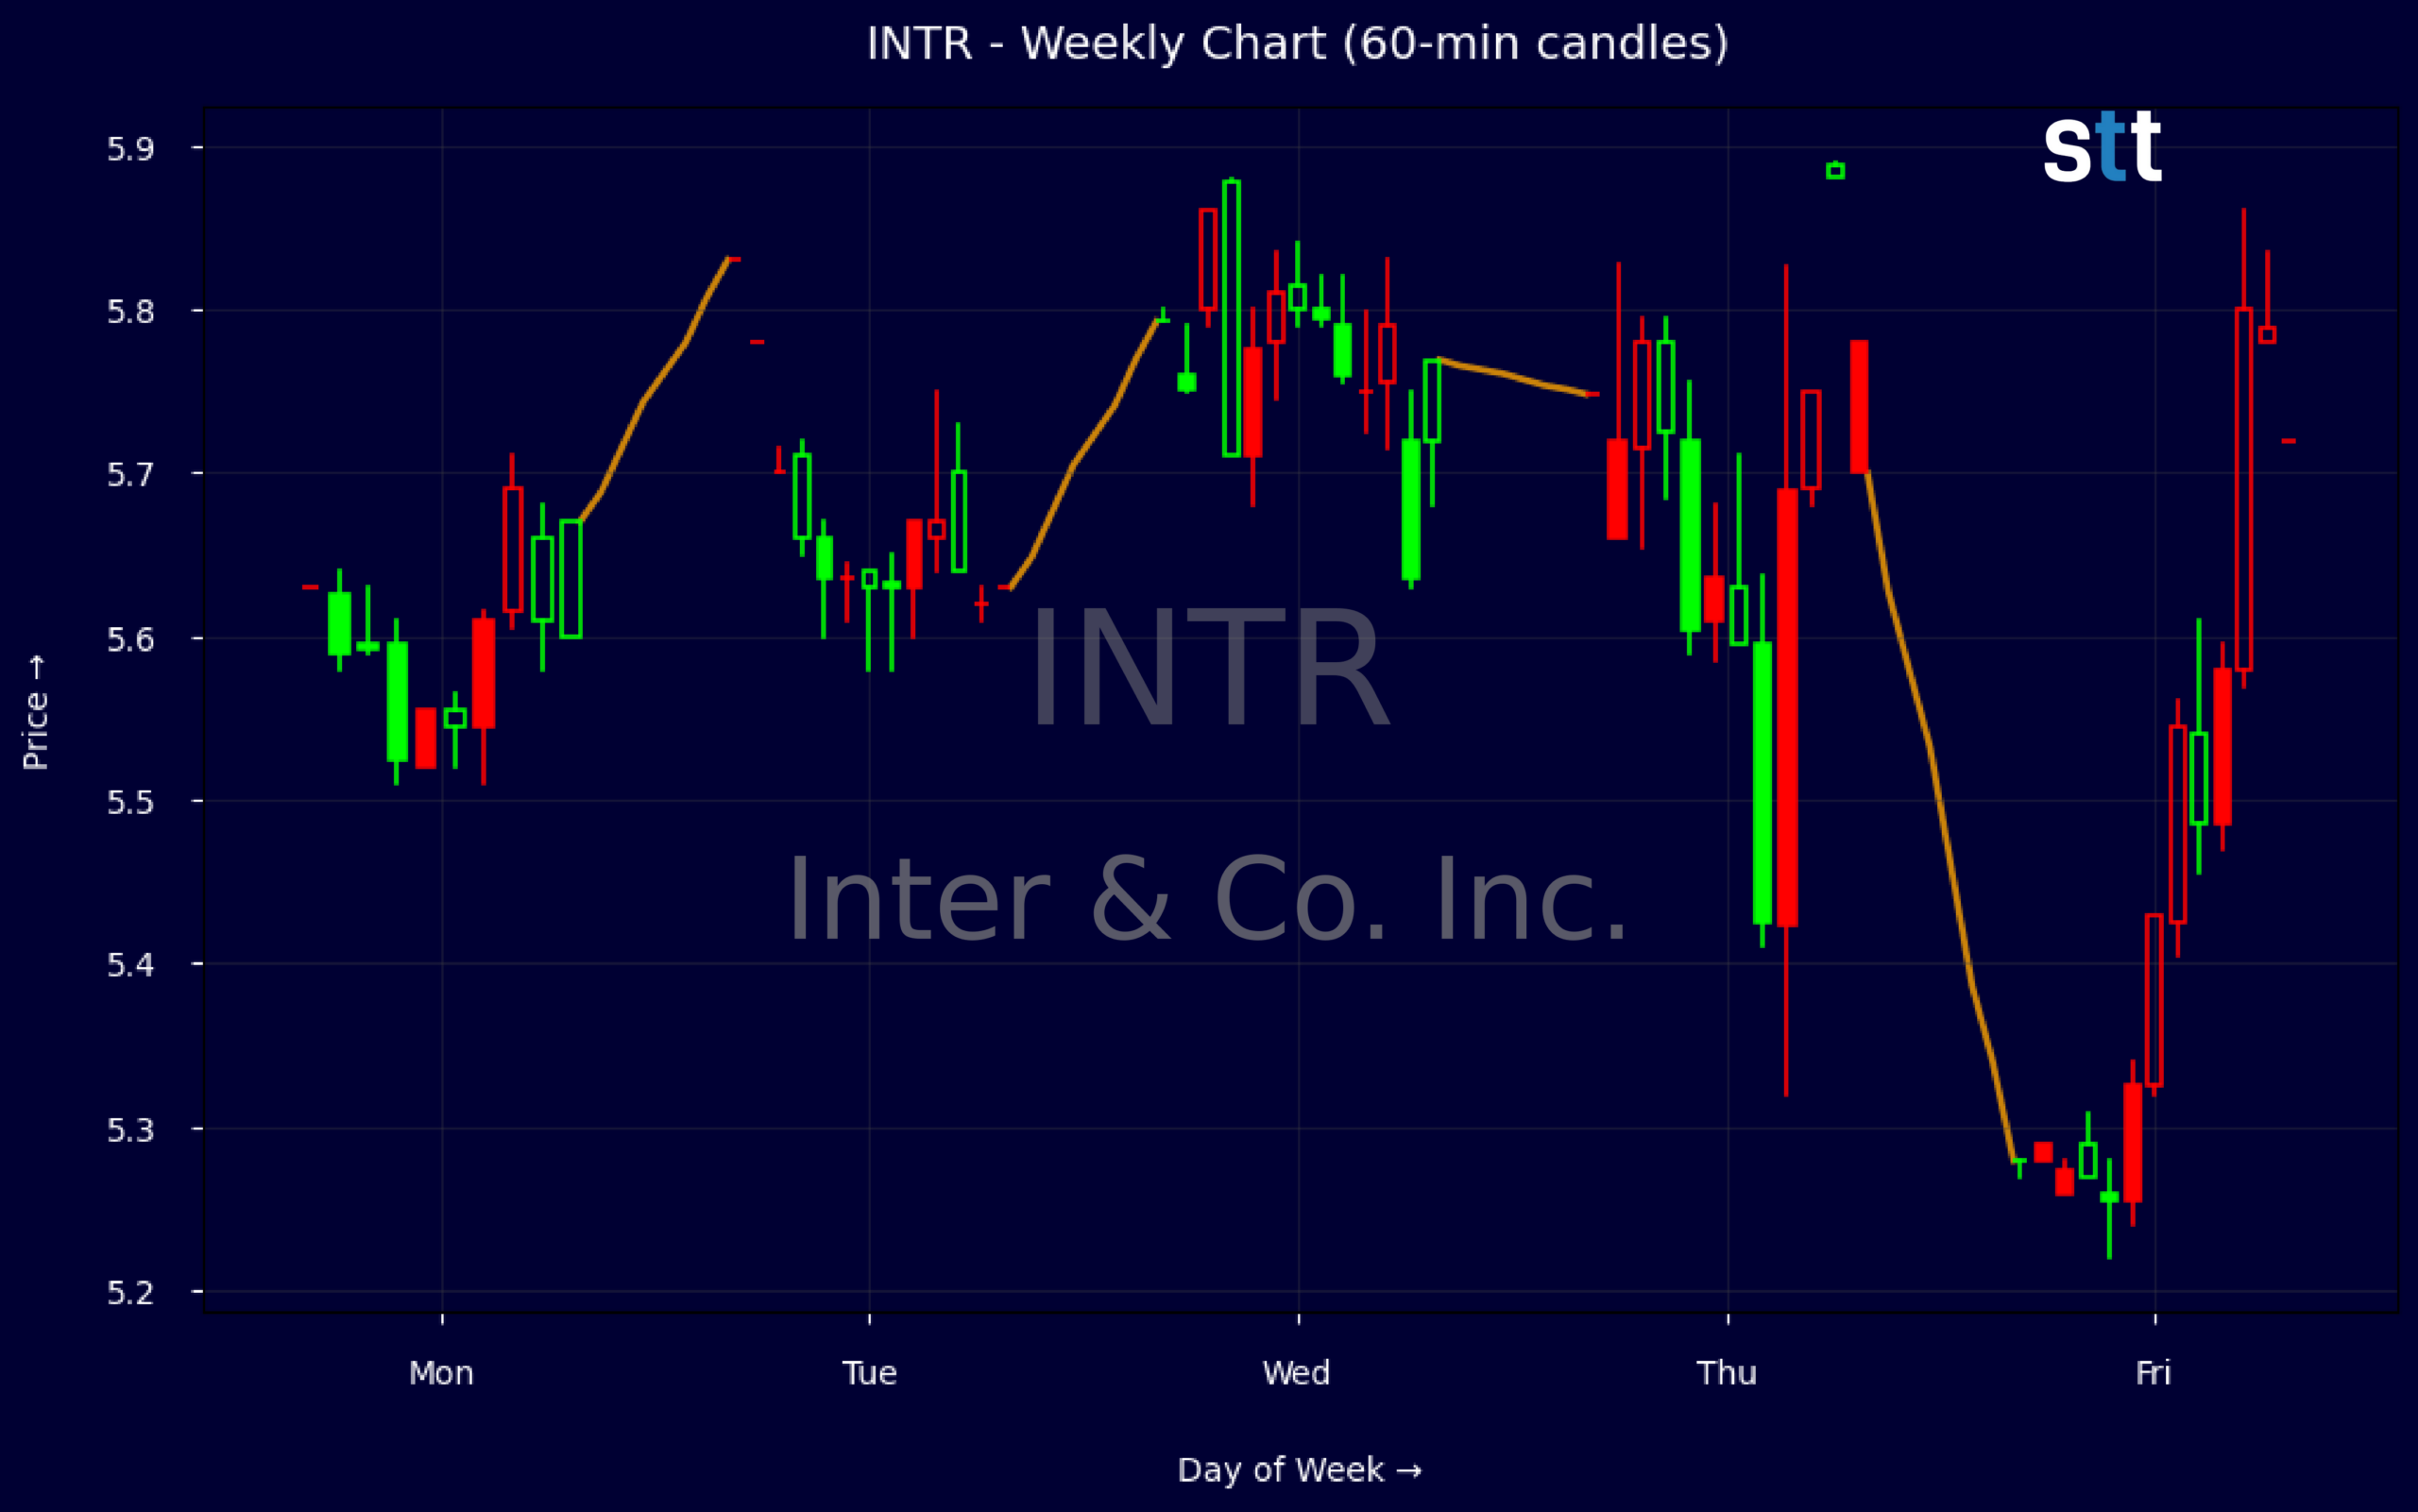
Weekly Update Aug 03 – Aug 07, 2026: On Sunday, August 09, 2026 Inter & Co. Inc. stock [NASDAQ: INTR] is trending down by -7.69%! Discover the key drivers behind this movement as well as our expert analysis in the detailed breakdown below.
Finance industry expert:
Analyst sentiment – negative
INTR’s fundamentals show a niche financial services and technology provider with modest profitability and a leveraged balance sheet. Pre-tax margin at -2.3% and ROIC of -1.2% signal operational inefficiencies despite positive ROE (8%) and minimal ROA (1%), implying heavy balance-sheet leverage (leverageratio 9.7x). Revenue of ~$8.4B with P/S of 1.98 and P/B of 1.17 indicate the stock is priced slightly above book but without growth (3- and 5-year revenue growth at -100%, likely post-transaction distortion). Equity of ~$10.2B against ~$98.6B assets and substantial current debt (~$15.4B) plus high accrued expenses (~$54.9B) underline funding and interest-rate sensitivity. Dividend yield of ~2.1% is modest but helps total return.
Technically, the stock shows short-term weakness. This week’s range from 5.63 to 5.88 with a close near 5.28 marks a clear breakdown from the 5.70–5.85 consolidation zone, confirming sellers in control. The sharp drop on 260807 after several tight-range days suggests a failed attempt to hold the 5.70 area, likely accompanied by rising downside volume. The dominant near-term trend is down; first actionable level is resistance at 5.75–5.80, where failed bounces are attractive short entries with tight stops above 5.90.
More Breaking News
- QXO Stock Slides As Traders Weigh Cash Burn And Debt
- SNDK Rallies As NAND Pricing And AI Hype Fuel Bull Run
- BMNR Stock Pullback Puts High-Risk Momentum Back In Play
- XLAB Stock Surges After $8.2M NVIDIA GPU Server Deal
With no fresh news as a catalyst, INTR trades primarily on sector sentiment and macro rates, underperforming stronger Finance and Banking benchmarks that exhibit better margins and growth. Its balance sheet scale and recurring revenue assets are positives, but weak profitability and leverage keep the equity in a value-trap zone. Near term, resistance is 5.75–5.80, support sits at 5.10–5.20. Base-case 6–12 month fair value is 5.50, below higher-quality peers; stance: underweight until margins and ROIC clearly improve.
Quick Financial Overview
Inter & Co. Inc. prints revenue of about $8.4B, but the pretax profit margin near -2.3% tells you the core business is still under pressure. That negative margin, combined with revenue trend metrics showing steep recent declines, frames INTR as a low-efficiency operator right now. For short-term traders, that usually means moves can be sharp around any shift in expectations, even if none is visible in the current data set.
Valuation is not stretched on classic multiples. A price-to-sales ratio around 1.98 and price-to-book near 1.17 place Inter & Co. Inc. in a modest valuation band for a financial name with $98.6B in assets. Book value per share sits around 23.04, well above the recent trading band near the mid-$5s, highlighting a deep discount to accounting equity. At the same time, a leverage ratio near 9.7 reminds traders that balance sheet size comes with material risk when margins are thin.
On the chart, the weekly candles show INTR hovering between roughly $5.27 and $5.88 after a short-lived push above $5.80. The key tell is the intraday 5-minute candle, where price opened near $5.81, briefly probed $5.86, then sold off hard to the low $5.20s before closing around $5.27. That pattern looks like a failed breakout and intraday reversal from resistance, which often precedes either a deeper pullback toward prior support or a prolonged consolidation while new buyers step in.
Conclusion
Inter & Co. Inc. presents a mixed picture that short-term traders know well: cheap-looking on basic valuation metrics, but with weak profitability and high leverage that can amplify swings. The discount of INTR’s market price in the mid-$5s versus book value above $23 per share suggests there is a wide gap between balance sheet value and what the market is willing to pay today. That gap usually closes only when margins improve or risk perceptions change.
From a trading standpoint, the recent failed push into the high $5.80s, followed by an intraday rejection down toward $5.22, marks that $5.80–$5.90 area as a clear resistance zone. On the downside, the $5.20–$5.30 band now acts as the key near-term support that traders will watch for either a breakdown or a base. As long as Inter & Co. Inc. sits between those levels, range-based strategies and tight risk control make more sense than directional bets. In choppy setups like this, many day traders remind themselves to stay grounded in what the tape is actually doing instead of guessing what it might do next. As Tim Bohen, lead trainer with StocksToTrade says, “I focus on momentum that’s visible right now. Speculation on future moves is outside my playbook.” That mindset pushes traders to react to clearly defined levels and actual price action, not to hopes about where the stock could go.
The financials of INTR tell you this is not a steady compounder; it is a leveraged, low-margin name where sentiment can flip fast. For active traders, that can mean opportunity if entries and exits are planned around clear technical lines and risk is sized conservatively. As I tell my students, “The edge is never in the story you want to believe about a stock; the edge is in what the price, volume, and numbers are actually telling you right now.”
This is stock news, not investment advice. StocksToTrade News delivers real-time stock market updates tailored to highlight the key catalysts driving short-term price movements. Our coverage is designed for active traders and investors who thrive in fast-moving markets, with a focus on volatile sectors like penny stocks, AI stocks, Robinhood stocks and other momentum plays. From earnings reports and FDA approvals to mergers, new contracts, and unusual trading volume, we break down the events that can spark significant price action.
Looking to level up your trading game? Explore StocksToTrade, the ultimate platform for traders. With powerful tools designed for swing and day trading, integrated news scanning, and even social media monitoring, StocksToTrade keeps you one step ahead.
Check out our quick startup guide for new traders!
- How to Read Stock Charts: A Guide for Beginners
- Trading Plan: 6 Steps to Create One
- How To Create a Stock Watchlist
Ready to build your watchlists? Check out these curated lists:
Once your watchlist is set, take the next step and trade with confidence using StocksToTrade’s robust platform. Don’t miss out — grab your 14-day trial for just $7 and experience the edge you need to thrive in today’s fast-paced markets.