
Inter & Co. Inc. stocks have been trading down by -7.69 percent amid negative sentiment from ## Ma’s most impactful headline.
Click Here for a Millionaire's POV on Trading INTR
SUBSCRIBE FOR ALERTSJOIN 50,000+ ACTIVE TRADERS
Market Insights For Active Traders
- Weekly chart shows a sharp drop from above $5.74 to near $5.28, signalling a quick sentiment shift and profit-taking.
- Intraday candle with a $5.86 high and $5.22 low highlights elevated volatility and possible stop runs around recent highs.
- Revenue of about $8.40B and price-to-sales near 2.15 place Inter & Co. Inc. in a steady, not distressed, valuation zone.
- High leverage (around 9.7x) and slightly negative pretax margin keep risk elevated despite positive return on equity.
- Dividend yield near 2.1% adds income, but short-term traders should still prioritise price action and risk control.
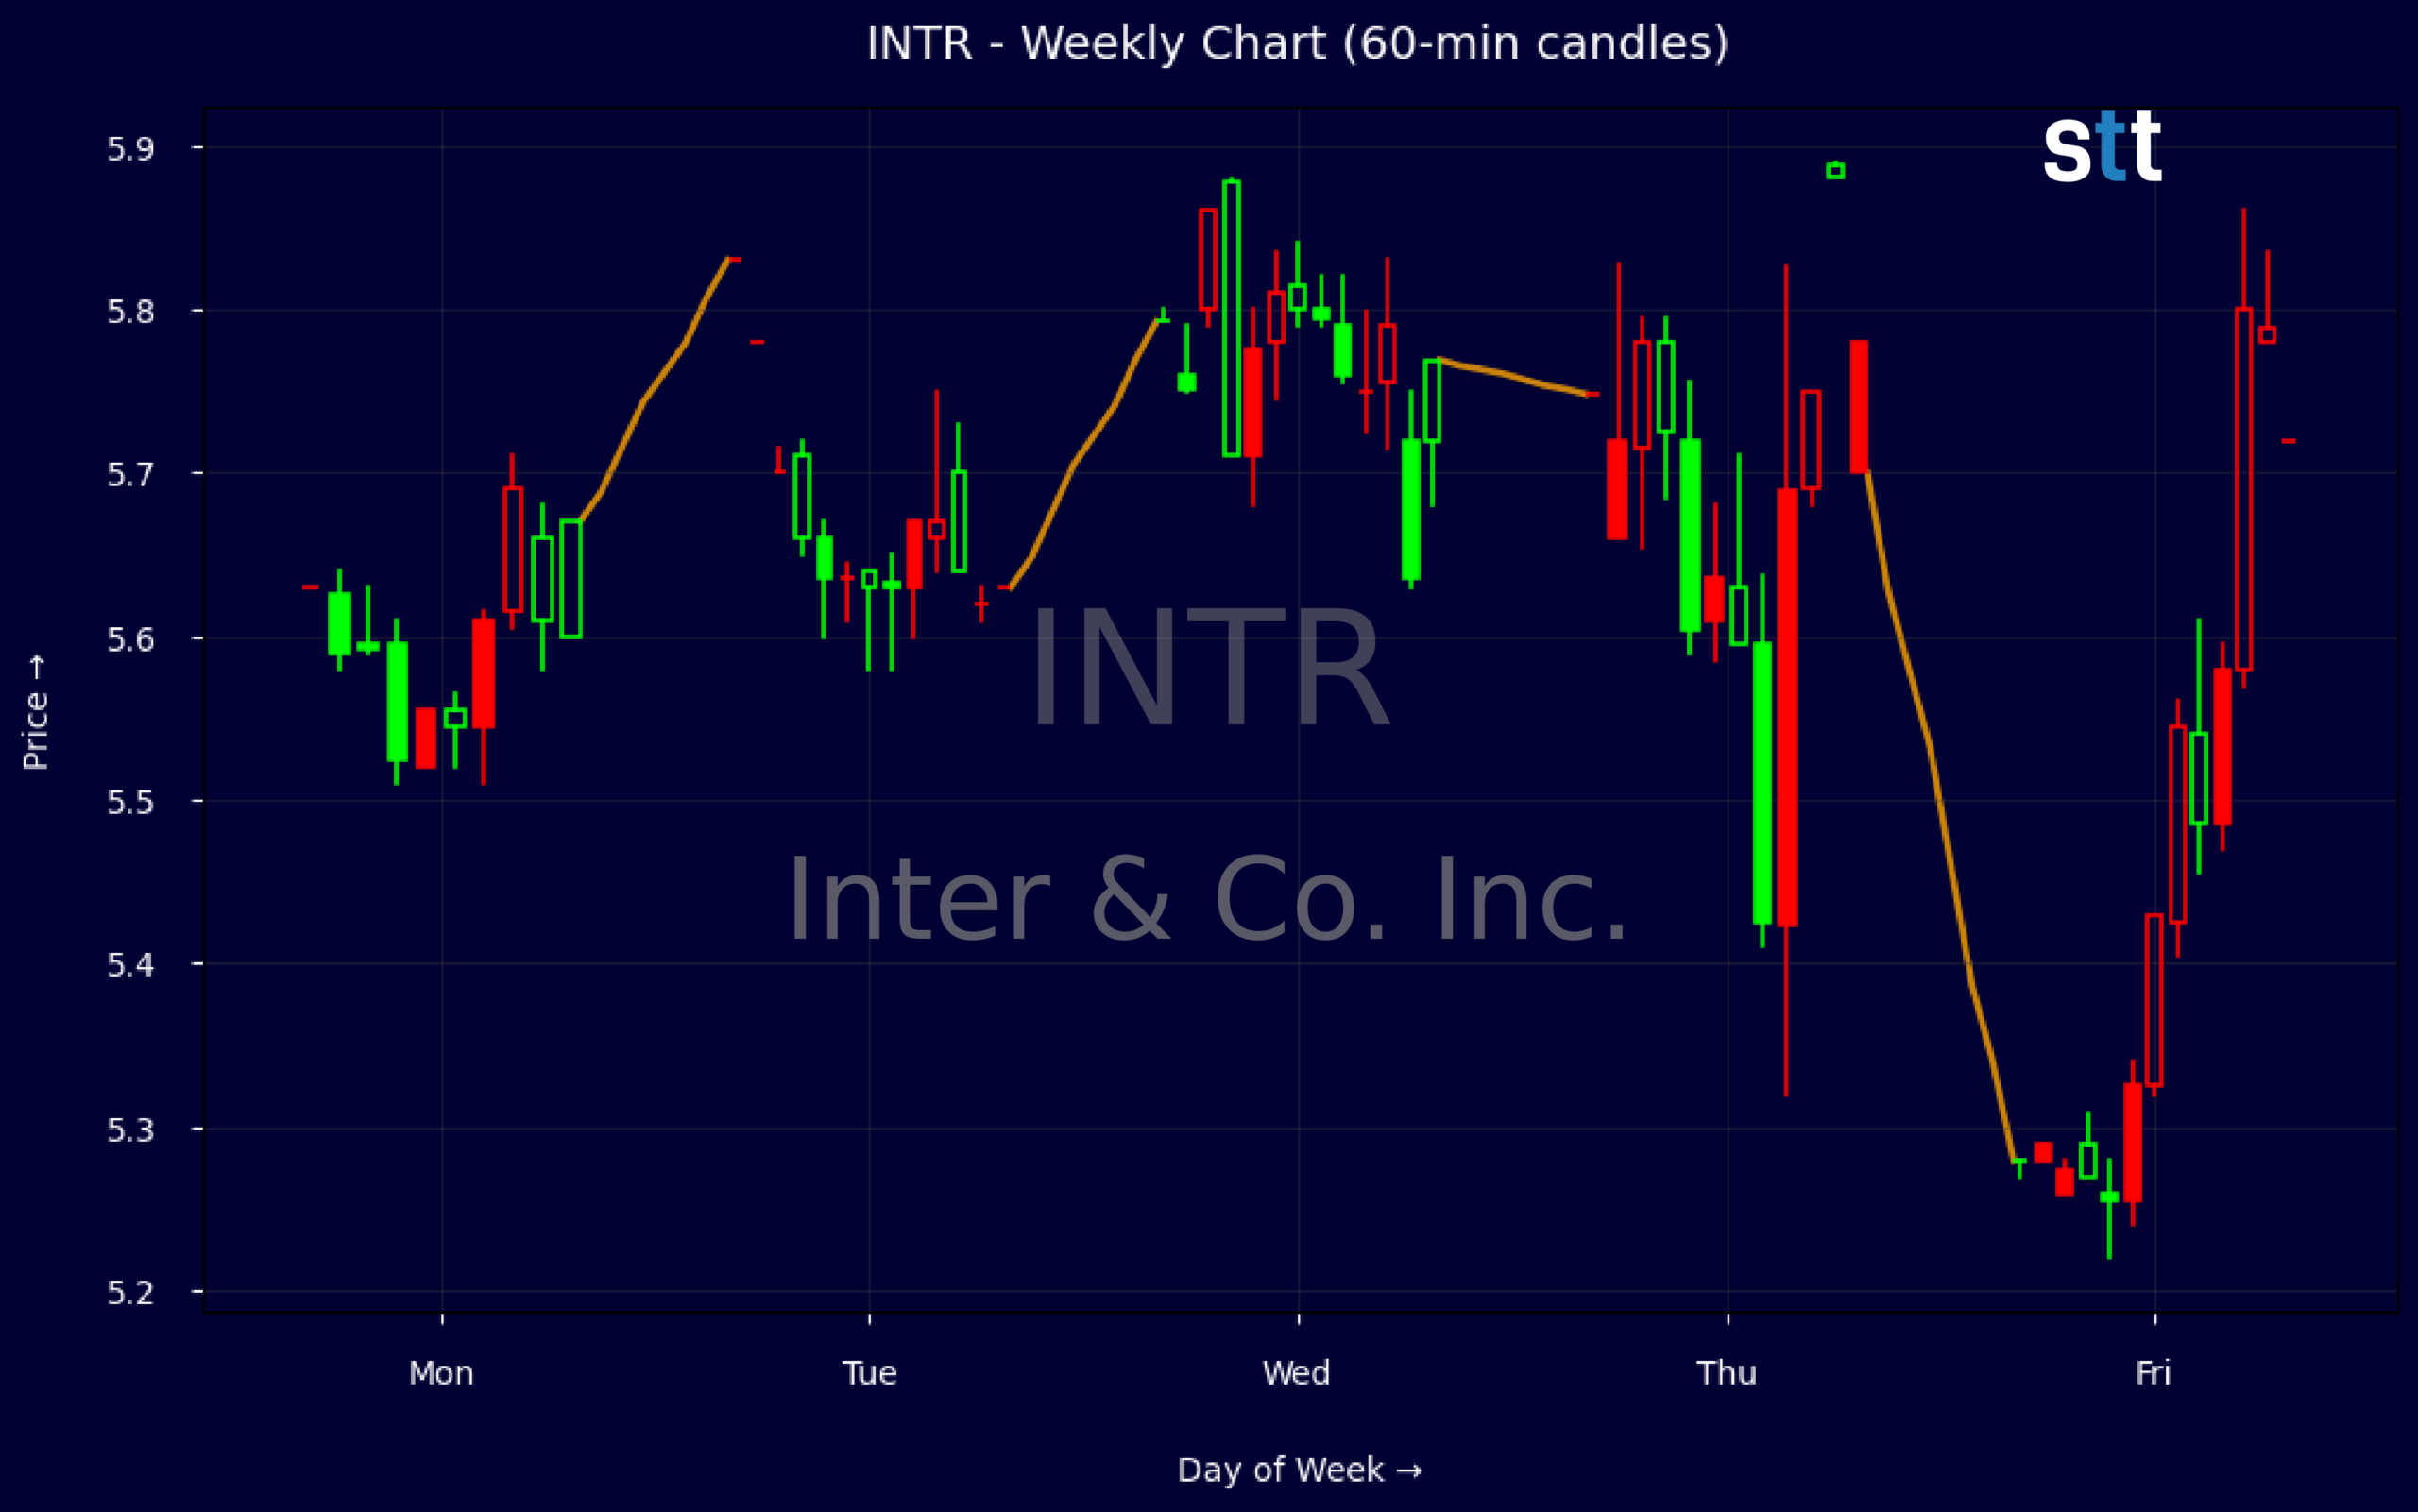
Weekly Update Aug 03 – Aug 07, 2026: On Saturday, August 08, 2026 Inter & Co. Inc. stock [NASDAQ: INTR] is trending down by -7.69%! Discover the key drivers behind this movement as well as our expert analysis in the detailed breakdown below.
Finance industry expert:
Analyst sentiment – negative
INTR sits as a niche financial services and technology player with modest profitability and a stretched efficiency profile. Revenue of ~$8.4B and price-to-sales of 2.15x imply a market assigning some franchise value despite a negative pre-tax margin (-2.3%) and weak ROIC (-1.2%). ROE near 8% and leverage ratio of 9.7 indicate a bank-like risk profile, but the balance sheet is asset-heavy, with substantial securities and loans plus high accrued expenses compressing flexibility.
Technically, the stock shows a clear short-term breakdown: a steady 5.7–5.8 consolidation early in the week collapsed to a 5.27–5.30 close, indicating sellers in control and a failed attempt to hold the 5.70 area. Intraday 5-minute candles confirm heavy supply near 5.75–5.80 and persistent lower highs. Dominant trend is down. Actionable level: 5.80 is a clean short entry zone with a tight stop above 5.95, targeting a retest of 5.20.
More Breaking News
- JBLU Stock Slides As Wall Street Slashes Price Targets
- EOG Resources Stock Climbs As Analysts Lift Price Targets Into Q3
- AXTI Stock Jumps As Traders Position Ahead Of Q3 Call
- SPCH Drops As Short-Term Momentum Weakens On Heavy Selling
With no fresh news, the stock trades primarily on relative value and technicals versus finance and banking peers. ROE and valuation trail high-quality bank benchmarks, while leverage is comparable, justifying a discount. Key resistance sits at 5.80–6.00; support is 5.10–5.20. Without a visible catalyst to reverse negative margins and subpar returns, risk/reward skews bearish. Fair value is closer to 4.75–5.00, and rallies toward 5.80 are selling opportunities.
Quick Financial Overview
Inter & Co. Inc. (INTR) shows mixed but tradable dynamics when you line up price action with the fundamentals. On the weekly tape, INTR pushed from $5.63 toward the $5.88 area before sliding to a $5.28 close, a clear rejection near the upper end of the recent range. That swing tells you buyers were active early in the week, but supply came in hard near the highs and forced a reset lower.
The intraday 5-minute bar reinforces this story. A session high near $5.86 and low around $5.22 is a wide range for a stock in this price zone, reflecting thin liquidity or aggressive orders hitting both sides. For short-term traders, those extremes mark important reference levels: strength above the $5.80s would signal reclaimed momentum, while a push under the low $5.20s would confirm further downside pressure.
On the fundamental side, Inter & Co. Inc. prints about $8.40B in revenue with a price-to-sales ratio close to 2.15, suggesting the market pays a moderate premium for its business. Book value per share near 23.04 versus the current mid-$5 price produces a price-to-book ratio around 1.27, leaving some cushion if earnings stay on track. The leverage ratio near 9.7 and slightly negative pretax margin (-2.3%) highlight balance-sheet and profitability risk, but return on equity of roughly 8% shows the company still generates reasonable value from capital. A roughly 2.1% dividend yield is a side benefit, not a trading catalyst.
Conclusion
Inter & Co. Inc. sits at an interesting crossroads for active traders. The recent weekly reversal from the high $5.70s toward $5.28 shows supply overwhelming demand at higher levels, while the intraday range between roughly $5.22 and $5.86 underlines how quickly sentiment can flip. When you see that kind of volatility around prior highs, you treat those zones as battle lines, not safe zones.
Financially, INTR’s $8.40B revenue base, mid-range valuation multiples, and positive return on equity offer a reasonable backdrop, but the high leverage and negative pretax margin keep this from being a low-risk name. The stock trading around one-quarter of book value suggests the market is already discounting some of that risk, creating room for sharp moves either way when sentiment shifts. Traders should map out the $5.20 support zone and the $5.80–$5.90 resistance band as key levels for potential breakouts or failed moves.
For short-term strategy, that means waiting for clean confirmations rather than guessing direction in the middle of the range. As I tell my students when they study setups like INTR, “Your edge doesn’t come from predicting the future; it comes from knowing your levels, respecting your risk, and only stepping in when the chart finally tips its hand.” That’s why discipline and patience are so critical when price is chopping around these key levels. As Tim Bohen, lead trainer with StocksToTrade says, “I focus on what a stock is doing, not what I want it to do. Let the stock prove itself before you make a move.”.
This is stock news, not investment advice. StocksToTrade News delivers real-time stock market updates tailored to highlight the key catalysts driving short-term price movements. Our coverage is designed for active traders and investors who thrive in fast-moving markets, with a focus on volatile sectors like penny stocks, AI stocks, Robinhood stocks and other momentum plays. From earnings reports and FDA approvals to mergers, new contracts, and unusual trading volume, we break down the events that can spark significant price action.
Looking to level up your trading game? Explore StocksToTrade, the ultimate platform for traders. With powerful tools designed for swing and day trading, integrated news scanning, and even social media monitoring, StocksToTrade keeps you one step ahead.
Check out our quick startup guide for new traders!
- How to Read Stock Charts: A Guide for Beginners
- Trading Plan: 6 Steps to Create One
- How To Create a Stock Watchlist
Ready to build your watchlists? Check out these curated lists:
Once your watchlist is set, take the next step and trade with confidence using StocksToTrade’s robust platform. Don’t miss out — grab your 14-day trial for just $7 and experience the edge you need to thrive in today’s fast-paced markets.