
Inter & Co. Inc. stocks have been trading down by -34.23 percent after weak earnings guidance signaled slowing digital-banking growth.
Click Here for a Millionaire's POV on Trading INTR
SUBSCRIBE FOR ALERTSJOIN 50,000+ ACTIVE TRADERS
Key Takeaways
- INTR has climbed from the low-$5s to the high-$7s this month, showing a steady multi-day uptrend that active traders track for momentum continuation.
- Inter & Co. Inc. posted roughly $8.4B in revenue with modest returns, signaling a growing but still efficiency-challenged banking platform.
- Valuation around 2.1x sales and 1.7x book keeps INTR in a middle zone — not dirt cheap, not wildly stretched.
- The balance sheet for Inter & Co. Inc. carries high leverage, typical of banks, which demands tighter risk management from traders during pullbacks.
- Intraday action in INTR near $5 shows back-and-forth range trading, giving short-term players multiple entries and exits around a tight band.
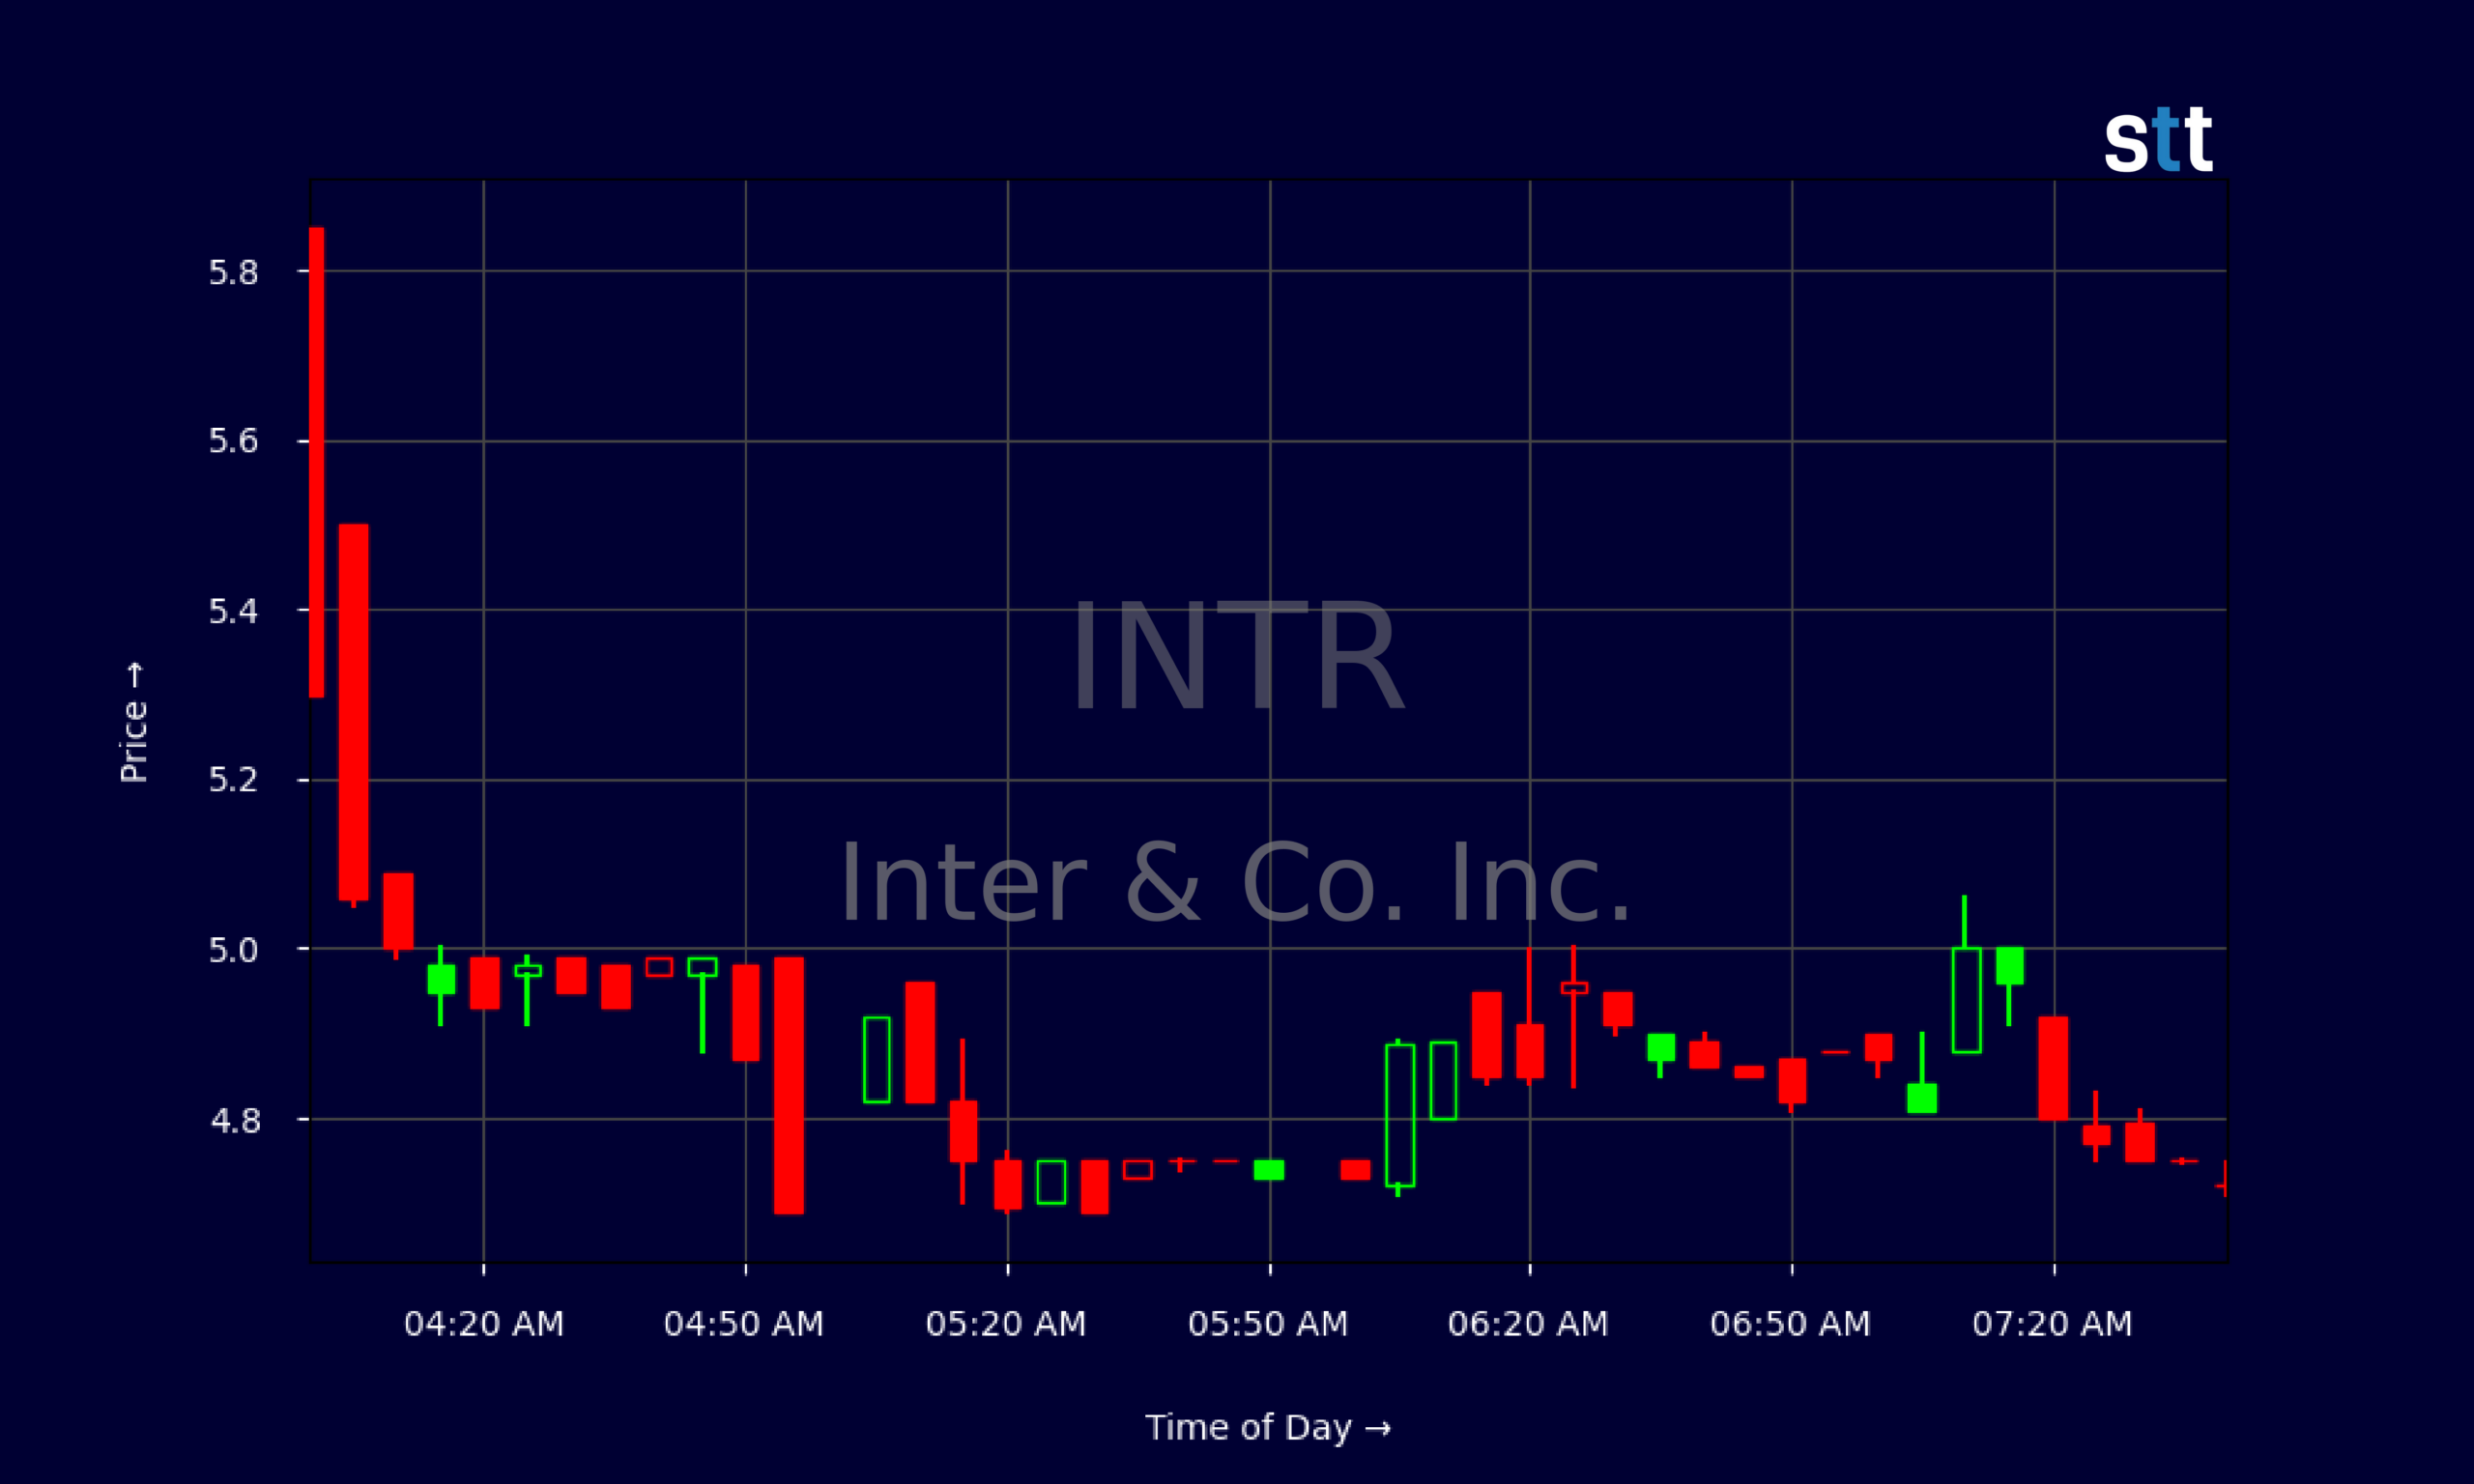
Live Update At 07:46:43 EDT: On Monday, October 26, 2026 Inter & Co. Inc. stock [NASDAQ: INTR] is trending down by -34.23%! Discover the key drivers behind this movement as well as our expert analysis in the detailed breakdown below.
Quick Financial Overview
Inter & Co. Inc., trading under ticker INTR, sits in an interesting spot fundamentally. The company delivered about $8.4B in revenue, which is solid top-line scale for a digital-focused financial platform. On a per-share basis, that is roughly $25.91 in revenue, yet the market prices INTR at around 2.1x sales and 1.7x book value. For a bank-style name, that suggests traders are paying a premium for growth and technology, not just a sleepy lending book.
Profitability is still mixed. Inter & Co. Inc. shows a small positive return on equity near 8%, but a slightly negative recent return on capital and a pretax margin of roughly -2.3%. That tells traders the franchise is still tightening its cost structure and risk profile. Leverage is high, with a ratio close to 9.7, which is normal for banks but amplifies macro shocks.
More Breaking News
- BBD Stock Slips On HSBC Downgrade And Cautious Target
- Weatherford International plc Rallies As Earnings Beat Fuels Bullish Targets
- SLM Stock Slides As Earnings Miss And Legal Risks Mount
- NOK Stock Pops On Q3 Beat And Aggressive Q4 Guidance
On the plus side, INTR carries over $11B in cash and equivalents and more than $45B in net loans, backed by nearly $99B in total assets. For traders, this setup screams “scalable platform still maturing” — not a broken story, but one that needs careful chart-based timing.
Why Traders Are Watching INTR Now
INTR’s chart is doing what smart traders love: clean, directional movement with defined levels. Over the recent series of daily candles, Inter & Co. Inc. rallied from about $5.30 at the start of the month to closes in the $7.00–$7.70 range, topping near $7.81 before pulling back slightly to $7.19. That is a serious percentage move in a short window, and it came with higher highs and higher lows — the classic uptrend structure.
For pattern traders, INTR shows a staircase: first leg from the mid-$5s to the mid-$6s, then a consolidation, then another push into the high-$7s. Each dip toward the 6.70–6.90 zone attracted buyers, signaling clear demand around that support band. When Inter & Co. Inc. pushed above $7.40 and then $7.70, breakout traders had multiple chances to lean into momentum with tight risk below prior highs.
Intraday, the 5‑minute data around the $4.70–$5.10 band shows a choppy range with repeated tests of $4.85–$5.00. For day traders, that kind of tight ping-pong between support and resistance is ideal for quick scalps. INTR opens strong near $5.85 in the premarket, washes down toward $5.30, then grinds with lower volatility — a textbook fade-then-stabilize pattern.
Tie that to the fundamentals, and the story sharpens. Inter & Co. Inc. is not a tiny speculative shell; it is a leveraged financial player with real revenue and assets, pricing like a growth bank. That attracts both momentum traders and mean-reversion players, all key for liquidity and range.
Conclusion
INTR sits at the crossroads of story and price action, which is exactly where active traders hunt. Inter & Co. Inc. shows strong revenue scale, a sizable loan book, and a digital banking profile that the market is willing to value above pure-book levels. At the same time, margins are thin, leverage is high, and returns are still normalizing — so this is not a “close your eyes and hold” type of name. It is a stock to trade.
On the chart, INTR’s climb from the low-$5s to the high-$7s puts recent buyers in control, but no uptrend is bulletproof. A break below the 6.70–6.90 support band would signal momentum is cooling, while a new push through the 7.70–7.80 range could open the door toward fresh highs. Inter & Co. Inc. will likely continue to trade in waves as the market reprices its growth and risk.
For traders using these moves as a live classroom, the mindset matters as much as the pattern. As Tim Bohen, lead trainer with StocksToTrade says, “A good trade setup checks all the boxes—volume, trend, catalyst. Don’t trade if you’re missing pieces of the puzzle.” That complements the psychological discipline needed in volatile names like this. As Tim Sykes loves to remind his students, “Cut losses quickly and never fall in love with a stock — price action is your best teacher.” INTR gives plenty of lessons right now, but as always, this is for education and research only, not a signal to buy or sell.
This is stock news, not investment advice. StocksToTrade News delivers real-time stock market updates tailored to highlight the key catalysts driving short-term price movements. Our coverage is designed for active traders and investors who thrive in fast-moving markets, with a focus on volatile sectors like penny stocks, AI stocks, Robinhood stocks and other momentum plays. From earnings reports and FDA approvals to mergers, new contracts, and unusual trading volume, we break down the events that can spark significant price action.
Looking to level up your trading game? Explore StocksToTrade, the ultimate platform for traders. With powerful tools designed for swing and day trading, integrated news scanning, and even social media monitoring, StocksToTrade keeps you one step ahead.
Check out our quick startup guide for new traders!
- How to Read Stock Charts: A Guide for Beginners
- Trading Plan: 6 Steps to Create One
- How To Create a Stock Watchlist
Ready to build your watchlists? Check out these curated lists:
Once your watchlist is set, take the next step and trade with confidence using StocksToTrade’s robust platform. Don’t miss out — grab your 14-day trial for just $7 and experience the edge you need to thrive in today’s fast-paced markets.