

Innventure Inc. stocks have been trading down by -55.0 percent amid sharply negative sentiment over its latest strategic partnership news.
What Traders Need To Know
- Innventure shares dropped over 44% in premarket trading after releasing Q2 financial results.
- The sharp premarket selloff suggests traders reacted negatively to Innventure’s latest quarterly update.
- Price collapsed from above $3 to the low $2s and then toward the mid-$1s in a few days, signaling intense selling pressure.
- Intraday trading showed a wide range and strong volatility, with the low near $1.51 before a weak bounce.
- Extremely negative margins and heavy cash burn underline why the market is repricing the risk in this name.
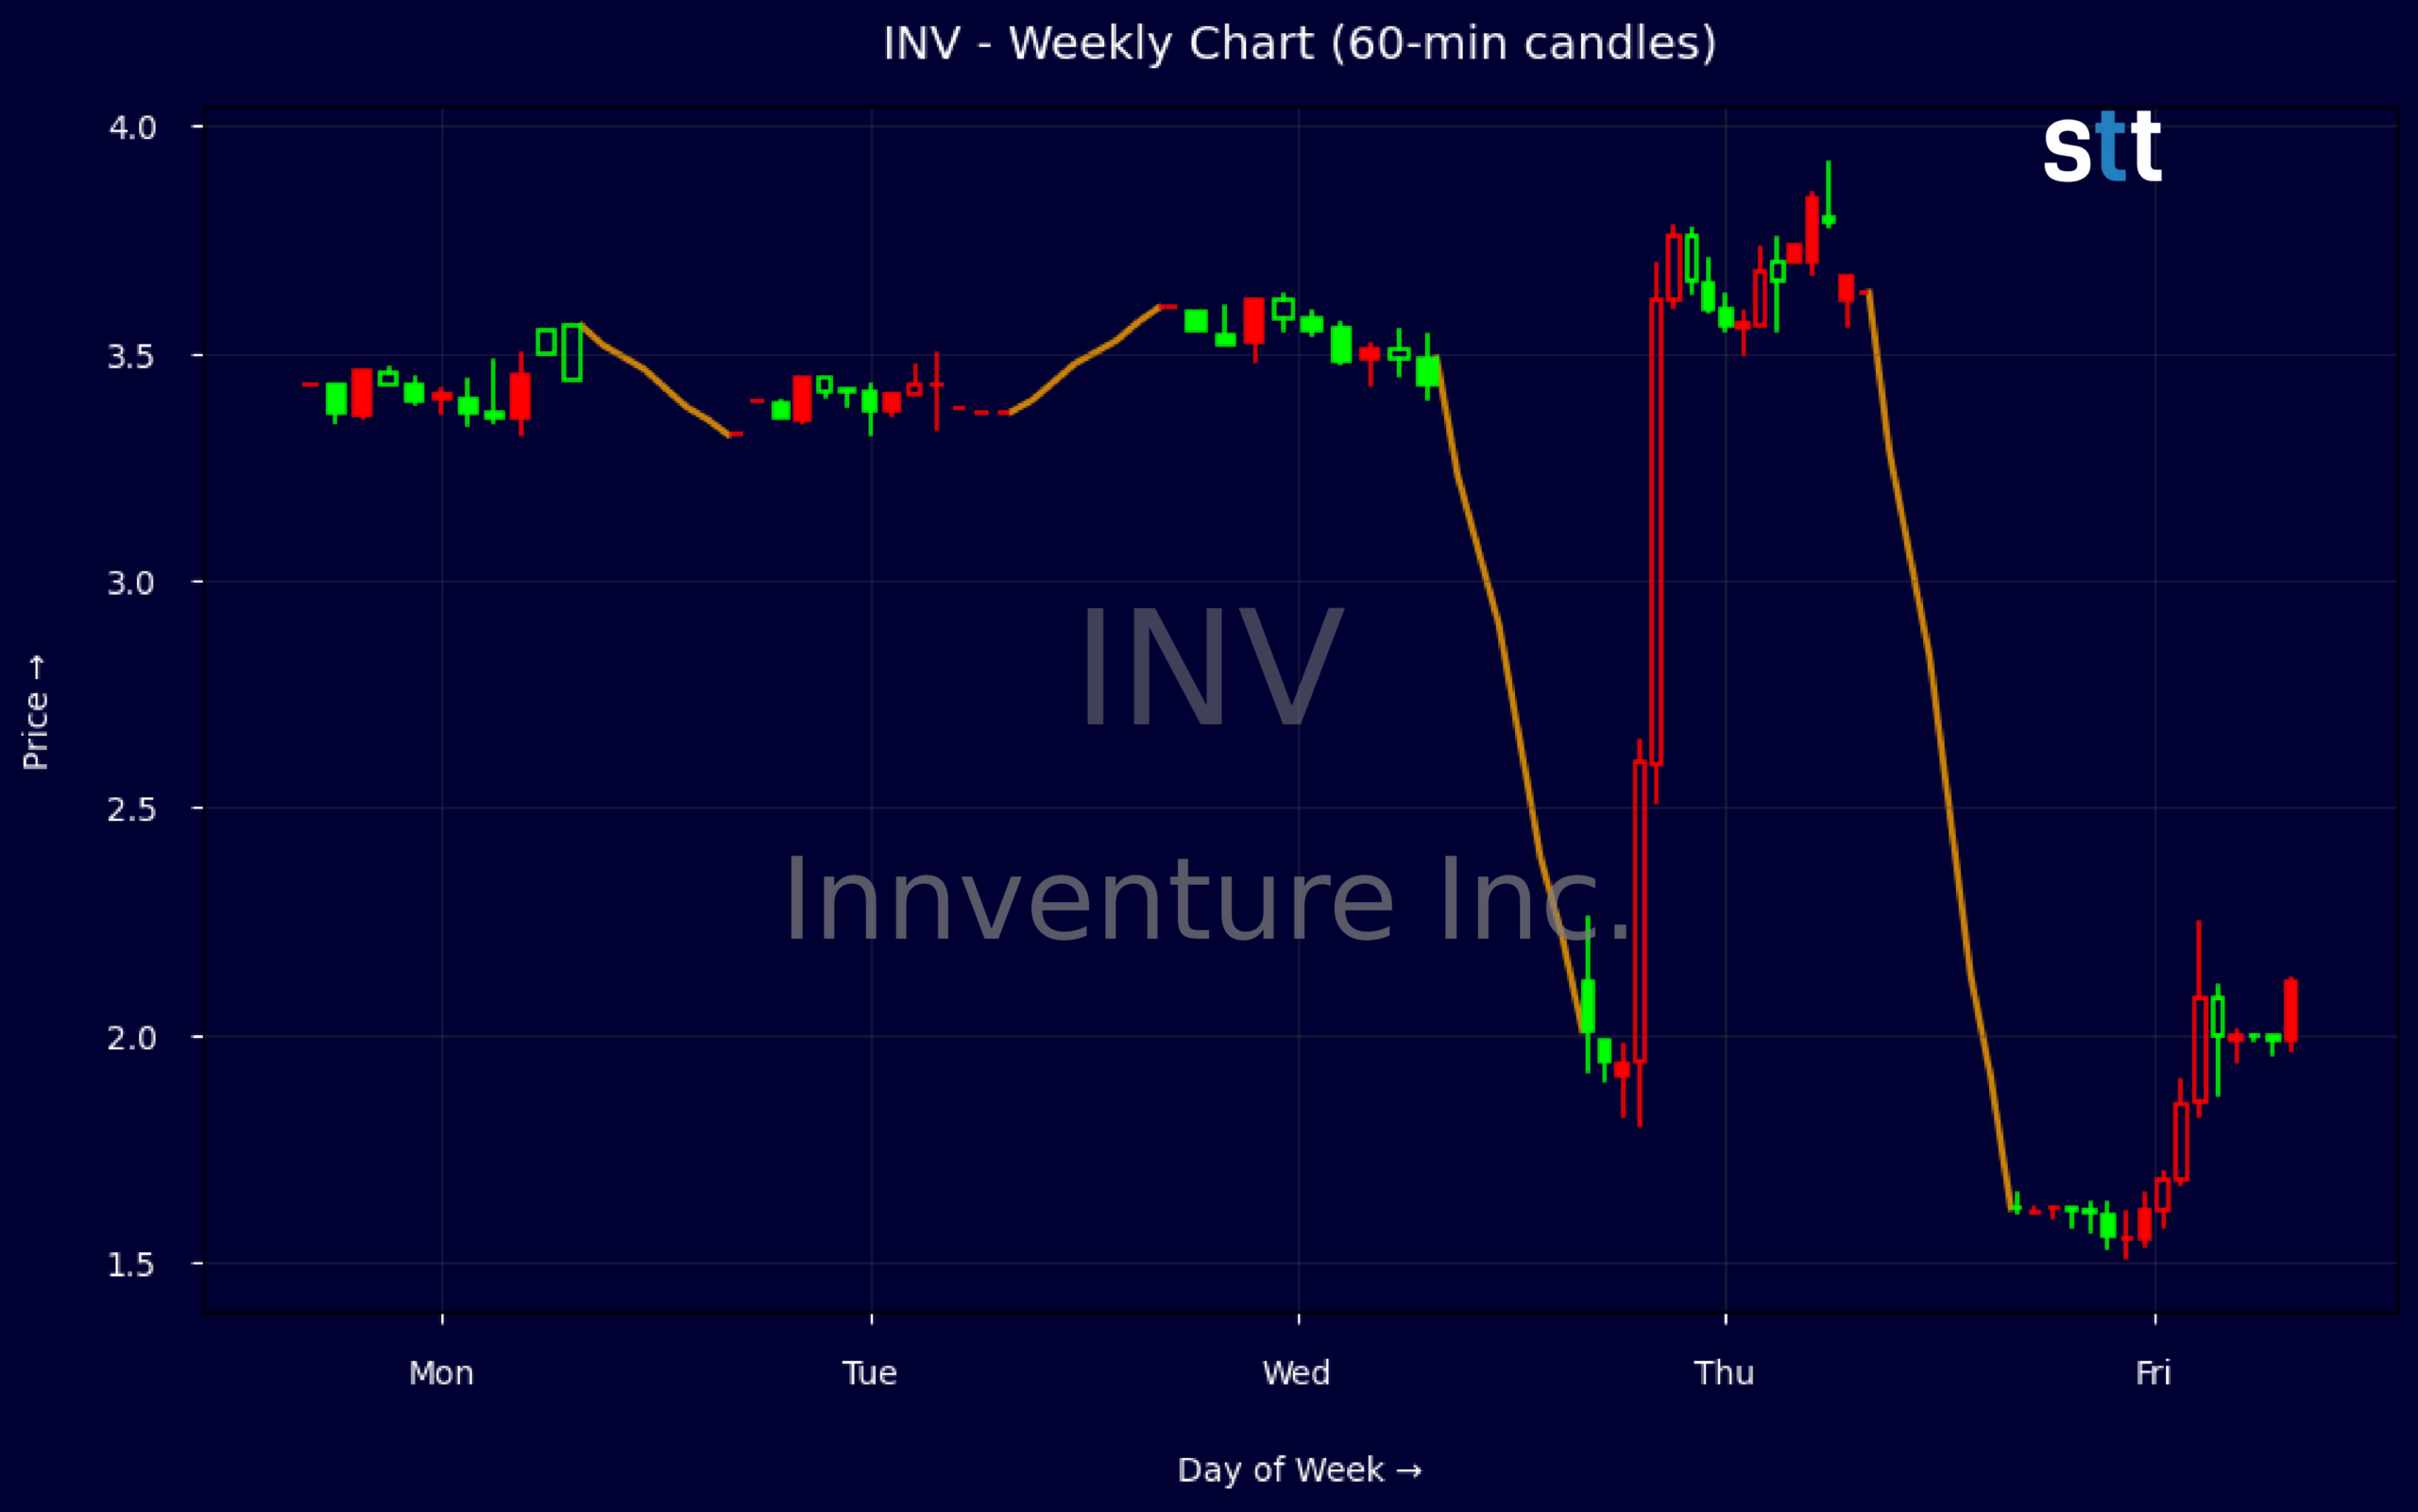
Weekly Update Aug 10 – Aug 14, 2026: On Sunday, August 16, 2026 Innventure Inc. stock [NASDAQ: INV] is trending down by -55.0%! Discover the key drivers behind this movement as well as our expert analysis in the detailed breakdown below.
Finance industry expert:
Analyst sentiment – negative
Innventure (INV) is an early-stage, loss-making platform with negligible revenue ($0.95M Q2 vs. $2.06M TTM) and extreme negative margins (EBIT margin roughly -7,800%, ROE about -70%). Cash burn is severe: Q2 operating cash flow was -$25.4M and free cash flow -$25.7M, funded primarily via equity issuance ($13.0M). The balance sheet shows modest leverage (total debt/equity 0.12, current ratio 1.4) but substantial accumulated deficits and heavy goodwill/intangibles concentration.
Technically, INV has shifted from a tight consolidation near $3.40–3.60 to a violent breakdown, with the weekly sequence showing a collapse from $3.60 to an intraday low of $1.58 and close at $1.62. That represents a drawdown of over 50% in days, consistent with capitulation selling on heavy volume post-earnings. Dominant trend is sharply bearish. The first actionable trading level is resistance near $2.10–2.25; failed retests there favor short setups with tight risk control.
More Breaking News
- NRXP Stock Builds Momentum As FDA Ketamine Catalyst Nears
- CareDx Stock Jumps As Earnings Beat And Guidance Surge Draw Trader Focus
- MPT Stock Slides As Traders Focus On Debt And Cash Flow
- MPT Stock Slides As Traders Weigh Debt, Dividend Risk
The 44% premarket drop following Q2 results underscores market concern about sustainability of Innventure’s model and dilution risk. Versus diversified Finance/Asset Management benchmarks, INV’s profitability, cash flow, and return metrics are dramatically worse, with none of the scale or fee-based stability typical of the sector. Near term, expect resistance at $2.10–2.25 and secondary resistance near $3.00; support is fragile near $1.50. Verdict: structurally speculative, skewed to downside until capital discipline and revenue traction improve.
Quick Financial Overview
Innventure Inc. (INV) triggered a major sentiment shift when Q2 results hit and the stock dropped more than 44% in premarket trading on 2026/08/14. The weekly tape shows price trading above $3 early in the week, then collapsing to roughly half that level by the end, closing around $1.62. That kind of vertical move down in INV signals forced selling, margin calls, and weak bids, all of which create a high-risk, high-volatility environment for short-term traders.
The intraday 5‑minute candle highlights how violent the session was. The stock opened just over $2, pushed briefly above $2.17, then flushed hard to about $1.51 before settling near $1.615. For traders, that wide range inside a single candle means liquidity is thin and stops must be respected. This type of action often leads to sharp dead‑cat bounces, but also to continued grind lower if sellers stay in control.
Financially, Innventure Inc. is early‑stage and highly unprofitable. Revenue for the quarter sits near $2.1M, but margins are deeply negative at every level, and return metrics such as return on equity and return on assets are sharply below zero. Cash flow is a key concern: operating cash flow is about -$25.4M and free cash flow about -$25.7M, funded largely by issuing roughly $13M in stock. While the balance sheet shows meaningful assets and modest debt with a current ratio around 1.4, the high price‑to‑sales multiple above 40 and ongoing heavy burn explain why traders hammered the stock after Q2.
Conclusion
Innventure Inc. (INV) now trades in a very different landscape after the Q2 release triggered a more than 44% premarket collapse and a slide from the $3 area into the mid-$1s. The chart tells traders that prior support levels were wiped out quickly, with the intraday low near $1.51 now the first downside reference and the $2 area above acting as a likely overhang. When a stock reprices this fast, it often takes time for a new trading range to form.
On the fundamental side, INV is still a high-burn, low-revenue story with extremely negative margins and heavy dependence on external funding. The balance sheet is not broken, but the income statement and cash flow profile show why the market is demanding a much lower price. For short-term traders, the main edge here is volatility, not quality. This is a textbook “speculative only” zone where strict risk controls matter more than any long-term story. As I tell my students, “Your job is not to predict the hero turnaround; your job is to trade the volatility with a plan, tight risk, and zero attachment.” As Tim Bohen, lead trainer with StocksToTrade says, “If you’re still guessing at the end of your analysis, it’s probably not a trade worth taking.” That mindset is critical when approaching Innventure Inc. after a shock move like this.
This is stock news, not investment advice. StocksToTrade News delivers real-time stock market updates tailored to highlight the key catalysts driving short-term price movements. Our coverage is designed for active traders and investors who thrive in fast-moving markets, with a focus on volatile sectors like penny stocks, AI stocks, Robinhood stocks and other momentum plays. From earnings reports and FDA approvals to mergers, new contracts, and unusual trading volume, we break down the events that can spark significant price action.
Looking to level up your trading game? Explore StocksToTrade, the ultimate platform for traders. With powerful tools designed for swing and day trading, integrated news scanning, and even social media monitoring, StocksToTrade keeps you one step ahead.
Check out our quick startup guide for new traders!
- How to Read Stock Charts: A Guide for Beginners
- Trading Plan: 6 Steps to Create One
- How To Create a Stock Watchlist
Ready to build your watchlists? Check out these curated lists:
Once your watchlist is set, take the next step and trade with confidence using StocksToTrade’s robust platform. Don’t miss out — grab your 14-day trial for just $7 and experience the edge you need to thrive in today’s fast-paced markets.