

Infleqtion Inc. stocks have been trading down by -10.07 percent after reports of delayed quantum product launches spooked investors.
Key Takeaways
- INFQ has pulled back from an $18 premarket push to close near $15.98, signaling a sharp intraday fade after early strength.
- Recent daily candles show Infleqtion Inc. swinging between $10 and $18, creating a high-volatility trading environment.
- Financials reveal negative earnings and heavy operating losses, but INFQ holds more than $440M in cash and short-term investments.
- Infleqtion Inc. generates modest revenue relative to expenses, so traders are treating INFQ as a speculative, story-driven name.
- Tight intraday consolidation around $16 suggests short-term balance as traders wait for the next momentum leg.
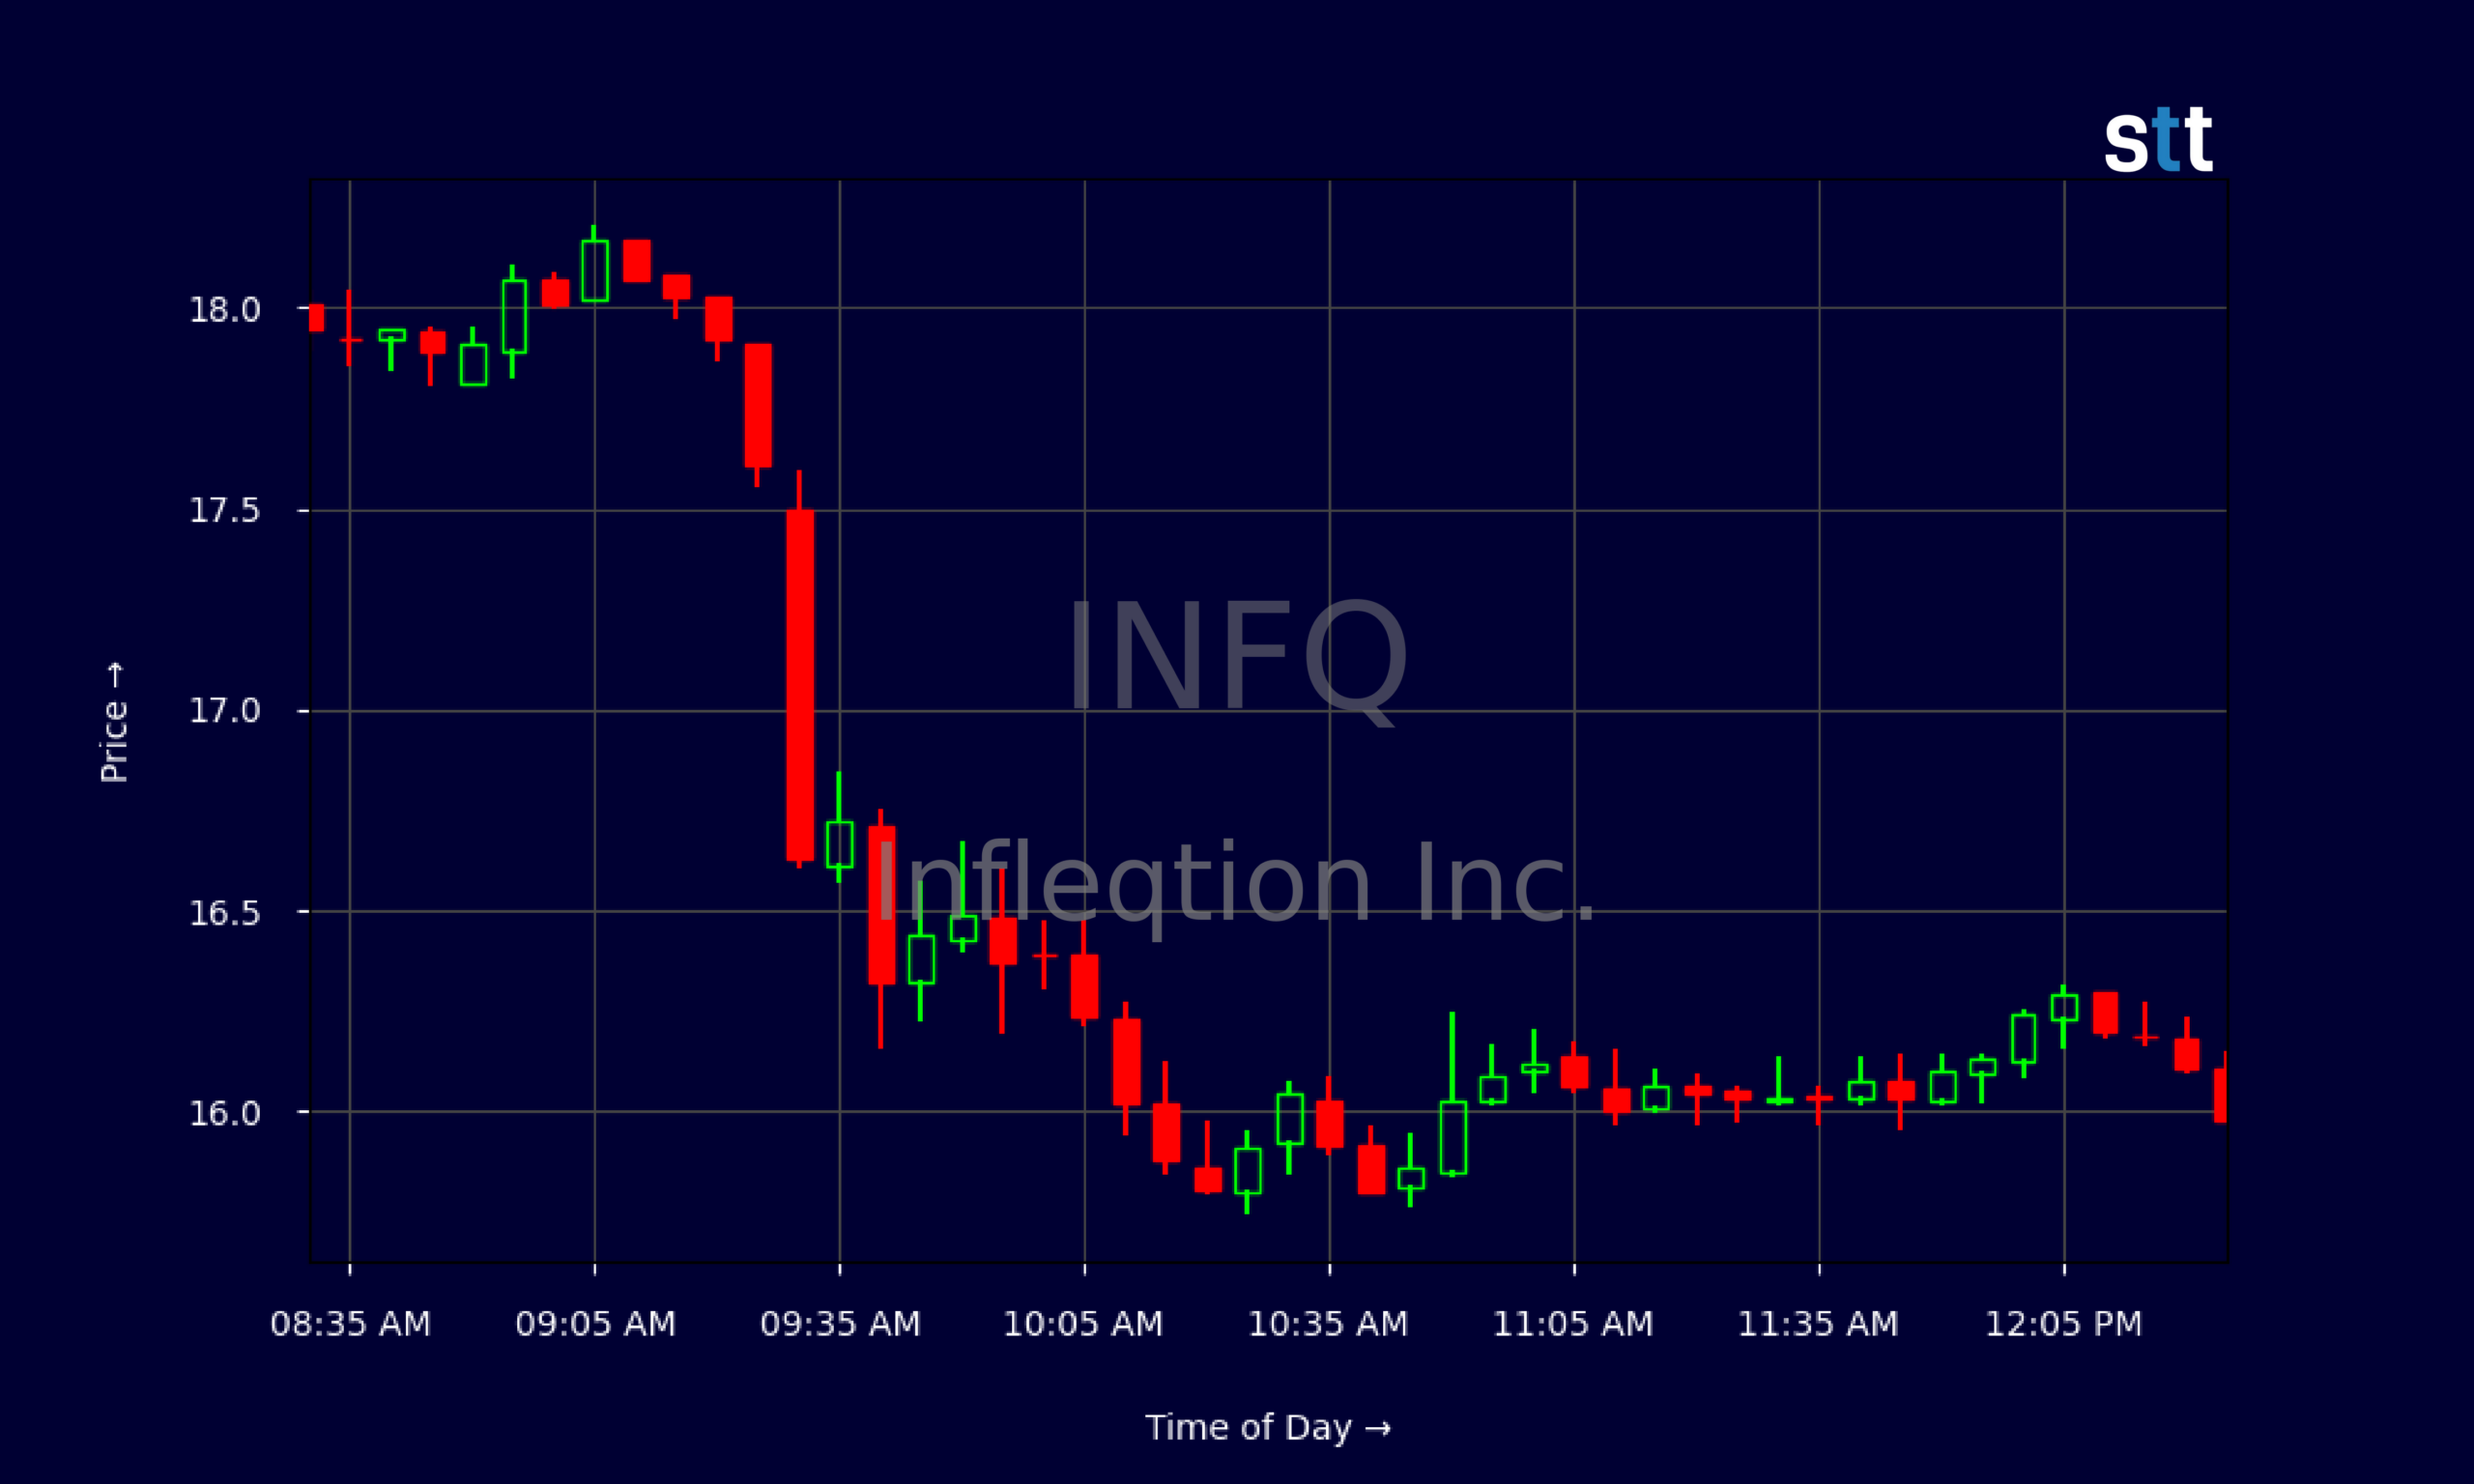
Live Update At 12:32:54 EDT: On Friday, May 29, 2026 Infleqtion Inc. stock [NYSE: INFQ] is trending down by -10.07%! Discover the key drivers behind this movement as well as our expert analysis in the detailed breakdown below.
Quick Financial Overview
INFQ is trading like a classic high-risk, high-reward story stock. On the surface, the numbers for Infleqtion Inc. look rough. The latest quarter shows total revenue of about $9.5M against total expenses of roughly $43.7M, leading to a net loss near $30M and a basic EPS of -$0.26. That is not a cash machine. It is a burn story.
But look deeper and traders see why INFQ still commands attention. Infleqtion Inc. holds around $443.5M in cash, cash equivalents, and short-term investments, plus total assets above $612M. Total liabilities sit near $27.4M, with long-term debt only about $3.8M. Working capital is massive at roughly $441.3M. In plain English, INFQ is losing money now, but it has a big financial cushion.
More Breaking News
- JDZG Stock Plunges As Volatility Grips Thinly Traded Name
- BMNR Stock Pulls Back As Traders Gauge Risk
- NCPL Stock Holds Key Levels As Traders Study Volatile Chart
- SNDG ETF Slides As Volatility Tests Momentum Traders
Return on assets is negative at roughly -15.75%, reinforcing that Infleqtion Inc. is not yet efficient. Valuation ratios are messy, with negative book value per share and odd-looking price-to-book metrics. For traders, that combination — strong cash, heavy losses, and unclear valuation — sets the stage for big swings as sentiment shifts.
Why Traders Are Watching INFQ Price Action
INFQ price action has been wild over the past couple of weeks, and that is exactly what active traders look for. On the daily chart, Infleqtion Inc. ran from about $10.63 on 2026/05/19 to highs above $18 on 2026/05/22. That is a near-double in days, followed by heavy back-and-forth action around the mid-teens.
The latest daily candle shows INFQ opening at $17.50, tagging $17.59, then selling down to $15.75 and closing at $15.98. That is a clear intraday fade from early strength, which often signals profit-taking by traders who caught the prior run. At the same time, the low held above key prior support near $15.50–$15.70, keeping Infleqtion Inc. in a broader consolidation zone.
Zoom into the intraday 5-minute chart and the story tightens. Premarket trading saw INFQ hovering around $18, then the regular session opened with a flush from $17.50 into the mid-$16s. After the open, price action for Infleqtion Inc. spent hours grinding sideways between roughly $15.80 and $16.30, with shallow bounces and controlled dips. Volume-driven spikes faded quickly, but sellers also failed to break the lows decisively.
For active traders, that type of range tells you the market is negotiating a new fair value. Momentum players in INFQ now focus on a break above the intraday $16.30–$16.40 band for a potential push back toward $17, while a decisive crack below $15.75 opens room toward the mid-$14s support from recent sessions. Until then, Infleqtion Inc. looks like a day-trading playground rather than a clean trend.
Conclusion
INFQ sits at an interesting crossroads. Infleqtion Inc. has real revenue, but losses are large and sustained. The company spent over $9.9M on research and roughly $26.3M on general and administrative costs in the quarter, while generating less than $10M in sales. That imbalance keeps pressure on earnings and explains the negative profitability metrics.
At the same time, Infleqtion Inc. is not boxed in financially. With over $443M in cash and short-term investments and relatively low debt, INFQ has runway to keep executing its growth and research plans. The cash burn from operations, around -$19.2M for the quarter, matters, but it does not signal an immediate liquidity crunch. That is why traders still crowd the name despite the red ink.
For short-term trading, the chart is the main guide. Recent wide ranges and intraday consolidation zones tell you INFQ can move fast when momentum returns. Discipline matters here. As Tim Sykes likes to say, “Cut losses quickly, because holding and hoping is not a strategy.” And as Tim Bohen, lead trainer with StocksToTrade says, “Time and experience have taught me that missed opportunities are part of the game. There’s always another setup around the corner.” Taken together, these trading principles highlight that patience and risk management are critical when dealing with volatile names like INFQ. Traders watching Infleqtion Inc. should map their levels, size small relative to the volatility, and treat every entry as a trade, not a long-term commitment. This is educational, research-driven analysis of INFQ price action — not advice to buy or sell.
This is stock news, not investment advice. StocksToTrade News delivers real-time stock market updates tailored to highlight the key catalysts driving short-term price movements. Our coverage is designed for active traders and investors who thrive in fast-moving markets, with a focus on volatile sectors like penny stocks, AI stocks, Robinhood stocks and other momentum plays. From earnings reports and FDA approvals to mergers, new contracts, and unusual trading volume, we break down the events that can spark significant price action.
Looking to level up your trading game? Explore StocksToTrade, the ultimate platform for traders. With powerful tools designed for swing and day trading, integrated news scanning, and even social media monitoring, StocksToTrade keeps you one step ahead.
Check out our quick startup guide for new traders!
- How to Read Stock Charts: A Guide for Beginners
- Trading Plan: 6 Steps to Create One
- How To Create a Stock Watchlist
Ready to build your watchlists? Check out these curated lists:
Once your watchlist is set, take the next step and trade with confidence using StocksToTrade’s robust platform. Don’t miss out — grab your 14-day trial for just $7 and experience the edge you need to thrive in today’s fast-paced markets.