
Harmonic Inc. stocks have been trading down by -9.59 percent amid heightened concern over its weakening video infrastructure demand.
Market Insights For Harmonic Inc. Traders
- Price has dropped from the upper $17s to the mid-$15s, signaling a sharp near-term pullback.
- Intraday action shows a hard flush from the mid-$16s into the high-$14s before stabilizing.
- Profitability metrics are mixed, with solid gross margin but negative net margin.
- Balance sheet liquidity and low leverage give Harmonic Inc. room to manage volatility.
- Traders are focusing on whether current support levels can hold after this fast decline.
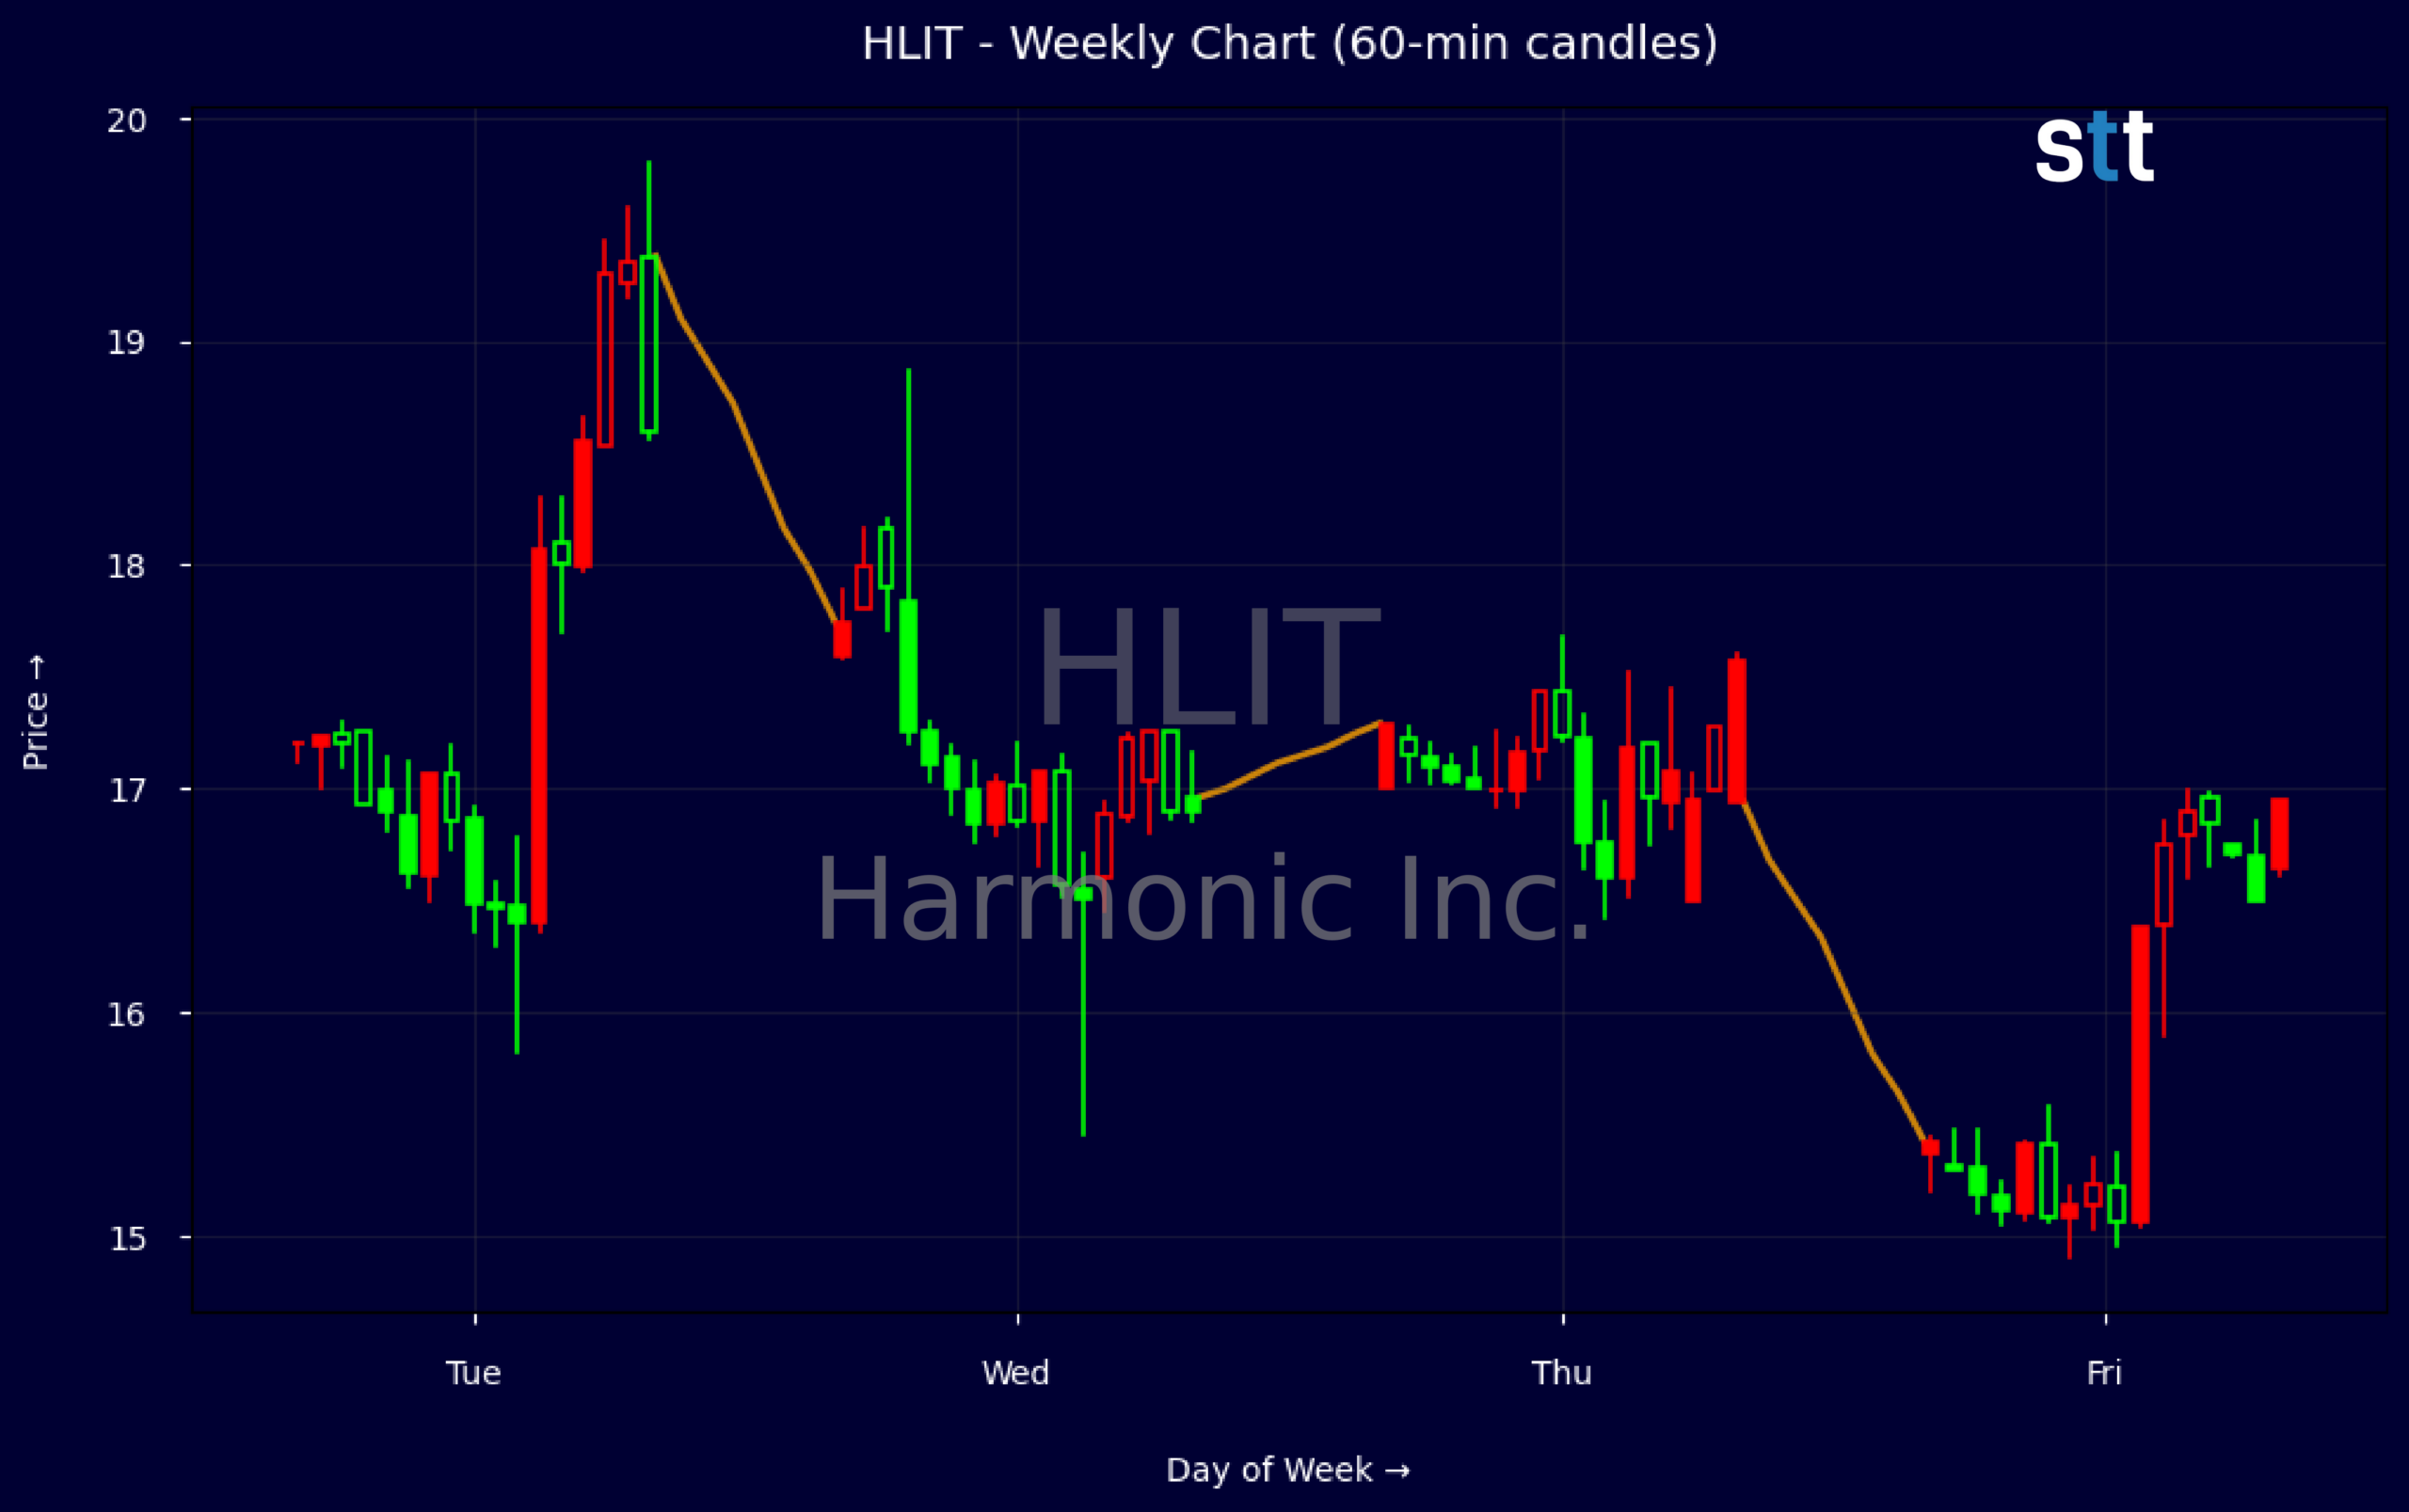
Weekly Update May 25 – May 29, 2026: On Sunday, May 31, 2026 Harmonic Inc. stock [NASDAQ: HLIT] is trending down by -9.59%! Discover the key drivers behind this movement as well as our expert analysis in the detailed breakdown below.
Technology industry expert:
Analyst sentiment – neutral
Harmonic (HLIT) sits in a niche but strategically important position in broadband access and video infrastructure, with fundamentals showing a mixed picture. Revenue of ~$361M is in decline (–18% three-year CAGR), yet gross margin is robust at 45.8% and Q1’26 EBIT margin turned positive (~15%) with ~$20.6M EBITDA, indicating improving operating leverage. Balance sheet quality is solid: current ratio 2.3, modest leverage (total debt/equity 0.37), and strong free cash flow (~$30M) supporting aggressive buybacks.
Technically, HLIT is in a corrective phase after a prior advance. Weekly data show a breakdown from the high $17s to mid-$15s, with lower highs and lower lows, confirming a short-term downtrend. Intraday 5-minute candles recently showed heavy selling pressure on pushes above $17 with increased volume, and stabilizing demand around $15–15.25. The actionable trading level is $15: a decisive close below on above-average volume opens downside to $13.50, while sustained buying above $16.80 would signal trend repair.
More Breaking News
- MPT Stock Slides As Traders Weigh Debt, Dividend Risk
- MRVL Stock Tests Support As Growth Valuation Faces Reality Check
- MSTR Stock Holds Key Range As Volatility Tightens
- BBAI Stock Pops As BigBear.ai Lands $225M In Federal AI Deals
With no fresh company-specific news, HLIT trades mainly on execution versus guidance and sector sentiment. Versus broader Technology and Hardware & Equipment benchmarks, Harmonic offers superior gross margins and cash generation but weaker top-line growth and more volatile earnings. Near term, resistance sits at $17.50–18, support at $15 and then $13.50. Base case outlook is range-bound consolidation; fair value over 6–12 months is $18, making the risk/reward favorable only for disciplined, level-driven buyers.
Quick Financial Overview
Harmonic Inc. (HLIT) shows a clear short-term momentum shift on the chart. The weekly data captures a slide from roughly $17.90 down toward $15.40, with lower highs and lower closes developing quickly. That kind of range compression after a drop often signals a battle between dip-buyers and sellers, not a clean trend yet. Traders should recognize that this is a pullback phase, not an established reversal back up.
Intraday, the 5-minute candle reveals a sharp wash from around $16.60 down toward $14.90 before a bounce into the low $15s. That wide intraday range points to heavy emotion and likely stop-loss hits. For active traders, that means opportunity, but also higher risk if entries are mistimed. Volatility at the open or around key levels can offer quick scalps, but chasing moves in this tape can punish late entries.
On fundamentals, HLIT prints roughly $360.5M in revenue with a strong 45.8% gross margin but a profit margin near -12%. So the core business can generate value, yet costs and charges are weighing on the bottom line. Recent quarterly numbers show about $121.7M in revenue, $20.6M in EBITDA, and net income of $7.3M, while free cash flow of about $30.3M and a current ratio of 2.3 signal decent liquidity. Debt is manageable at a total-debt-to-equity of 0.37, with $109.0M in cash, giving Harmonic Inc. flexibility even as returns on capital look choppy.
Conclusion
Harmonic Inc. Technicals And Fundamentals At A Crossroads
The key question now is whether HLIT stabilizes in the mid-$15s or continues bleeding toward prior demand zones. The weekly pattern shows quick rejection from the $17–$18 area, but it also shows buyers stepping in around $15 with closes holding above the intraday panic low. For short-term traders, that makes the $15 region a tactical reference: lose it with volume, and the path of least resistance remains down; hold it, and you could see a snapback toward $16–$17.
On the fundamental side, Harmonic Inc. offers a mixed picture. Strong gross margin, positive EBITDA, and solid free cash flow are positives, backed by cash on hand and reasonable leverage. At the same time, negative net margins and volatile return-on-capital metrics warn that execution risk is real. HLIT is not a clean, steady grower; it is a name where position sizing and trade location matter.
For research-focused traders, the play here is to respect both the volatility and the balance sheet. As Tim Bohen, lead trainer with StocksToTrade says, “I focus on momentum that’s visible right now. Speculation on future moves is outside my playbook.” In that spirit, wait for the tape to confirm whether this is a simple pullback in an ongoing uptrend or the start of a deeper reset. As I often tell my students, “Your edge doesn’t come from predicting where a stock should go; it comes from waiting until the chart clearly shows who is in control, then trading only when the reward justifies the risk.”
This is stock news, not investment advice. StocksToTrade News delivers real-time stock market updates tailored to highlight the key catalysts driving short-term price movements. Our coverage is designed for active traders and investors who thrive in fast-moving markets, with a focus on volatile sectors like penny stocks, AI stocks, Robinhood stocks and other momentum plays. From earnings reports and FDA approvals to mergers, new contracts, and unusual trading volume, we break down the events that can spark significant price action.
Looking to level up your trading game? Explore StocksToTrade, the ultimate platform for traders. With powerful tools designed for swing and day trading, integrated news scanning, and even social media monitoring, StocksToTrade keeps you one step ahead.
Check out our quick startup guide for new traders!
- How to Read Stock Charts: A Guide for Beginners
- Trading Plan: 6 Steps to Create One
- How To Create a Stock Watchlist
Ready to build your watchlists? Check out these curated lists:
Once your watchlist is set, take the next step and trade with confidence using StocksToTrade’s robust platform. Don’t miss out — grab your 14-day trial for just $7 and experience the edge you need to thrive in today’s fast-paced markets.