
Harmonic Inc. stocks have been trading down by -9.59 percent amid heightened concerns over its latest market and earnings outlook.
Market Insights For Harmonic Inc. Traders
- Price has slipped from the mid-$17s to the mid-$15s, showing clear near-term weakness.
- Intraday action saw a sharp drop below $15, signaling aggressive selling before a modest bounce.
- Recent weekly candles show failed pushes above $17, pointing to resistance and profit taking.
- Financials combine solid gross margin with weak net margin, creating a mixed fundamental backdrop.
- Balance sheet liquidity and manageable debt levels give Harmonic Inc. room to navigate volatility.
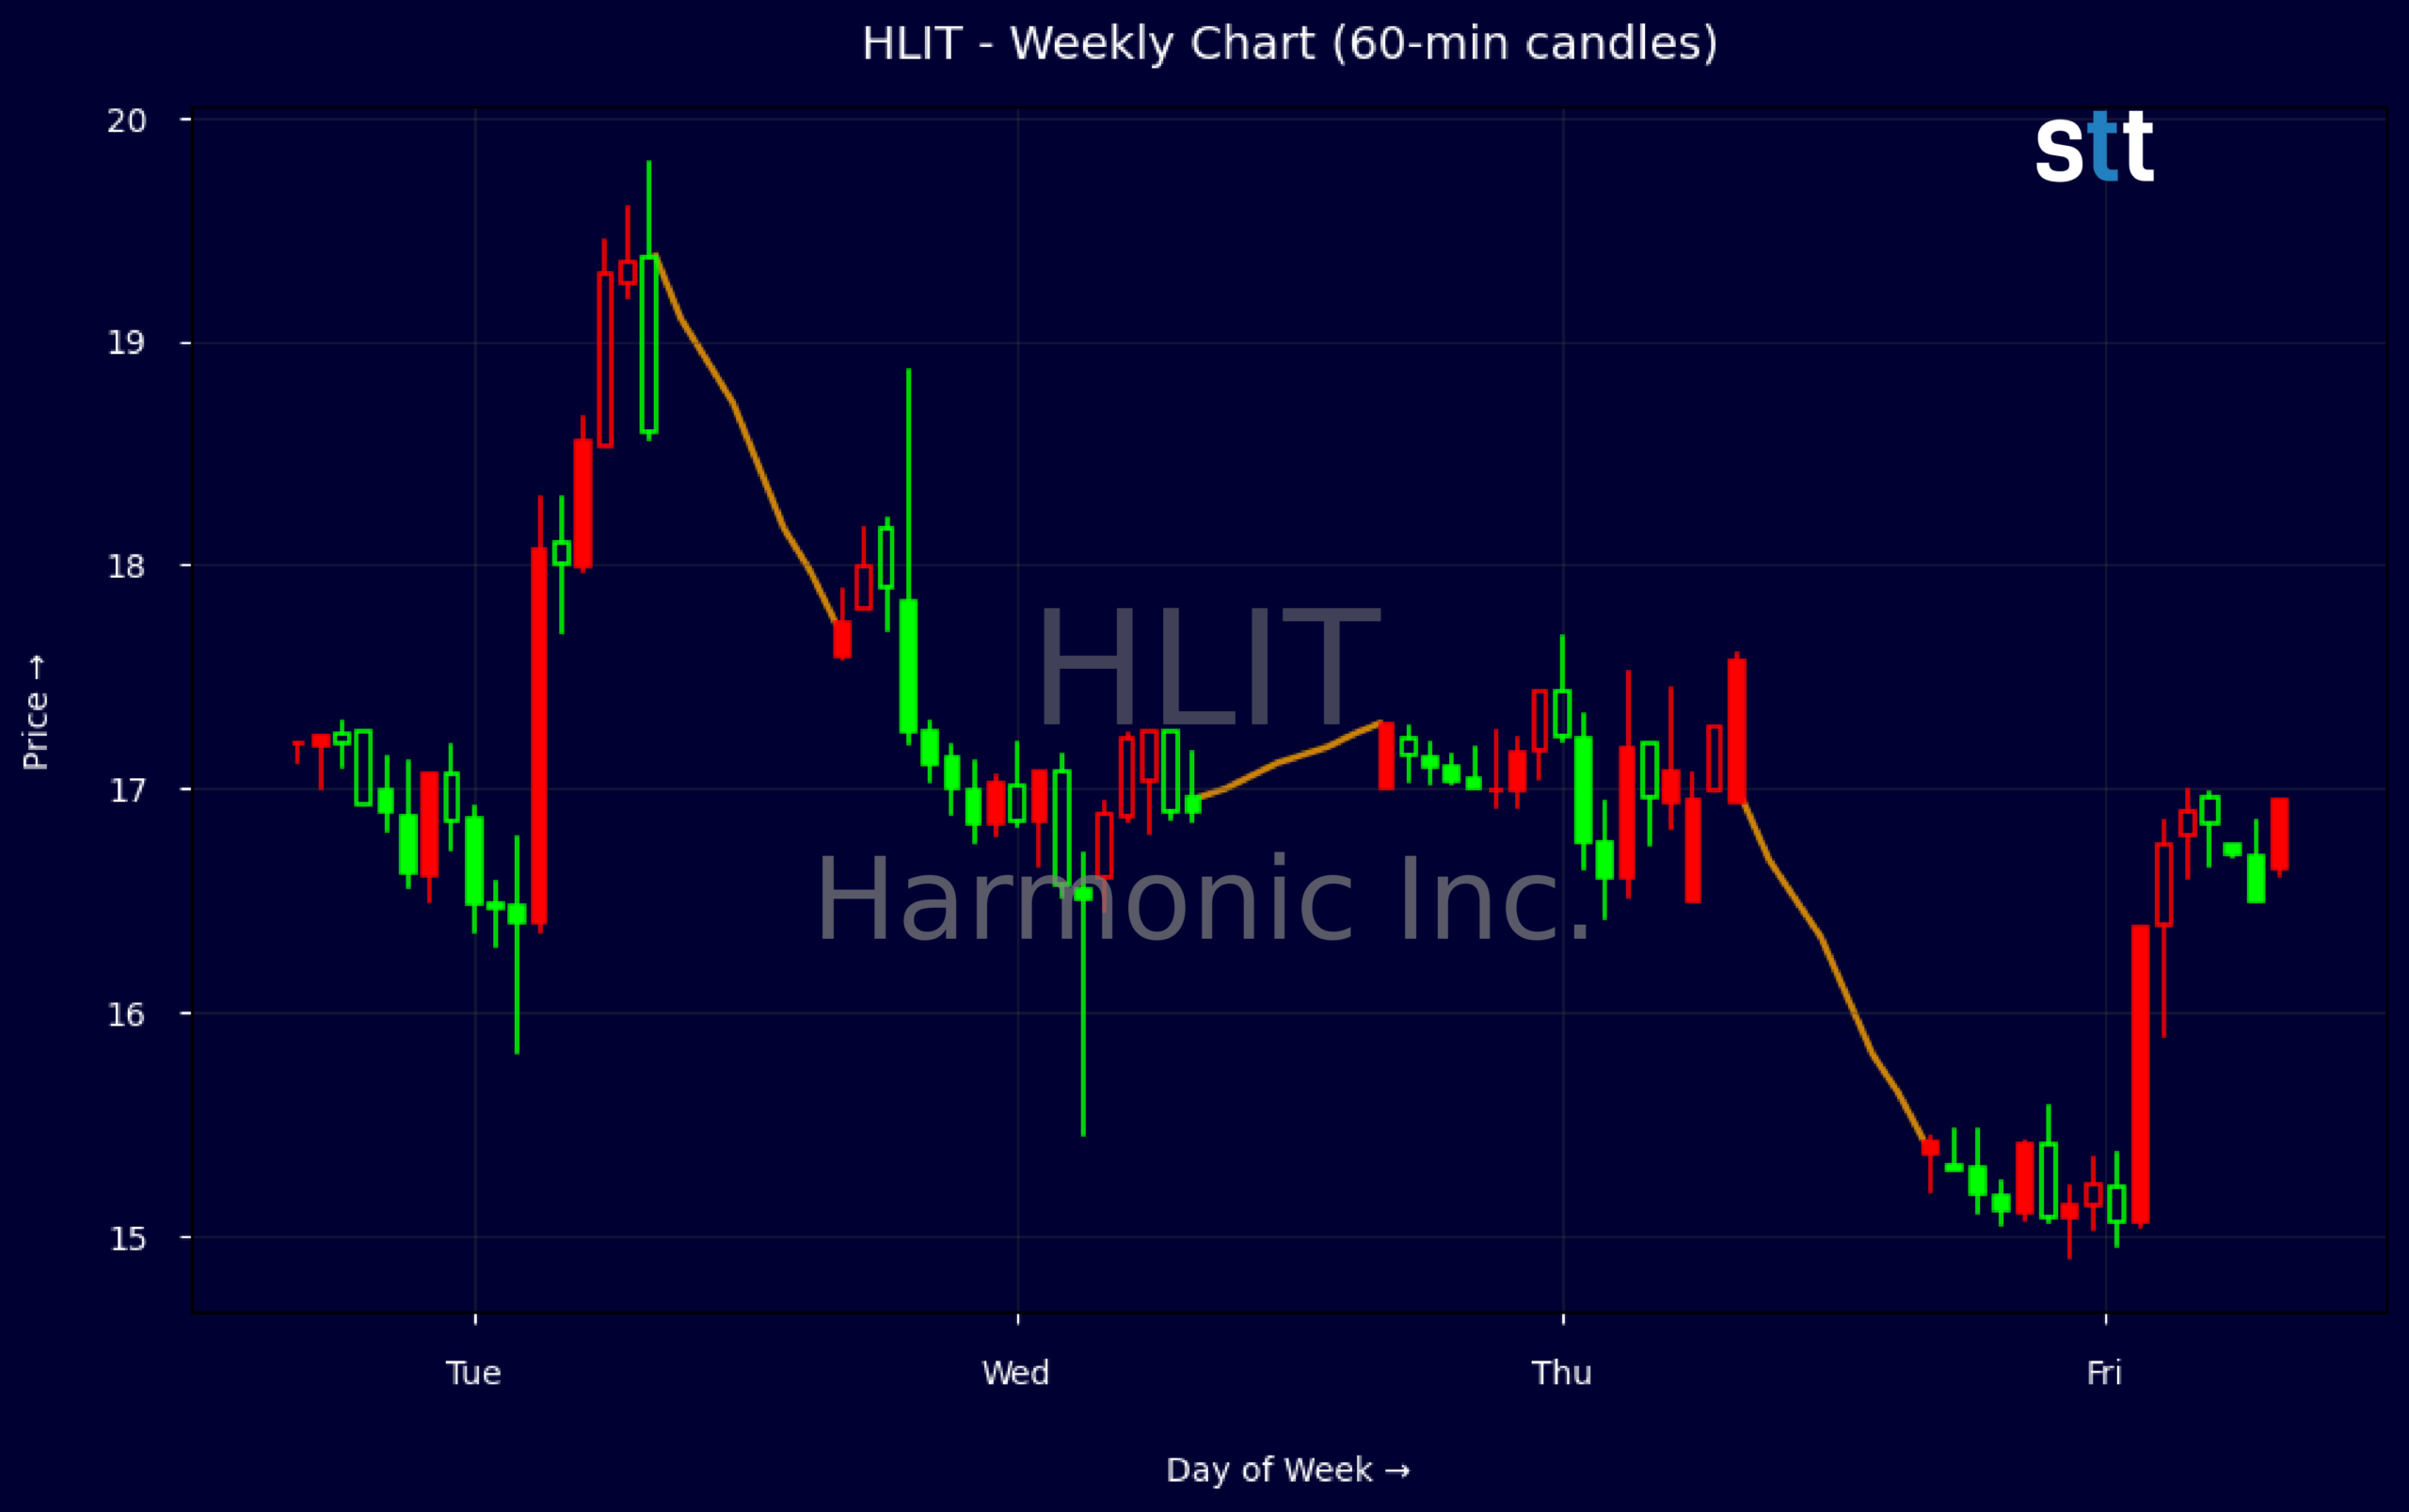
Weekly Update May 25 – May 29, 2026: On Saturday, May 30, 2026 Harmonic Inc. stock [NASDAQ: HLIT] is trending down by -9.59%! Discover the key drivers behind this movement as well as our expert analysis in the detailed breakdown below.
Technology industry expert:
Analyst sentiment – positive
Harmonic Inc. (HLIT) remains a niche video-delivery and access-infrastructure player with solid gross margin at ~46% but structurally weak profitability, as evidenced by negative EBIT and net margins on a trailing basis and revenue contraction (3-year -18%). Latest quarter shows a sharper operational turnaround: $121.7M revenue, $20.4M operating income, $7.3M GAAP net income and strong $31.7M operating cash flow, with $30.3M FCF. Balance sheet is sound (current ratio 2.3, modest leverage, net cash position), supporting continued buybacks and R&D.
Technically, the dominant near-term trend is down: shares rolled from the high-$17s to mid-$15s over the last four weeks, with progressive lower highs and lower closes, confirming distribution after an extended run. Intraday 5‑minute candles recently showed failed bounces above $16 with heavier volume on down legs, reinforcing selling pressure. The first actionable level is support near $15.00; a decisive break with volume opens downside to ~$13.80, while a reclaim and sustained hold above $16.80 would signal a tradable reversal.
More Breaking News
- CareDx CDNA Soars After Earnings Beat And Guidance Hike
- CMCSA Rallies As Earnings Beat Collides With Restructuring Overhang
- SNDG ETF Slides As Volatility Grips Short-Term Traders
- Global Payments Stock Climbs As Analysts Bet On Worldpay Upside
With no incremental news, the story is driven by execution versus Technology and Hardware & Equipment peers that generally enjoy better scale but comparable or lower gross margins. Harmonic’s capital return (buybacks), improving FCF conversion, and solid access-network demand justify a premium P/S and P/FCF. I see near-term trading support at $15 and resistance at $18. Provided fundamentals hold, a 6–12 month fair-value band of $19–21 is justified.
Quick Financial Overview
Harmonic Inc. (HLIT) has seen its stock pull back in recent sessions. Weekly data shows price stalling near $17.90 before dropping toward the mid-$15s, which tells traders that supply is heavy above $17. The latest weekly close near $15.37 marks a clear break from the prior consolidation around $16.80–$17.00 and puts the focus on whether $15 can act as a stabilizing zone.
On the intraday 5-minute view, the single candle provided captures a fast breakdown from around $16.60 to a low near $14.90 before recovering slightly to just above $15. That kind of wide intraday range signals strong emotion and likely forced selling. For short-term traders, this type of bar often defines a reference low; a decisive move below that area later can open the door to a new downside leg, while holding above it can form a base.
Fundamentally, HLIT is a mixed story. Quarterly revenue is about $121.7M, with trailing revenue near $360.5M, but multi-year revenue growth has been negative. Gross margin near 45.8% is healthy, yet profit margins are negative on a trailing basis, even though the latest quarter produced about $7.3M in net income and roughly $0.07 in diluted EPS. The balance sheet shows around $109M in cash, total assets near $705.3M, and total liabilities around $350.2M, with a current ratio of 2.3 and total debt-to-equity of 0.37, giving HLIT some financial cushion despite recent earnings volatility.
Conclusion
For traders, HLIT now trades in a clear pullback phase, with the chart signaling that momentum has shifted from buyers to sellers in the short term. The weekly failure near the high-$17s followed by a drop toward the mid-$15s lines up with the intraday breakdown print below $15, so price action is confirming pressure on the long side. At the same time, Harmonic Inc. carries solid gross margins, positive recent quarterly earnings, and a decent liquidity profile, which may limit downside if sentiment improves.
The key now is how HLIT behaves around the recent intraday low near $14.90 and the broader $15 zone. Holding above that area and grinding back through $16–$17 would show trapped shorts losing control; a clean breakdown and acceptance below $15 would warn that sellers are still in charge. Traders should weigh that technical picture against the company’s mixed but not disastrous fundamentals: shrinking revenue trends and uneven margins on one side, stable cash and manageable leverage on the other. As I tell my students, “Your edge comes from respecting what price and volume are actually saying while staying brutally honest about the risk, not from guessing where you wish the stock would go.” As Tim Bohen, lead trainer with StocksToTrade says, “If you’re still guessing at the end of your analysis, it’s probably not a trade worth taking.” This article is for educational and research purposes only. “,”scores”:{“risk-level”:”3″},”trade”:”false
This is stock news, not investment advice. StocksToTrade News delivers real-time stock market updates tailored to highlight the key catalysts driving short-term price movements. Our coverage is designed for active traders and investors who thrive in fast-moving markets, with a focus on volatile sectors like penny stocks, AI stocks, Robinhood stocks and other momentum plays. From earnings reports and FDA approvals to mergers, new contracts, and unusual trading volume, we break down the events that can spark significant price action.
Looking to level up your trading game? Explore StocksToTrade, the ultimate platform for traders. With powerful tools designed for swing and day trading, integrated news scanning, and even social media monitoring, StocksToTrade keeps you one step ahead.
Check out our quick startup guide for new traders!
- How to Read Stock Charts: A Guide for Beginners
- Trading Plan: 6 Steps to Create One
- How To Create a Stock Watchlist
Ready to build your watchlists? Check out these curated lists:
Once your watchlist is set, take the next step and trade with confidence using StocksToTrade’s robust platform. Don’t miss out — grab your 14-day trial for just $7 and experience the edge you need to thrive in today’s fast-paced markets.