

Haleon plc stocks have been trading down by -14.5 percent after intensified Zantac litigation risks spooked investors.
Key Takeaways
- HLN has climbed from the high-$8s to roughly $10 over recent sessions, showing steady, low-drama accumulation.
- Daily HLN candles reveal tight trading ranges, hinting at consolidation after a controlled uptrend from early October.
- Profitability at Haleon plc is strong, with gross margin around 65% and EBIT margin above 20%, supporting a defensive profile.
- HLN’s valuation near a 19x P/E and price-to-sales around 2.75 signals traders are paying up for stable cash flow.
- Liquidity ratios are on the tighter side, so HLN remains a quality name but not a balance-sheet fortress.
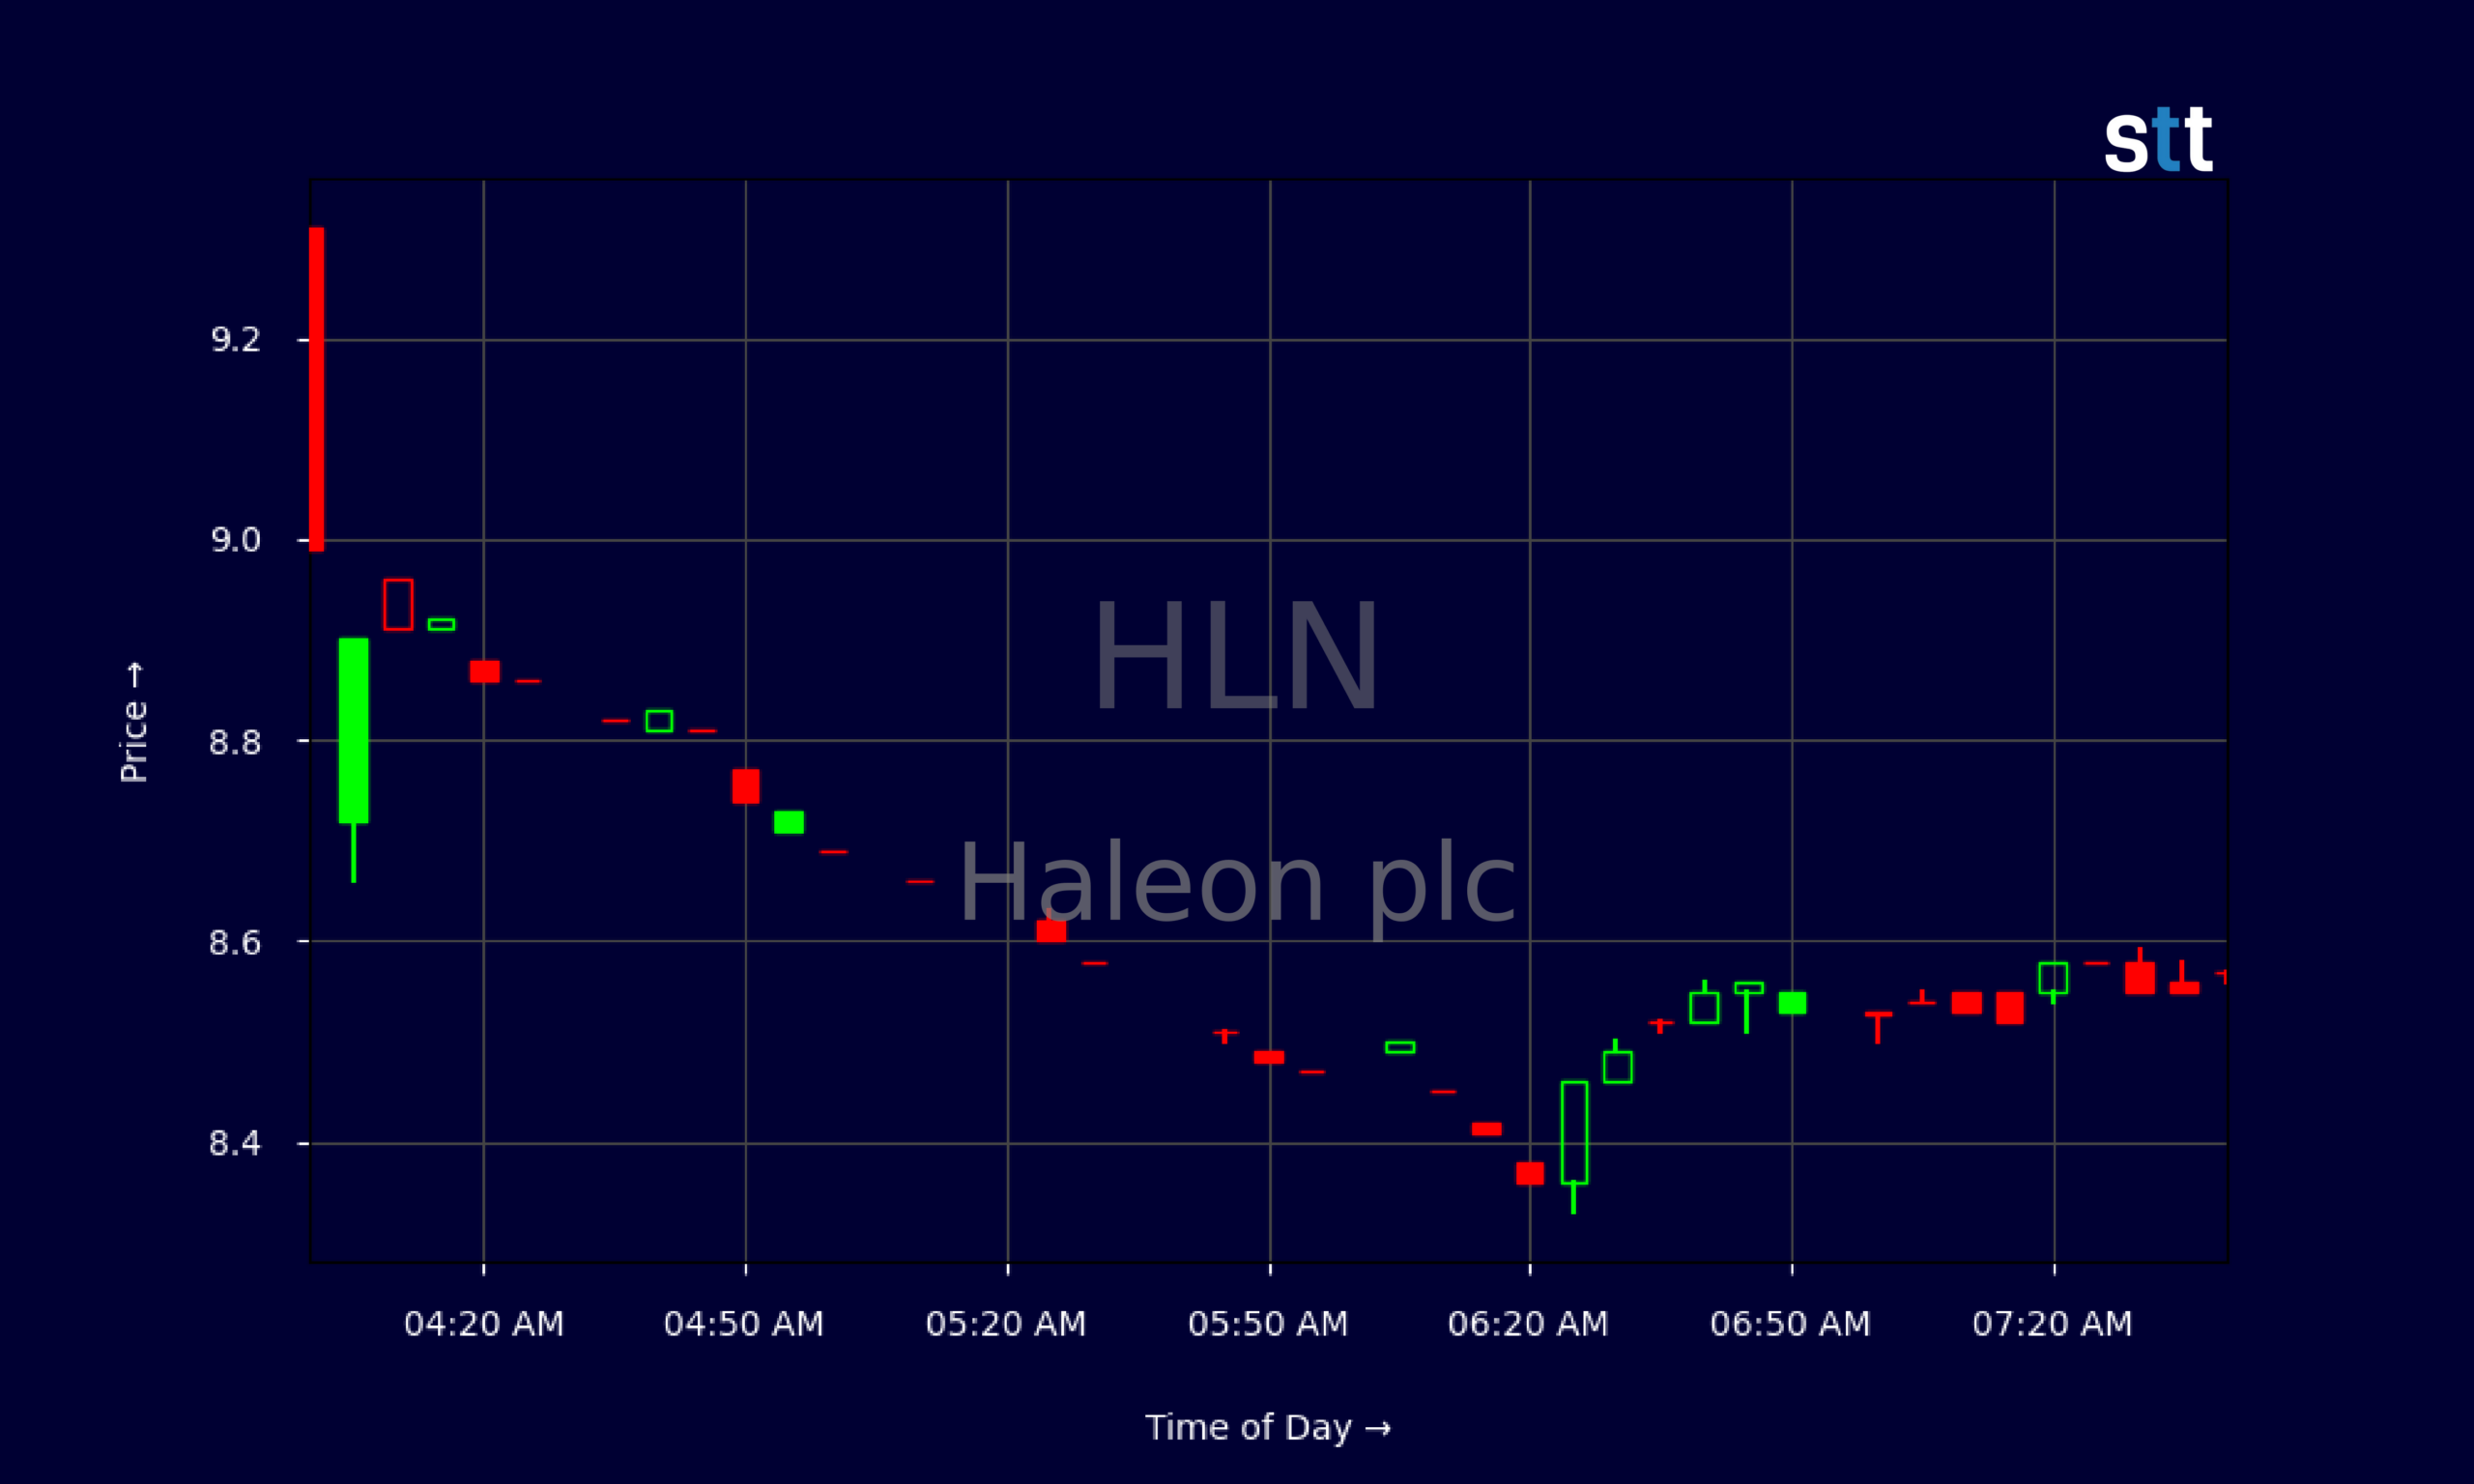
Live Update At 07:46:44 EDT: On Thursday, October 29, 2026 Haleon plc stock [NYSE: HLN] is trending down by -14.5%! Discover the key drivers behind this movement as well as our expert analysis in the detailed breakdown below.
Quick Financial Overview
HLN is acting like a classic defensive consumer-health stock. The company behind brands in everyday health has locked in serious profitability, with Haleon plc posting a gross margin near 65%. That means for every $1 in sales, about $0.65 stays after product costs. An EBIT margin near 22% and profit margin around 14% confirm HLN is not grinding out razor-thin returns; it’s a solid cash generator.
Revenue sits a little above $11.0B, and HLN trades around 2.75 times sales. For traders, that says the market is comfortable paying a premium for stability. The P/E near 19.4 is not a bargain-basement value multiple, but it’s well below high-growth tech, fitting HLN’s slower, steadier profile.
More Breaking News
- CBRG ETF Slides As Volatility Grips Short-Term Traders
- PURR Stock Grinds Higher As Hyperliquid Strategies Draws Trader Focus
- BBD Stock Slides As Analysts Slash Growth Outlook
- EAT Stock Draws Aggressive Upgrades Ahead Of Earnings
On the risk side, Haleon plc carries some leverage. Total debt-to-equity around 0.5 and an interest coverage ratio near 8.8 show HLN can service debt, but the current ratio near 0.7 and quick ratio near 0.5 flag tighter short-term liquidity. Returns on capital, especially a one-year ROIC near 27.9%, tell traders HLN uses that leverage effectively. Overall, HLN screens as a quality, moderately leveraged compounder with room for swing trades rather than a wild momentum story.
Why Traders Are Watching HLN’s Slow Grind
HLN’s chart is not a meme-stock rollercoaster. It’s a slow grind that experienced traders love when broader markets are nervous. Look at the daily action: Haleon plc has walked up from about $8.80 on 2026/10/05 to roughly $10.00 by 2026/10/28. That’s a controlled, almost stair-step trend. Pullbacks have been shallow, with lows in the mid-$9s getting bought and closes frequently near the upper half of each day’s range.
Those are classic signs of accumulation. HLN isn’t ripping; it’s being quietly scooped up. For short-term traders, that often sets up clean support and resistance zones. The $9.40–$9.70 band has turned into a key demand area on the chart, while the $10.30–$10.40 region is now the first serious supply zone. When Haleon plc tests those levels, you get clear risk parameters for entries and exits.
Intraday, the 5-minute data on HLN shows a heavy focus on the open and early session. There’s a quick flush from around $9.31 down toward the high $8s at the open, then a fast recovery and a long period of tight, low-volume drift between $8.50 and $8.60. That kind of pattern tells traders that dip-buyers are active, but momentum chasers have not piled in yet.
Combine that with Haleon plc’s strong margins and stable revenue base, and you have a name traders watch as a “hideout” when volatility picks up elsewhere. HLN may not double overnight, but the chart structure gives disciplined day and swing traders predictable parameters to play breakouts, failed breakouts, and mean reversion moves.
Conclusion
For active traders, HLN sits in that sweet spot between boring and dangerous. Haleon plc has the financial backbone: high gross margin, solid EBIT margin, and strong returns on capital. The leverage is manageable, though short-term liquidity is on the tight side, which keeps HLN from being a pure sleep-well-at-night balance sheet. Still, those numbers support the slow uptrend we see on the chart.
Price action confirms the story. HLN has moved from the high-$8s into the $10 area in a controlled fashion, with clear levels building on the daily chart. Consolidation near the top of that range, plus intraday dip-buying, signals that traders are using every pullback in Haleon plc as a chance to reload rather than to run for the exits. This is where disciplined preparation really matters, because the cleaner the pattern, the more a trader’s work should be done before the opening bell. As Tim Bohen, lead trainer with StocksToTrade says, “Preparation is half the trade. By the time the bell rings, my decisions are nearly made.” That mindset helps traders approach HLN’s price structure with a clear plan instead of reacting emotionally to each tick.
That’s exactly the kind of pattern Tim Sykes and his community teach traders to focus on: clear trends, defined risk zones, and enough liquidity to get in and out cleanly. As Sykes likes to say, “Patterns repeat because human nature doesn’t change — your job is to recognize them early and manage risk like a pro.” HLN won’t satisfy thrill-seekers chasing parabolic moves, but for traders who respect risk and study charts, Haleon plc offers a steady, rule-based trading playground — strictly for education and research, not as a signal to buy or sell.
This is stock news, not investment advice. StocksToTrade News delivers real-time stock market updates tailored to highlight the key catalysts driving short-term price movements. Our coverage is designed for active traders and investors who thrive in fast-moving markets, with a focus on volatile sectors like penny stocks, AI stocks, Robinhood stocks and other momentum plays. From earnings reports and FDA approvals to mergers, new contracts, and unusual trading volume, we break down the events that can spark significant price action.
Looking to level up your trading game? Explore StocksToTrade, the ultimate platform for traders. With powerful tools designed for swing and day trading, integrated news scanning, and even social media monitoring, StocksToTrade keeps you one step ahead.
Check out our quick startup guide for new traders!
- How to Read Stock Charts: A Guide for Beginners
- Trading Plan: 6 Steps to Create One
- How To Create a Stock Watchlist
Ready to build your watchlists? Check out these curated lists:
Once your watchlist is set, take the next step and trade with confidence using StocksToTrade’s robust platform. Don’t miss out — grab your 14-day trial for just $7 and experience the edge you need to thrive in today’s fast-paced markets.