

Gerdau S.A. stocks have been trading down by -3.01 percent amid weakening steel demand and deteriorating global economic outlook.
Key Takeaways
- Price action in GGB shows a steady pullback from the $5.40 area to the mid‑$4.50s, putting key support levels in focus for short‑term traders.
- Recent intraday trading in GGB has been tight and controlled, signaling consolidation after several sharp red days on the daily chart.
- Gerdau S.A. posts roughly $67.0B in revenue with a price‑to‑sales ratio under 1, making GGB a value‑style steel name on many watchlists.
- GGB carries a modest leverageratio and solid equity base, giving the company room to weather steel‑cycle volatility.
- Active traders are watching whether GGB can hold the $4.40–$4.50 zone or break lower and open up more downside momentum.
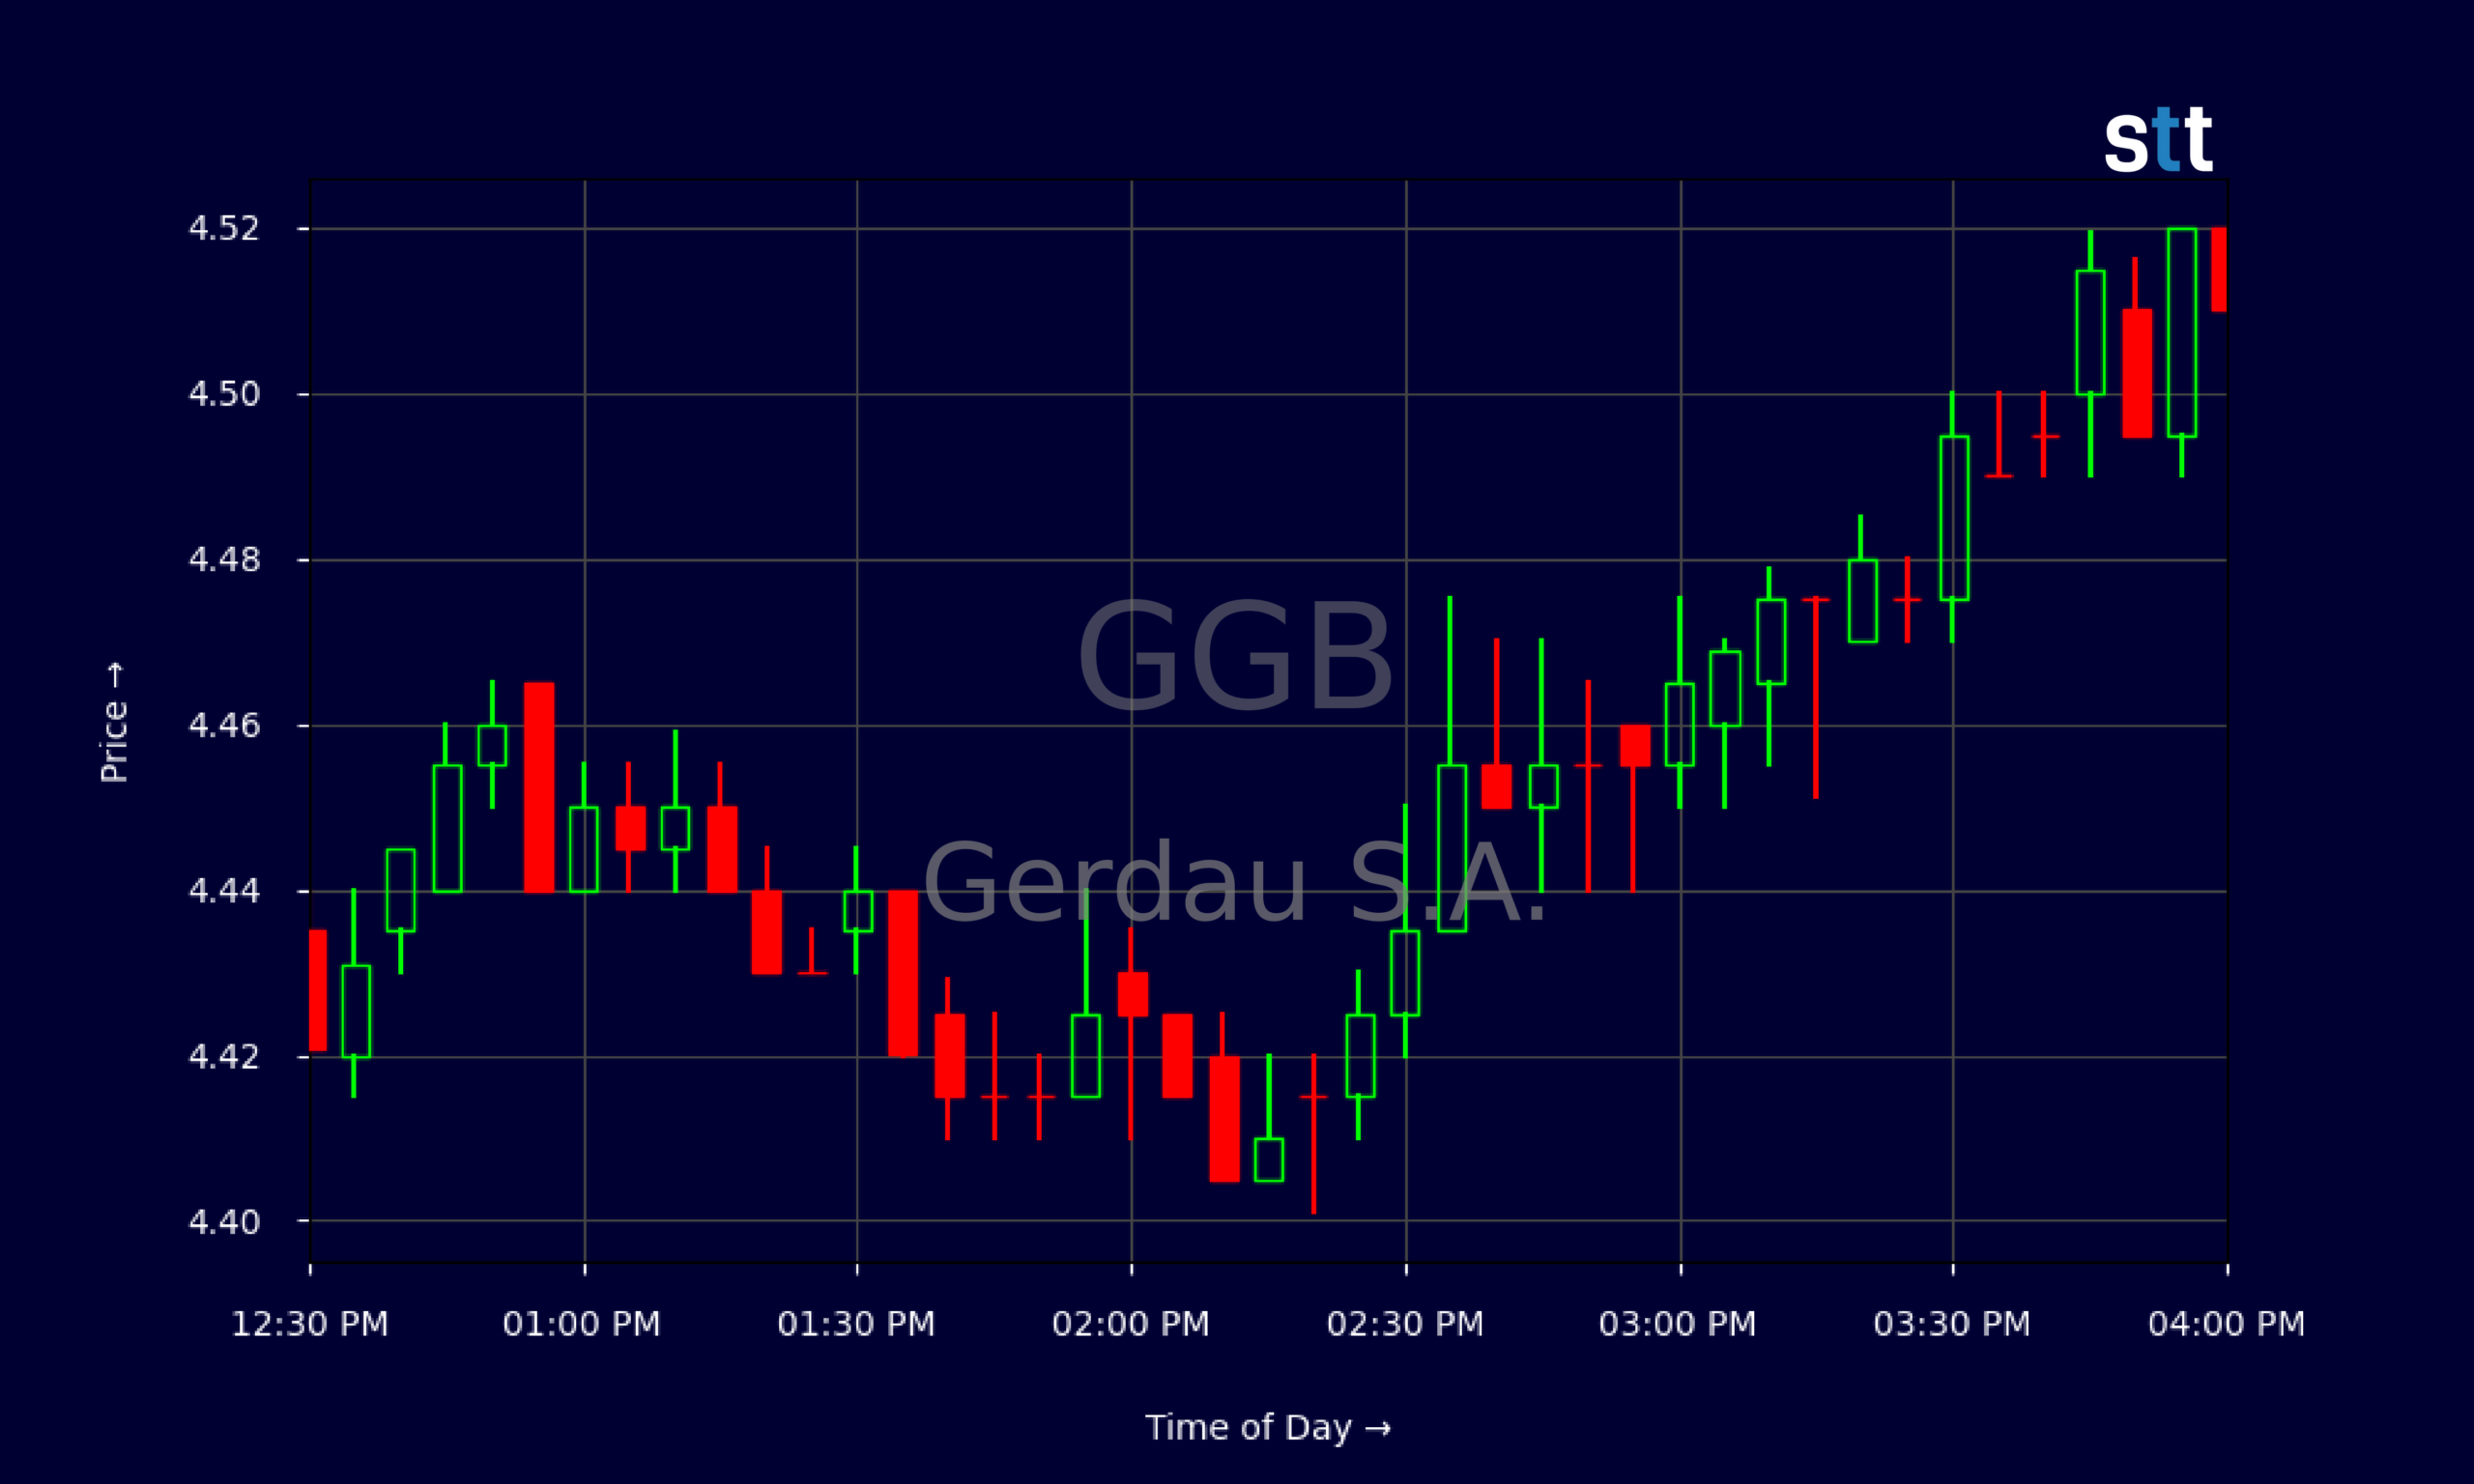
Live Update At 16:46:31 EDT: On Wednesday, October 28, 2026 Gerdau S.A. stock [NYSE: GGB] is trending down by -3.01%! Discover the key drivers behind this movement as well as our expert analysis in the detailed breakdown below.
Quick Financial Overview
Gerdau S.A., the steel producer behind GGB, is a classic cyclical name. When steel demand heats up, cash flows jump; when it cools, earnings compress fast. Right now, GGB’s numbers tell a mixed story that traders need to read carefully.
The company generates around $67.0B in annual revenue, with a pretax profit margin near 18.8%. That’s solid profitability for a heavy industrial player. At the same time, GGB is trading at a price‑to‑sales ratio of about 0.74 and a price‑to‑book ratio just under 1. In plain English, the market is pricing Gerdau S.A. close to its accounting value, not like a high‑growth story.
The headline P/E near 37.99 looks rich at first glance, which tells traders earnings are currently depressed versus the company’s longer‑term power. Balance‑sheet data helps explain why some still pay attention: GGB holds roughly $6.4B in cash and short‑term investments against about $14.2B in long‑term debt, plus nearly $18.7B in working capital. That cushions the business through down cycles.
More Breaking News
- EAT Stock Draws Aggressive Upgrades Ahead Of Earnings
- Quad Graphics Inc Falls 12% After Third-Quarter Results
- Bicara Therapeutics Falls 45% Today
- Evercore EVR Stock Climbs As Wall Street Resets Targets
Return on equity of 9.58% and return on assets of 6.11% show Gerdau S.A. is reasonably efficient with its capital. For traders, GGB screens as a cyclical value name with short‑term earnings pressure and a balance sheet strong enough to stay in the game.
Why Traders Are Watching GGB Price Action
The chart is where short‑term traders live, and GGB has been sending some clear signals. Over the past couple of weeks, Gerdau S.A.’s stock rolled over from highs above $5.40, slipping down toward $4.50. That move is not just noise. It shifts the bias from a steady grind up to a “show me” zone where buyers need to step in.
Look at the daily candles. GGB printed a series of lower highs: $5.48, then $5.25, then $5.21, then $5.10, before sliding into the $4.60–$4.70 range and finally closing near $4.51 on the latest day. That staircase down tells traders supply is beating demand on rallies. Each bounce is sold a little earlier.
Zoom in to the intraday 5‑minute chart and you see a different story: tighter ranges, smaller candles, and a lot of trading between $4.44 and $4.50. GGB opened around $4.60, slipped quickly into the $4.50s, and then spent most of the day grinding sideways with a slight downward tilt. That’s classic consolidation after a push lower.
When you combine that intraday coil with the broader downtrend, Gerdau S.A. becomes a pure pattern‑recognition play. Short‑biased traders will eye any failed bounce into the $4.60s–$4.70s as a potential fade area. Long‑biased traders will focus on whether GGB can build a higher low above $4.40 and reclaim the $4.70 zone on volume. The company’s relatively low valuation and solid balance sheet mean swing traders are prepared to react quickly once momentum clearly flips in either direction.
Conclusion
For active traders, GGB right now is all about levels and timing. Gerdau S.A. shows balance‑sheet strength, decent profitability, and a valuation that leans toward value rather than hype. At the same time, the tape doesn’t lie. GGB has broken down from the low‑$5s and is testing the mid‑$4s, turning that $4.40–$4.50 band into an important battleground.
If GGB holds that support and starts putting in higher lows, range‑trading and mean‑reversion strategies may come into play, especially given Gerdau S.A.’s history of cycling with steel demand. A clean break below with volume, on the other hand, opens the door to a deeper slide and may attract momentum shorts looking to press the trend.
The key is preparation, not prediction. As Tim Sykes likes to remind traders, “The market doesn’t owe you anything; study the patterns, take singles, and cut losses quickly when the trade proves you wrong.” That mindset fits GGB perfectly here. As Tim Bohen, lead trainer with StocksToTrade says, “There’s a pattern in everything; you just have to stick around long enough to see it.” That perspective reinforces the importance of patiently watching GGB’s price action develop before committing to a trading thesis. Treat Gerdau S.A. as a textbook case in reading a cyclical chart, respecting support and resistance, and letting price action confirm your thesis before you commit real capital. This analysis is for educational and research purposes only, and every trader must do independent work before making any trading decisions.
This is stock news, not investment advice. StocksToTrade News delivers real-time stock market updates tailored to highlight the key catalysts driving short-term price movements. Our coverage is designed for active traders and investors who thrive in fast-moving markets, with a focus on volatile sectors like penny stocks, AI stocks, Robinhood stocks and other momentum plays. From earnings reports and FDA approvals to mergers, new contracts, and unusual trading volume, we break down the events that can spark significant price action.
Looking to level up your trading game? Explore StocksToTrade, the ultimate platform for traders. With powerful tools designed for swing and day trading, integrated news scanning, and even social media monitoring, StocksToTrade keeps you one step ahead.
Check out our quick startup guide for new traders!
- How to Read Stock Charts: A Guide for Beginners
- Trading Plan: 6 Steps to Create One
- How To Create a Stock Watchlist
Ready to build your watchlists? Check out these curated lists:
Once your watchlist is set, take the next step and trade with confidence using StocksToTrade’s robust platform. Don’t miss out — grab your 14-day trial for just $7 and experience the edge you need to thrive in today’s fast-paced markets.