
Gerdau S.A. stocks have been trading down by -7.91 percent amid sharply negative sentiment over weakening global steel demand.
Click Here for a Millionaire's POV on Trading GGB
SUBSCRIBE FOR ALERTSJOIN 50,000+ ACTIVE TRADERS
Key Takeaways
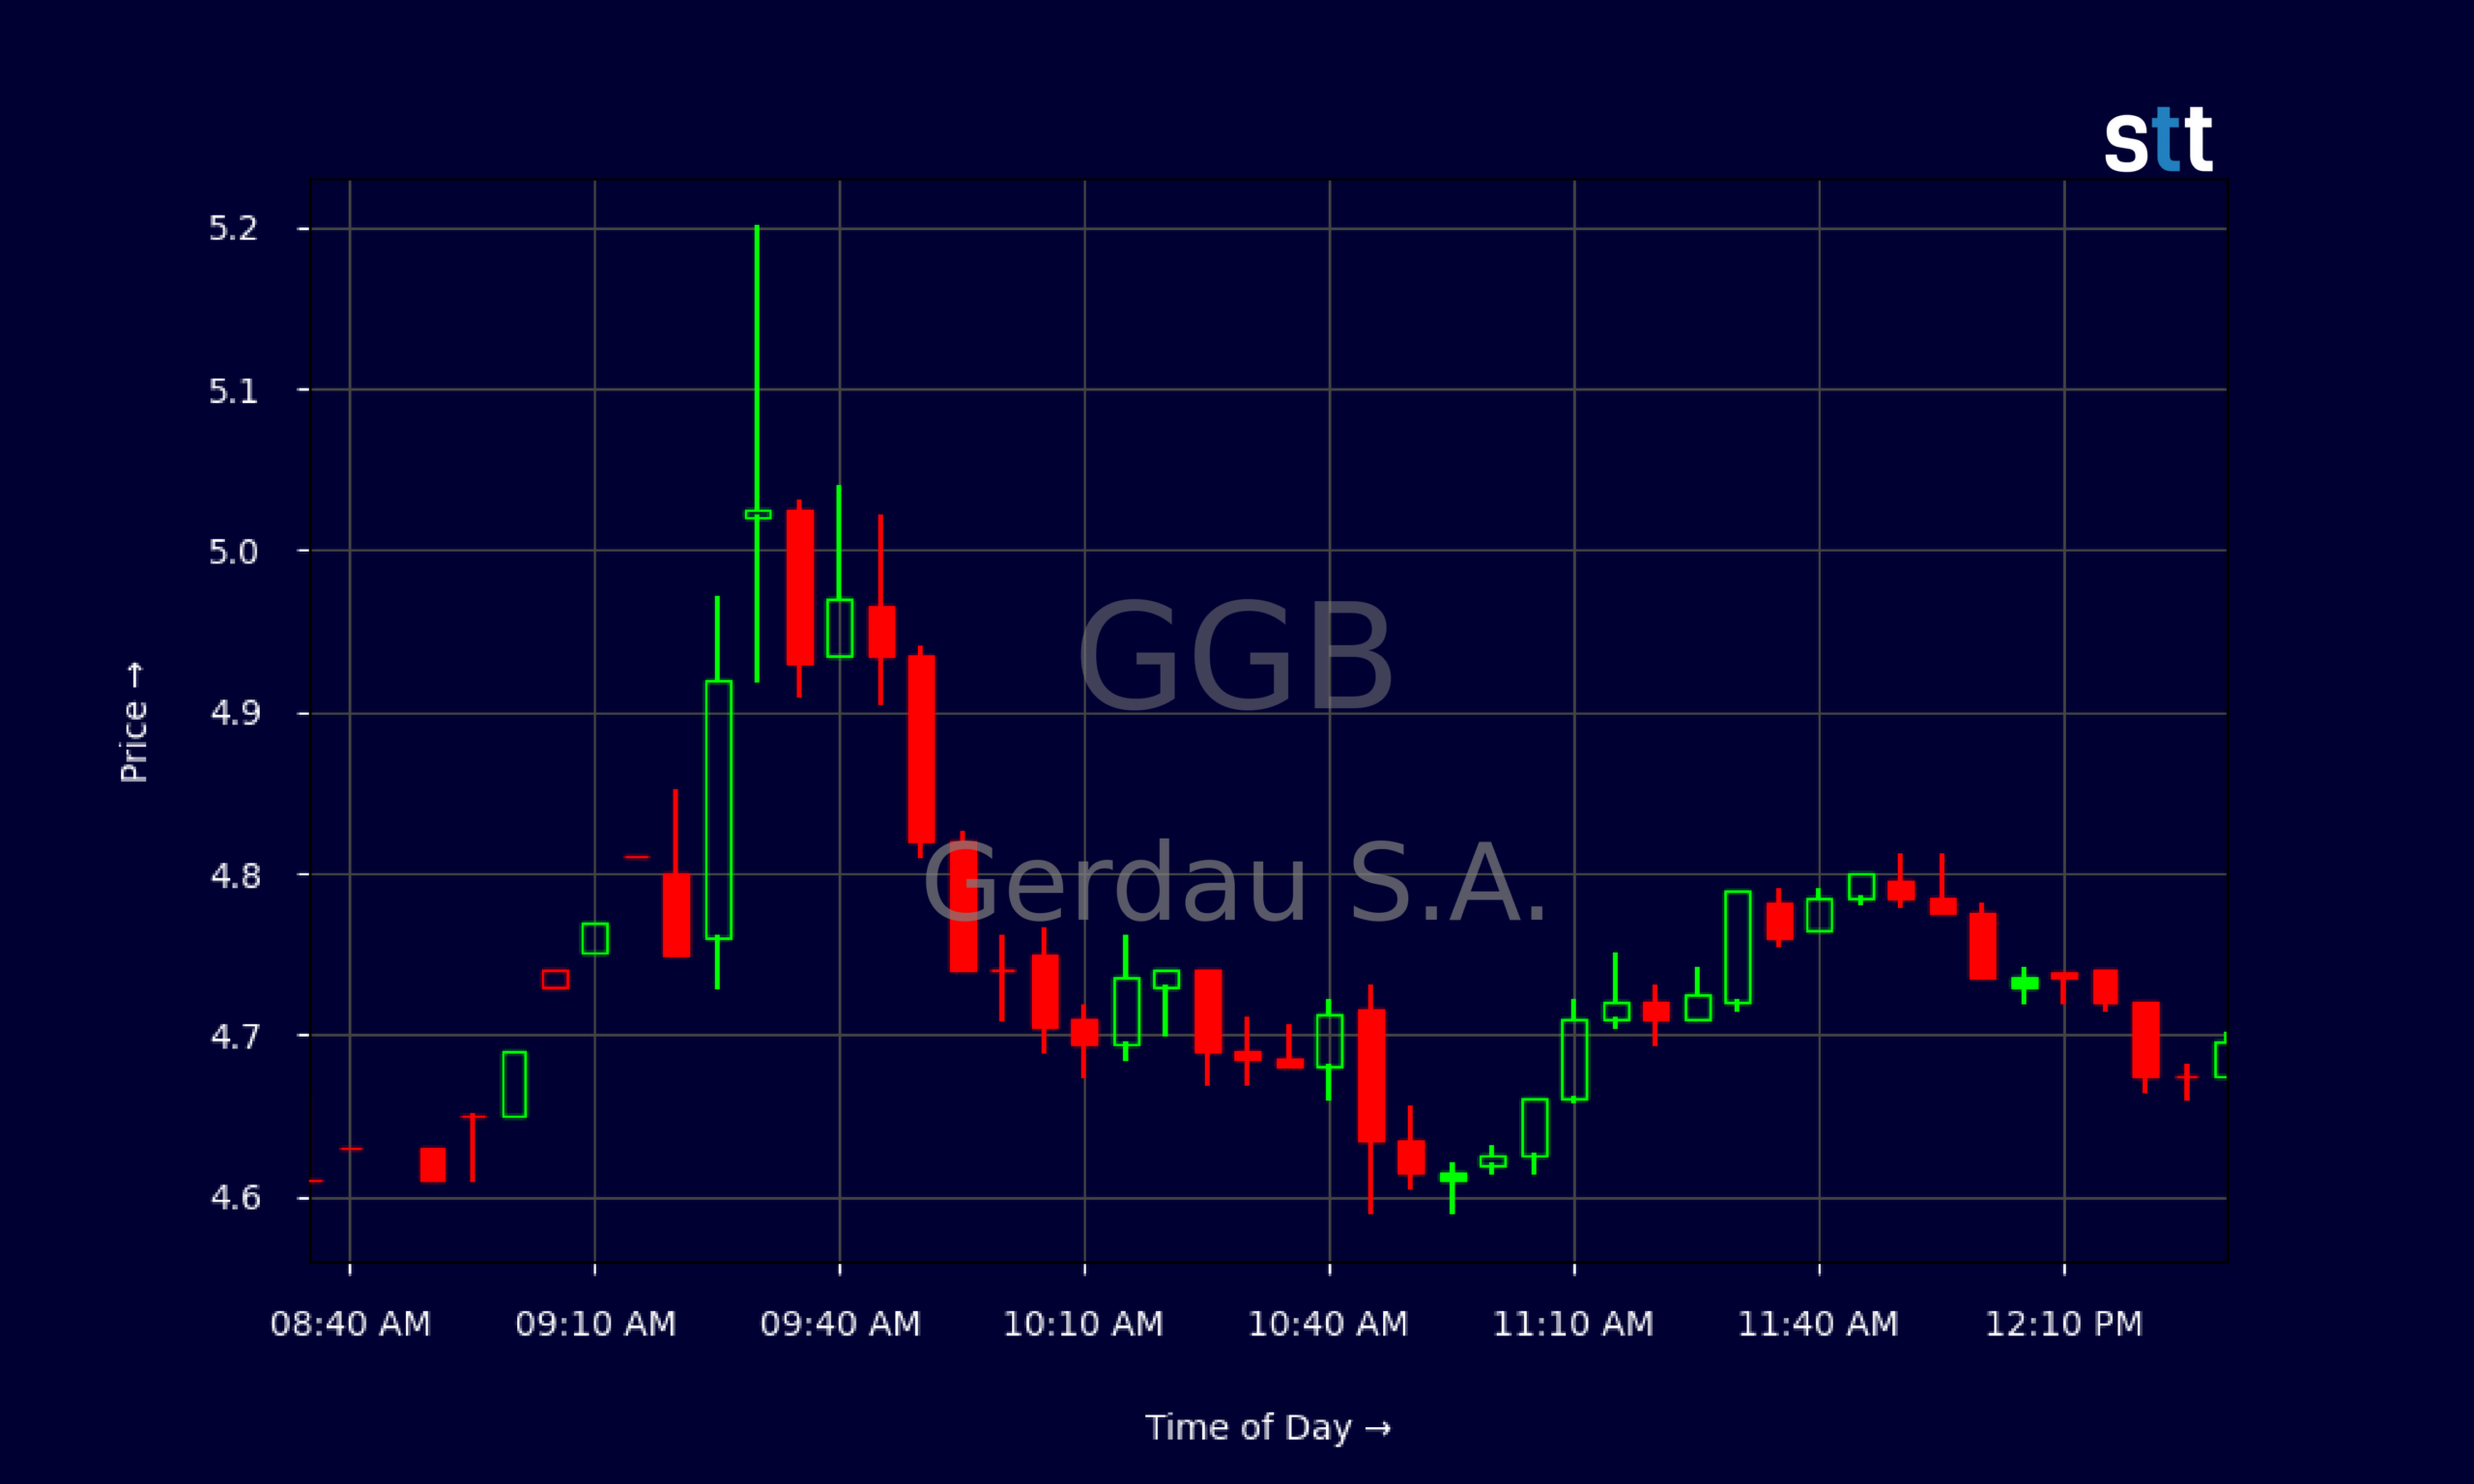
- Price action in GGB shows a sharp intraday fade from the $5.20 area down toward the mid‑$4.60s, signaling heavy selling pressure.
- Recent daily candles reveal GGB rolling over from a short-term uptrend, with lower closes and expanding intraday ranges that active traders watch closely.
- Balance sheet data show Gerdau S.A. carrying solid equity and meaningful cash, giving GGB room to ride out steel‑cycle swings.
- Valuation metrics keep GGB priced below book value but with a rich earnings multiple, a mix that often attracts short‑term trading over long‑term holding.
Live Update At 12:33:17 EDT: On Monday, October 26, 2026 Gerdau S.A. stock [NYSE: GGB] is trending down by -7.91%! Discover the key drivers behind this movement as well as our expert analysis in the detailed breakdown below.
Quick Financial Overview
Gerdau S.A., trading under ticker GGB, sits in a classic value‑meets‑cyclical spot. The company posted revenue of about $67.0B over the last year, yet the market only assigns a price‑to‑sales ratio of roughly 0.74. That tells traders GGB is being valued cheaply relative to its top line, which is common in heavy industry when the cycle looks late or uncertain.
GGB shows a price‑to‑earnings ratio near 37.99, surprisingly high for a steel name. That gap — cheap on sales, expensive on earnings — usually means profits have compressed while the stock has not fully reset. Traders in GGB should treat that as a warning that earnings need to stabilize or grow to justify the multiple.
More Breaking News
- JBLU Stock Slides As Wall Street Slashes Targets On Fuel Pain
- Ultrapar Stock Falls 16% Despite Favorable Valuation Feature
- SPRC Stock Draws Traders As SciSparc Pushes Trials And AI Pivot
- LITE Stock Draws Aggressive Targets As AI Demand Soars
On the balance sheet, Gerdau S.A. lists about $6.4B in cash and short‑term investments against total liabilities near $27.9B. Equity is strong at roughly $53.6B, and leverage looks controlled with long‑term debt only around $13.2B and long‑term debt‑to‑capital near 0.14. Returns are decent for a steel producer, with return on equity close to 9.58% and return on assets at 6.11%. For traders, that combination means GGB is not in distress, but earnings quality and steel pricing remain key variables.
Why Traders Are Watching GGB Price Action
GGB’s chart is where the real story is for short‑term traders. On the daily timeframe, Gerdau S.A. pushed from roughly $4.72 on 2026/10/01 up toward the $5.30 area by mid‑month, then stalled. The last printed close around $4.70 shows a rejection from that $5.20–$5.30 zone, with a big red day where GGB opened near $5.02 and washed to a low near $4.59. That kind of range expansion often marks a shift in control from buyers to sellers.
Zooming into the intraday 5‑minute tape, GGB opened strong around $5.02–$5.20, then quickly failed that spike. The stock slid under $4.90 within minutes and never reclaimed $5.00. From there, GGB spent the day grinding lower with a series of lower highs and weak bounces, finally stabilizing around $4.67–$4.70. To day traders, that is a textbook trend‑down day with early longs trapped.
This type of action puts GGB on watch for both sides. Short‑biased traders eye failed pushes into the $4.90–$5.00 area for potential re‑entries, using the morning high as a clear risk level. Dip‑buyers look at the low $4.60s as a possible short‑term support zone, especially given the prior base near $4.80–$5.00 earlier in the month. With Gerdau S.A. showing solid but cyclical fundamentals, many momentum traders will lean almost entirely on price levels, volume, and how GGB reacts if it retests that $5.00 pivot.
Conclusion
GGB is a classic steel‑cycle trading vehicle right now — not a quiet long‑term parking spot for cash. The fundamentals of Gerdau S.A. are stable enough: strong equity, controlled long‑term debt, and a business that still throws off profits. But the valuation mix of low price‑to‑sales and high price‑to‑earnings tells traders the market is unsure about the earnings runway. That doubt is showing up in the chart.
For active traders, the key zones are clear. On the downside, the recent wash into the mid‑$4.60s is the first support band to monitor on GGB. Lose that with volume, and the prior October lows near $4.70 and even the $4.60 handle can turn into resistance. On the upside, every push toward $4.90–$5.00 becomes a test of trapped shorts versus stubborn longs. A clean reclaim and hold over $5.00 would tell traders that GGB’s selling wave is easing.
As Tim Sykes loves to say, “Charts don’t lie, traders do.” GGB’s chart is speaking loudly right now. As Tim Bohen, lead trainer with StocksToTrade says, “A consistent trading routine beats sporadic action every time. Show up daily, and you’ll start to see the patterns others miss.” For those studying Gerdau S.A., the lesson is simple: respect the levels, recognize that a heavy P/E in a cyclical name demands caution, and always remember that this analysis is for educational and research purposes only, not trading advice.
This is stock news, not investment advice. StocksToTrade News delivers real-time stock market updates tailored to highlight the key catalysts driving short-term price movements. Our coverage is designed for active traders and investors who thrive in fast-moving markets, with a focus on volatile sectors like penny stocks, AI stocks, Robinhood stocks and other momentum plays. From earnings reports and FDA approvals to mergers, new contracts, and unusual trading volume, we break down the events that can spark significant price action.
Looking to level up your trading game? Explore StocksToTrade, the ultimate platform for traders. With powerful tools designed for swing and day trading, integrated news scanning, and even social media monitoring, StocksToTrade keeps you one step ahead.
Check out our quick startup guide for new traders!
- How to Read Stock Charts: A Guide for Beginners
- Trading Plan: 6 Steps to Create One
- How To Create a Stock Watchlist
Ready to build your watchlists? Check out these curated lists:
Once your watchlist is set, take the next step and trade with confidence using StocksToTrade’s robust platform. Don’t miss out — grab your 14-day trial for just $7 and experience the edge you need to thrive in today’s fast-paced markets.