
Gerdau S.A. stocks have been trading down by -6.57 percent amid bearish sentiment over weakening global steel demand.
Click Here for a Millionaire's POV on Trading GGB
SUBSCRIBE FOR ALERTSJOIN 50,000+ ACTIVE TRADERS
Key Takeaways
- Shares of GGB have slipped from recent highs near $5.30 and are now consolidating around the mid‑$4.70s, a key short‑term support zone traders are tracking.
- Daily and intraday charts show GGB stuck in a tight range, signaling indecision but giving active traders clear risk levels for day and swing trades.
- Gerdau S.A. carries solid equity of roughly $53.6B versus $27.9B in liabilities, giving GGB balance‑sheet strength compared with many cyclical peers.
- Valuation on GGB looks compressed on sales and book value, while a dividend yield above 3% adds another dimension for longer‑term trading theses.
Live Update At 15:02:41 EDT: On Monday, October 26, 2026 Gerdau S.A. stock [NYSE: GGB] is trending down by -6.57%! Discover the key drivers behind this movement as well as our expert analysis in the detailed breakdown below.
Quick Financial Overview
Gerdau S.A., the steel producer behind GGB, is trading like a classic cyclical name in a cooling tape. Over the last few weeks, GGB has bounced between roughly $4.80 and $5.30, with the latest close near $4.77 after a failed morning push over $5.20. That fade tells traders the $5.20–$5.30 area is acting as near‑term supply.
On the fundamentals, Gerdau S.A. generated about $67.0B in revenue over the last year. Profit before tax runs near a 19% margin, a solid number for a steel name tied to global demand and pricing cycles. GGB’s return on equity around 9.6% and return on assets near 6.1% show the business is profitable, not a zombie.
More Breaking News
- Comcast CMCSA Slides As Analysts Slash Price Targets
- BSBR Stock Slumps As Sellers Test Support Zone
- Everpure Inc. Stock Holds Gains As Bullish Trend Firms Up
- AudioEye Falls 9% Ahead of Earnings
What jumps out for traders is valuation. GGB trades at about 0.74 times sales and roughly 0.97 times book value per share, meaning the market prices Gerdau S.A. close to its net assets. With an enterprise value near $11.9B and a dividend yield around 3.5%, GGB offers both potential value and income angles. The flip side: a P/E near 38 signals earnings are currently depressed versus price, so traders should treat this as a late‑cycle steel play, not a growth darling.
Why Traders Are Watching GGB Price Action
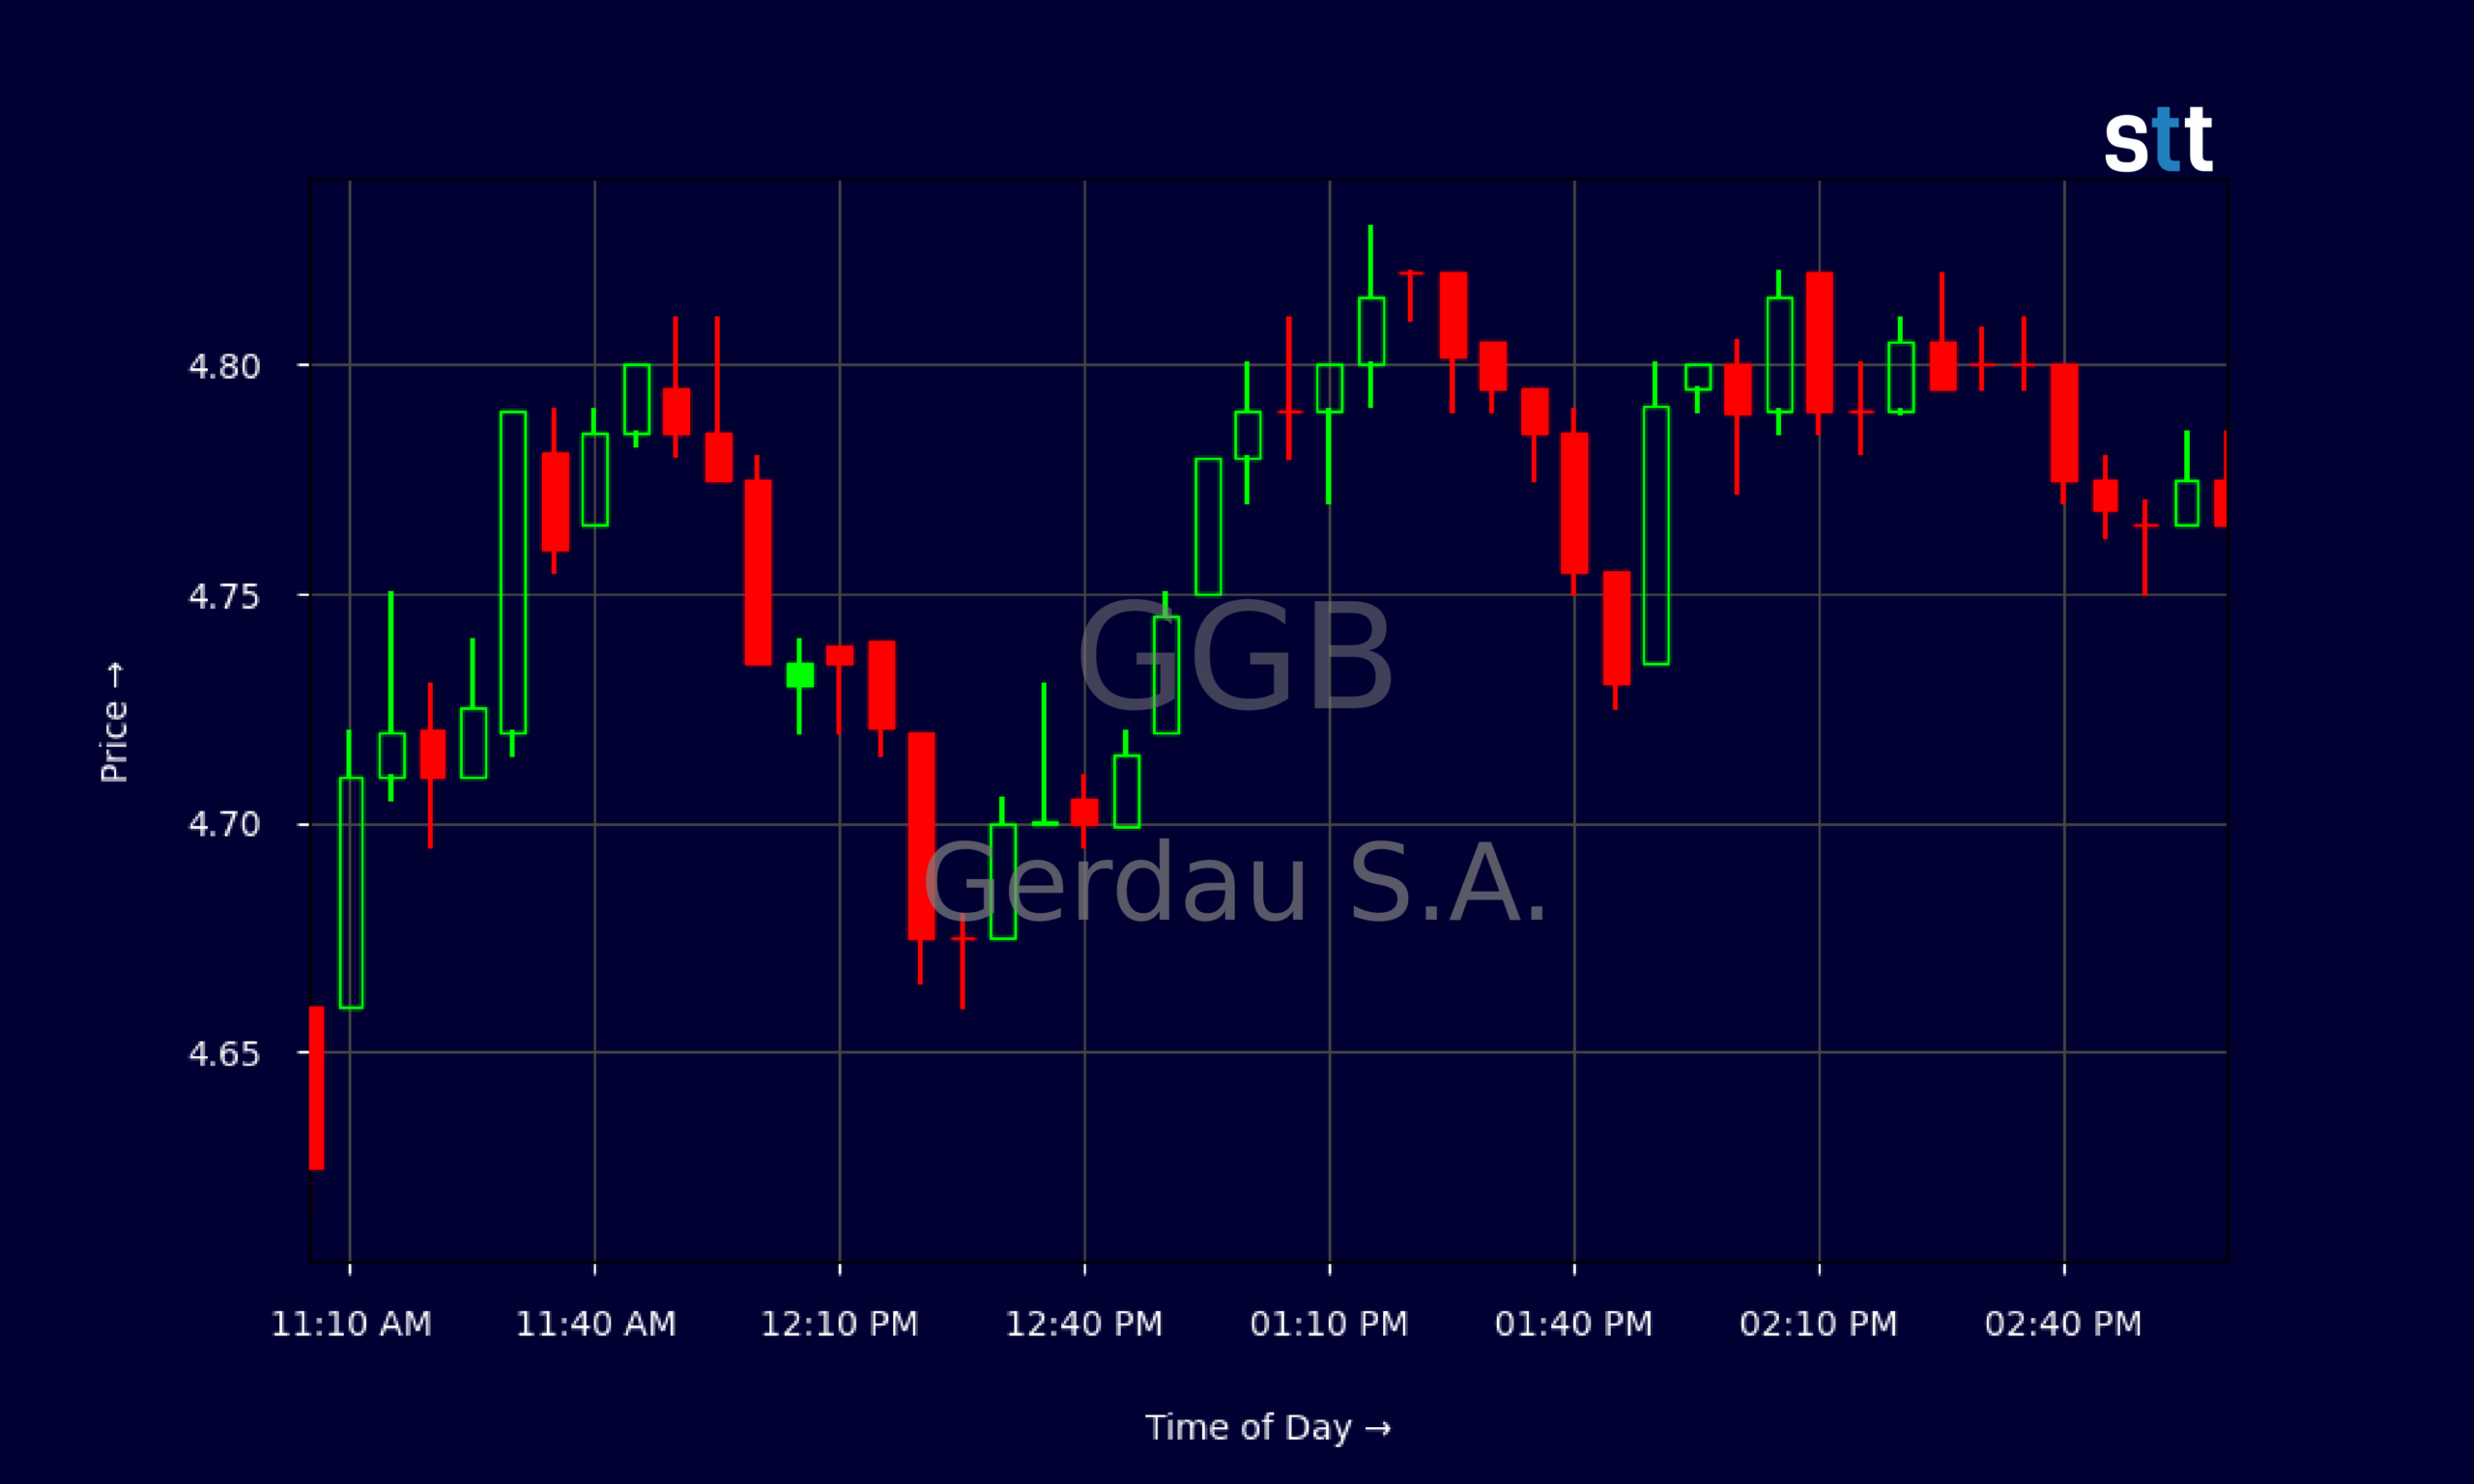
The chart is doing the talking here. GGB opened the latest session at $5.02, spiked to $5.20 right out of the gate, then sold off hard to the low $4.60s before grinding back toward $4.77 into the close. That intraday round‑trip shows aggressive selling into strength, followed by steady dip buying — classic tug‑of‑war behavior in a stock at an inflection zone.
Zooming out to the daily candles, GGB ran from about $4.72 on 2026/10/01 to highs above $5.45 earlier in the month, then bled lower with several closes clustered around $5.10–$5.20 before this latest break into the $4.70s. For short‑term traders, that makes $4.60–$4.70 the key support area and $5.20–$5.30 the near‑term resistance band. Gerdau S.A. will likely attract momentum traders each time it approaches either end of that range.
Under the hood, the balance sheet of Gerdau S.A. backs up why value‑oriented traders keep GGB on watch. Total assets sit near $81.7B, with equity of about $53.6B and total liabilities around $27.9B. Long‑term debt of roughly $13.2B looks manageable against that equity stack, especially with working capital north of $18.7B and cash plus short‑term investments around $6.4B. That financial cushion gives GGB staying power through steel price cycles, which matters when macro headlines shake the commodity space.
Combine that with a steady dividend rate that translates into a yield over 3%, and GGB becomes more than just a day‑trading ticker. It’s a cyclical value chart where both short‑term pattern traders and longer‑horizon swing traders can build plans off clear levels and solid fundamentals.
Conclusion
For active traders, GGB is all about balancing the chart with the capital structure of Gerdau S.A. The daily candles show a stock pulling back from recent highs, now congestion‑trading near support in the mid‑$4.70s. That sets up a simple trading framework: use $4.60–$4.70 as a key risk zone and watch the $5.20–$5.30 area for potential breakouts or failed moves to fade.
On the fundamental side, Gerdau S.A. brings in strong revenue, generates positive returns on capital, and runs a balance sheet where equity meaningfully outweighs liabilities. Valuation on GGB looks compressed versus sales and book value, while the dividend yield gives patient traders a little buffer while they wait for the next macro swing in steel and infrastructure demand.
The edge, as always, comes from preparation. Study how GGB reacts at these levels, map the intraday support and resistance, and size positions so one wrong move doesn’t wreck the account. As Tim Sykes loves to remind traders, “the best traders are cowards — they respect risk, cut losses fast, and only push hard when the odds are stacked in their favor.” In the same spirit of disciplined trading, As Tim Bohen, lead trainer with StocksToTrade says, “If you’re still guessing at the end of your analysis, it’s probably not a trade worth taking.” GGB is offering a clean classroom in that mindset right now. This analysis is for educational and research purposes only, and every trader must make their own decisions.
This is stock news, not investment advice. StocksToTrade News delivers real-time stock market updates tailored to highlight the key catalysts driving short-term price movements. Our coverage is designed for active traders and investors who thrive in fast-moving markets, with a focus on volatile sectors like penny stocks, AI stocks, Robinhood stocks and other momentum plays. From earnings reports and FDA approvals to mergers, new contracts, and unusual trading volume, we break down the events that can spark significant price action.
Looking to level up your trading game? Explore StocksToTrade, the ultimate platform for traders. With powerful tools designed for swing and day trading, integrated news scanning, and even social media monitoring, StocksToTrade keeps you one step ahead.
Check out our quick startup guide for new traders!
- How to Read Stock Charts: A Guide for Beginners
- Trading Plan: 6 Steps to Create One
- How To Create a Stock Watchlist
Ready to build your watchlists? Check out these curated lists:
Once your watchlist is set, take the next step and trade with confidence using StocksToTrade’s robust platform. Don’t miss out — grab your 14-day trial for just $7 and experience the edge you need to thrive in today’s fast-paced markets.