

Gemini Space Station Inc. stocks have been trading up by 7.16 percent after announcing a transformative deep-space infrastructure partnership.
What Traders Need To Know
- Stock jumped about 21% after Q1 results showed a narrower net loss and revenue above analyst estimates, signaling strong bullish reaction.
- Price spiked intraday toward the high $6 area before fading, showing aggressive profit-taking after the initial surge.
- Recent weekly candles show a sharp move from sub-$5 levels into the mid-$6s, confirming a momentum shift.
- Revenue growth and reduced losses contrast with still-weak margins and heavy cash burn, keeping GEMI a high-risk, high-reward trading vehicle.
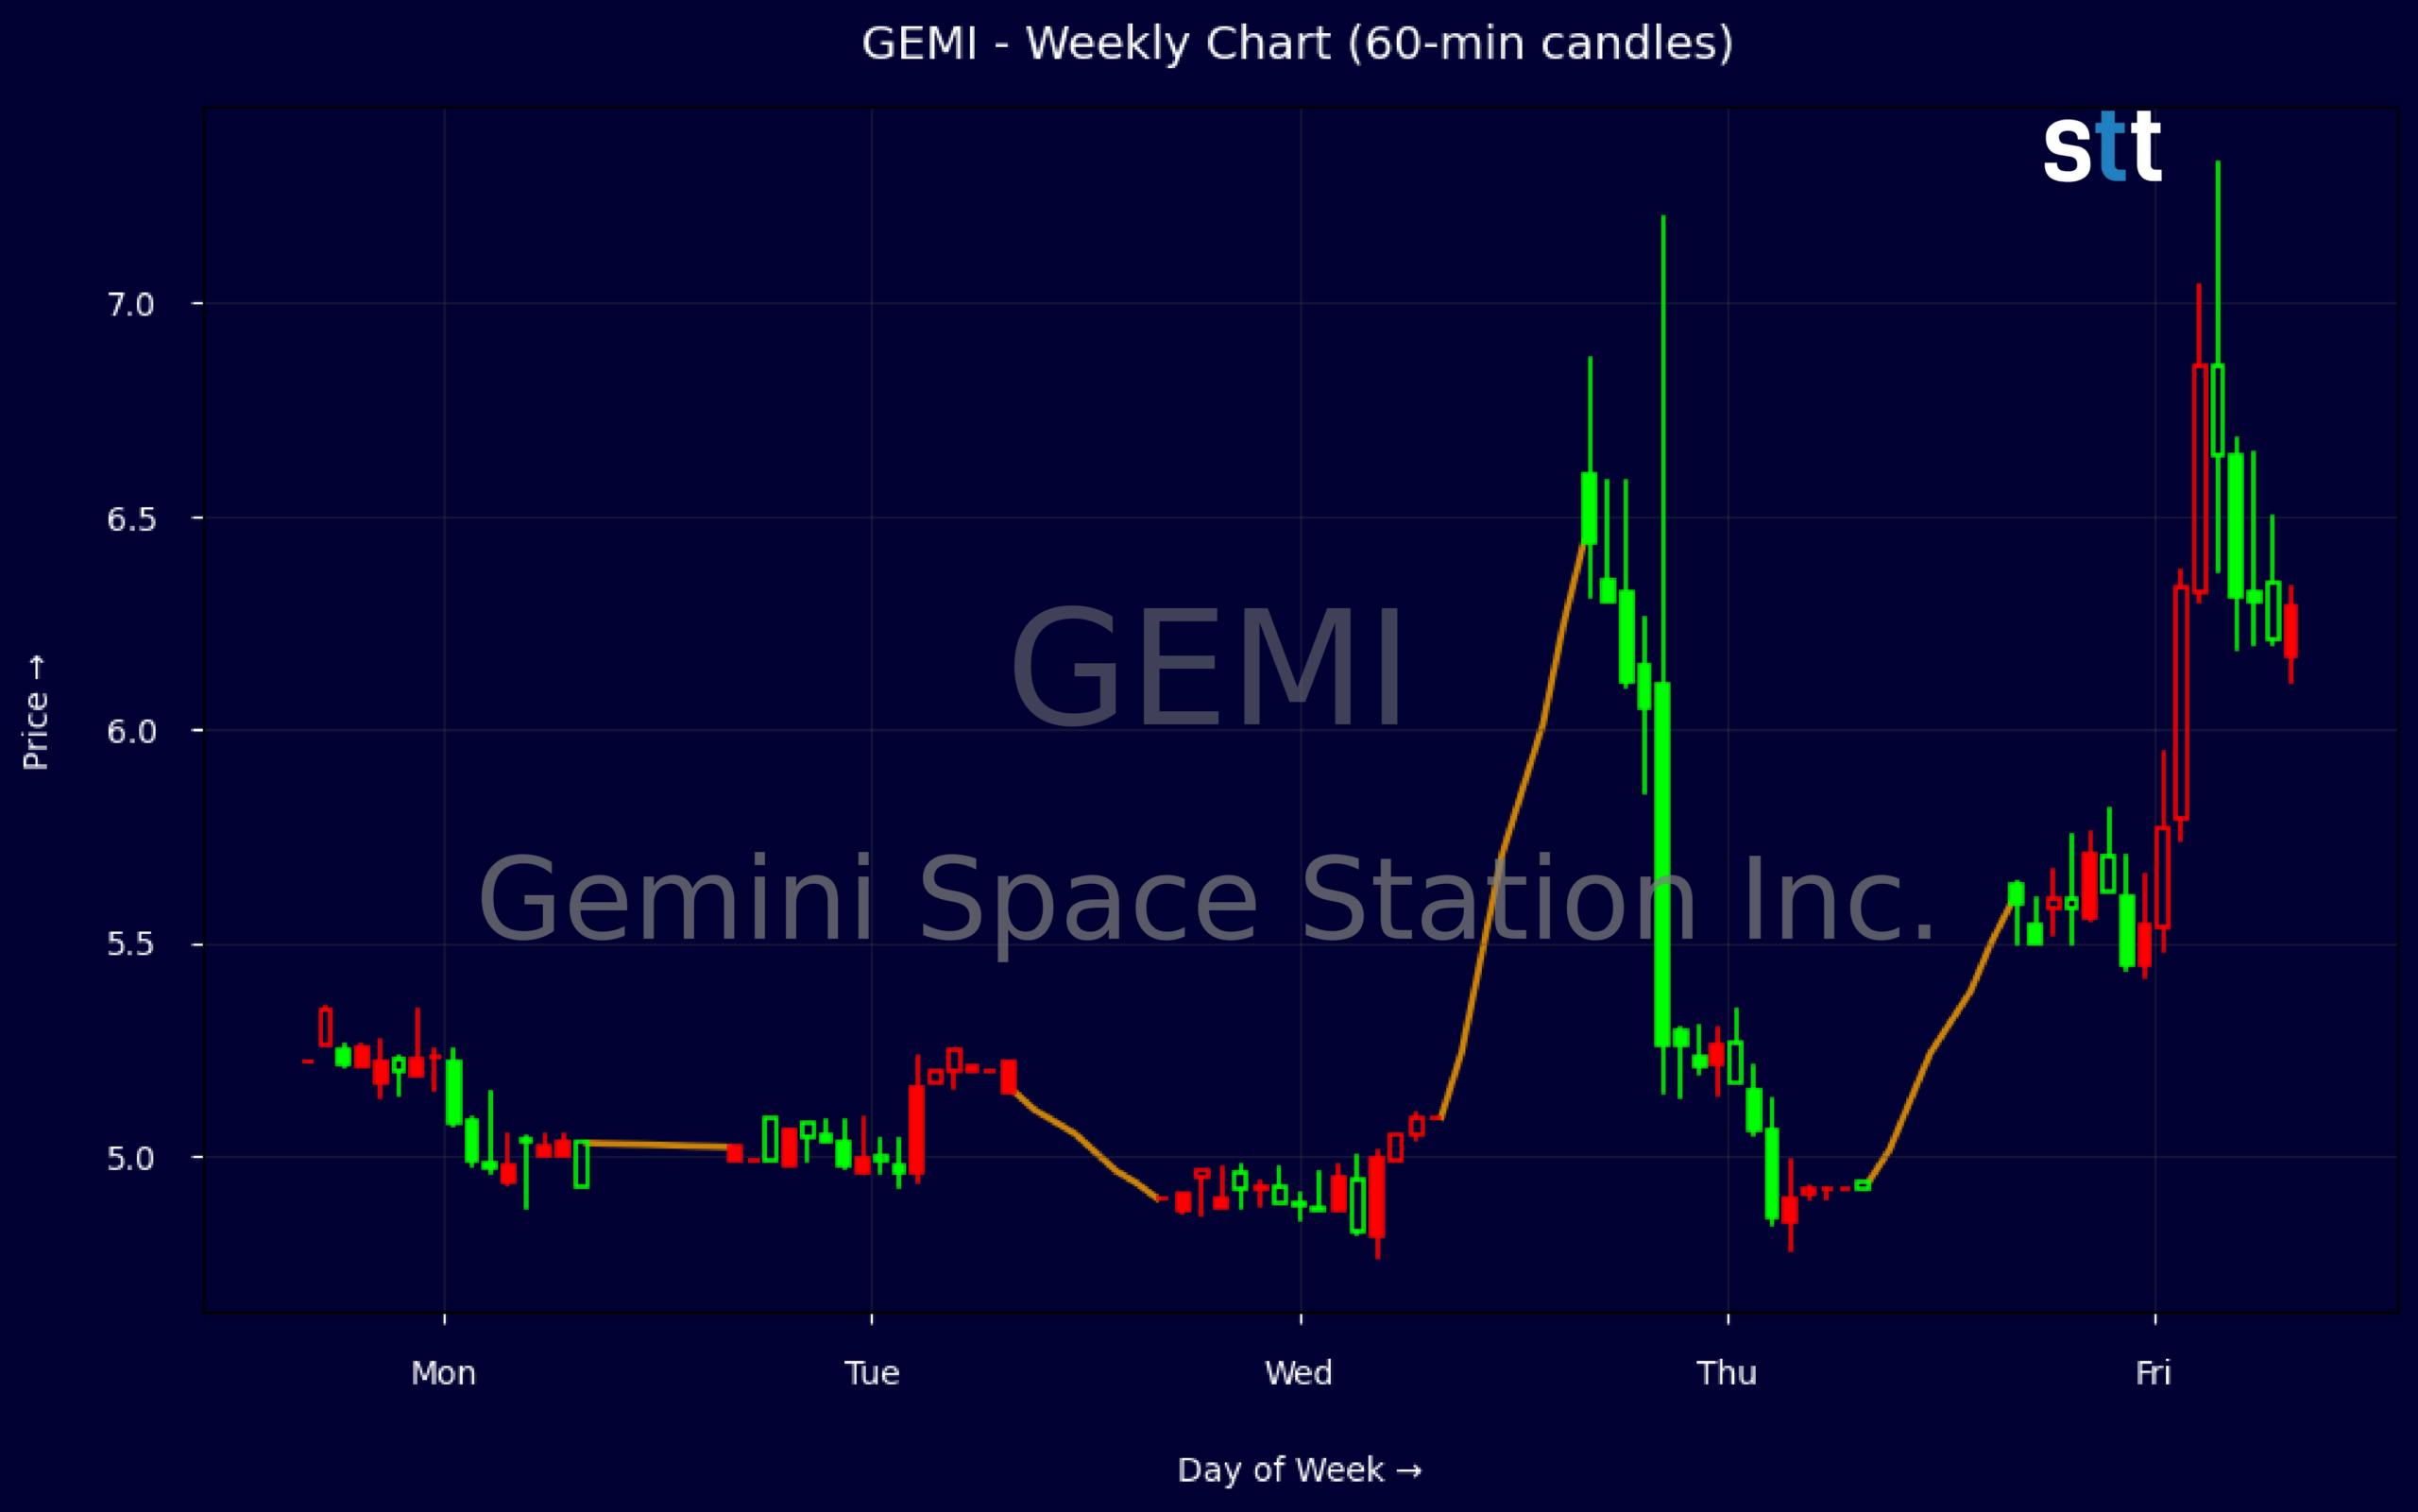
Weekly Update May 11 – May 15, 2026: On Sunday, May 17, 2026 Gemini Space Station Inc. stock [NASDAQ: GEMI] is trending up by 7.16%! Discover the key drivers behind this movement as well as our expert analysis in the detailed breakdown below.
Finance industry expert:
Analyst sentiment – neutral
Gemini Space Station (GEMI) is a high‑risk, early‑stage platform with weak fundamentals despite solid topline scale (TTM revenue about $180m, P/S ~13x). Margins are deeply negative (pretax margin roughly -318%, Q1 EBITDA -$99m, EBIT -$106m), with ROE of -24% and ROA of -7%, indicating structurally loss‑making operations. Q1 operating cash outflow of $54m and free cash flow of -$56m underscore heavy cash burn, partially mitigated by $216m cash and modest long‑term debt (~$19m, leverage ratio 3.6).
Technically, GEMI shows a short‑term bullish reversal off the sub‑$5 area, with the stock rebounding from a 4.90–5.00 base to a 6.87 spike before consolidating around 5.60–6.50. The dominant near‑term trend is up, with recent five‑minute candles showing strong intraday buying on elevated volume on positive news, then orderly pullbacks. A key actionable level is support at $5.00; aggressive traders can buy dips near $5.00 with a tight stop below $4.80.
More Breaking News
- HII Stock Climbs As Navy Contracts And Dividend Hike Fuel Momentum
- NVDA Stock Rebounds As Traders Weigh Trump Sale News
- NCPL Plunges As SEC Fraud Charges Ignite Class Actions
- Pinterest Stock Slips As Revenue Misses Rattle Traders
The 21% post‑earnings move reflects sentiment shift after GEMI delivered narrower Q1 losses and revenue above expectations, outperforming many Finance and Capital Markets peers on growth but lagging materially on profitability. Versus sector benchmarks, valuation is rich for the current loss profile, but balance sheet liquidity buys time. Near‑term, upside is capped near $7.00 resistance, with secondary support around $5.50. Base‑case 6–12 month trading range: $5.00–$7.00, with a neutral risk‑reward skew.
Quick Financial Overview
Gemini Space Station Inc. (GEMI) delivered a Q1 update that the market clearly liked. The key headline was simple: revenue came in above analyst expectations while the net loss narrowed versus prior periods. For a company still deep in the red, that mix of top-line strength and improving bottom-line profile often triggers short-term re-pricing, and that is exactly what we saw with the roughly 21% spike.
Under the hood, GEMI is still a loss-making growth story. The latest income statement shows about $50.3M in quarterly revenue, but net income was roughly -$109M, with an EBITDA of about -$99M. That lines up with a pretax profit margin of around -317.5%, which is extremely negative. So while the loss is narrowing, traders must keep in mind this is not a profitability story yet; it is a “less bad” story that the market rewarded.
On the balance sheet, Gemini Space Station Inc. holds about $215.6M in cash and roughly $1.52B in total assets, against about $1.07B in total liabilities and equity near $456.1M. Book value per share sits near $5.49, with price-to-book around 1.02 and price-to-sales around 13.13, so the market is paying a premium for growth potential. Cash flow remains a concern: operating cash flow was around -$54.4M for the quarter and free cash flow roughly -$56.6M, even after sizable non-cash items like $24.2M in stock-based compensation.
The chart reflects this tension between hope and risk. On the weekly data, GEMI traded down into the high $4s earlier in the week, then exploded to a high near $6.87 and closed around $6.49 on the big Q1 reaction day. That is a classic momentum candle: wide range, strong close, heavy range expansion after a quiet base. Intraday 5-minute data shows a spike from the mid-$6s up toward almost $7 before fading back toward $5.58, which tells us early buyers took profits quickly and late chasers got trapped.
Conclusion
This is stock news, not investment advice. StocksToTrade News delivers real-time stock market updates tailored to highlight the key catalysts driving short-term price movements. Our coverage is designed for active traders and investors who thrive in fast-moving markets, with a focus on volatile sectors like penny stocks, AI stocks, Robinhood stocks and other momentum plays. From earnings reports and FDA approvals to mergers, new contracts, and unusual trading volume, we break down the events that can spark significant price action.
Looking to level up your trading game? Explore StocksToTrade, the ultimate platform for traders. With powerful tools designed for swing and day trading, integrated news scanning, and even social media monitoring, StocksToTrade keeps you one step ahead.
Check out our quick startup guide for new traders!
- How to Read Stock Charts: A Guide for Beginners
- Trading Plan: 6 Steps to Create One
- How To Create a Stock Watchlist
Ready to build your watchlists? Check out these curated lists:
Once your watchlist is set, take the next step and trade with confidence using StocksToTrade’s robust platform. Don’t miss out — grab your 14-day trial for just $7 and experience the edge you need to thrive in today’s fast-paced markets.