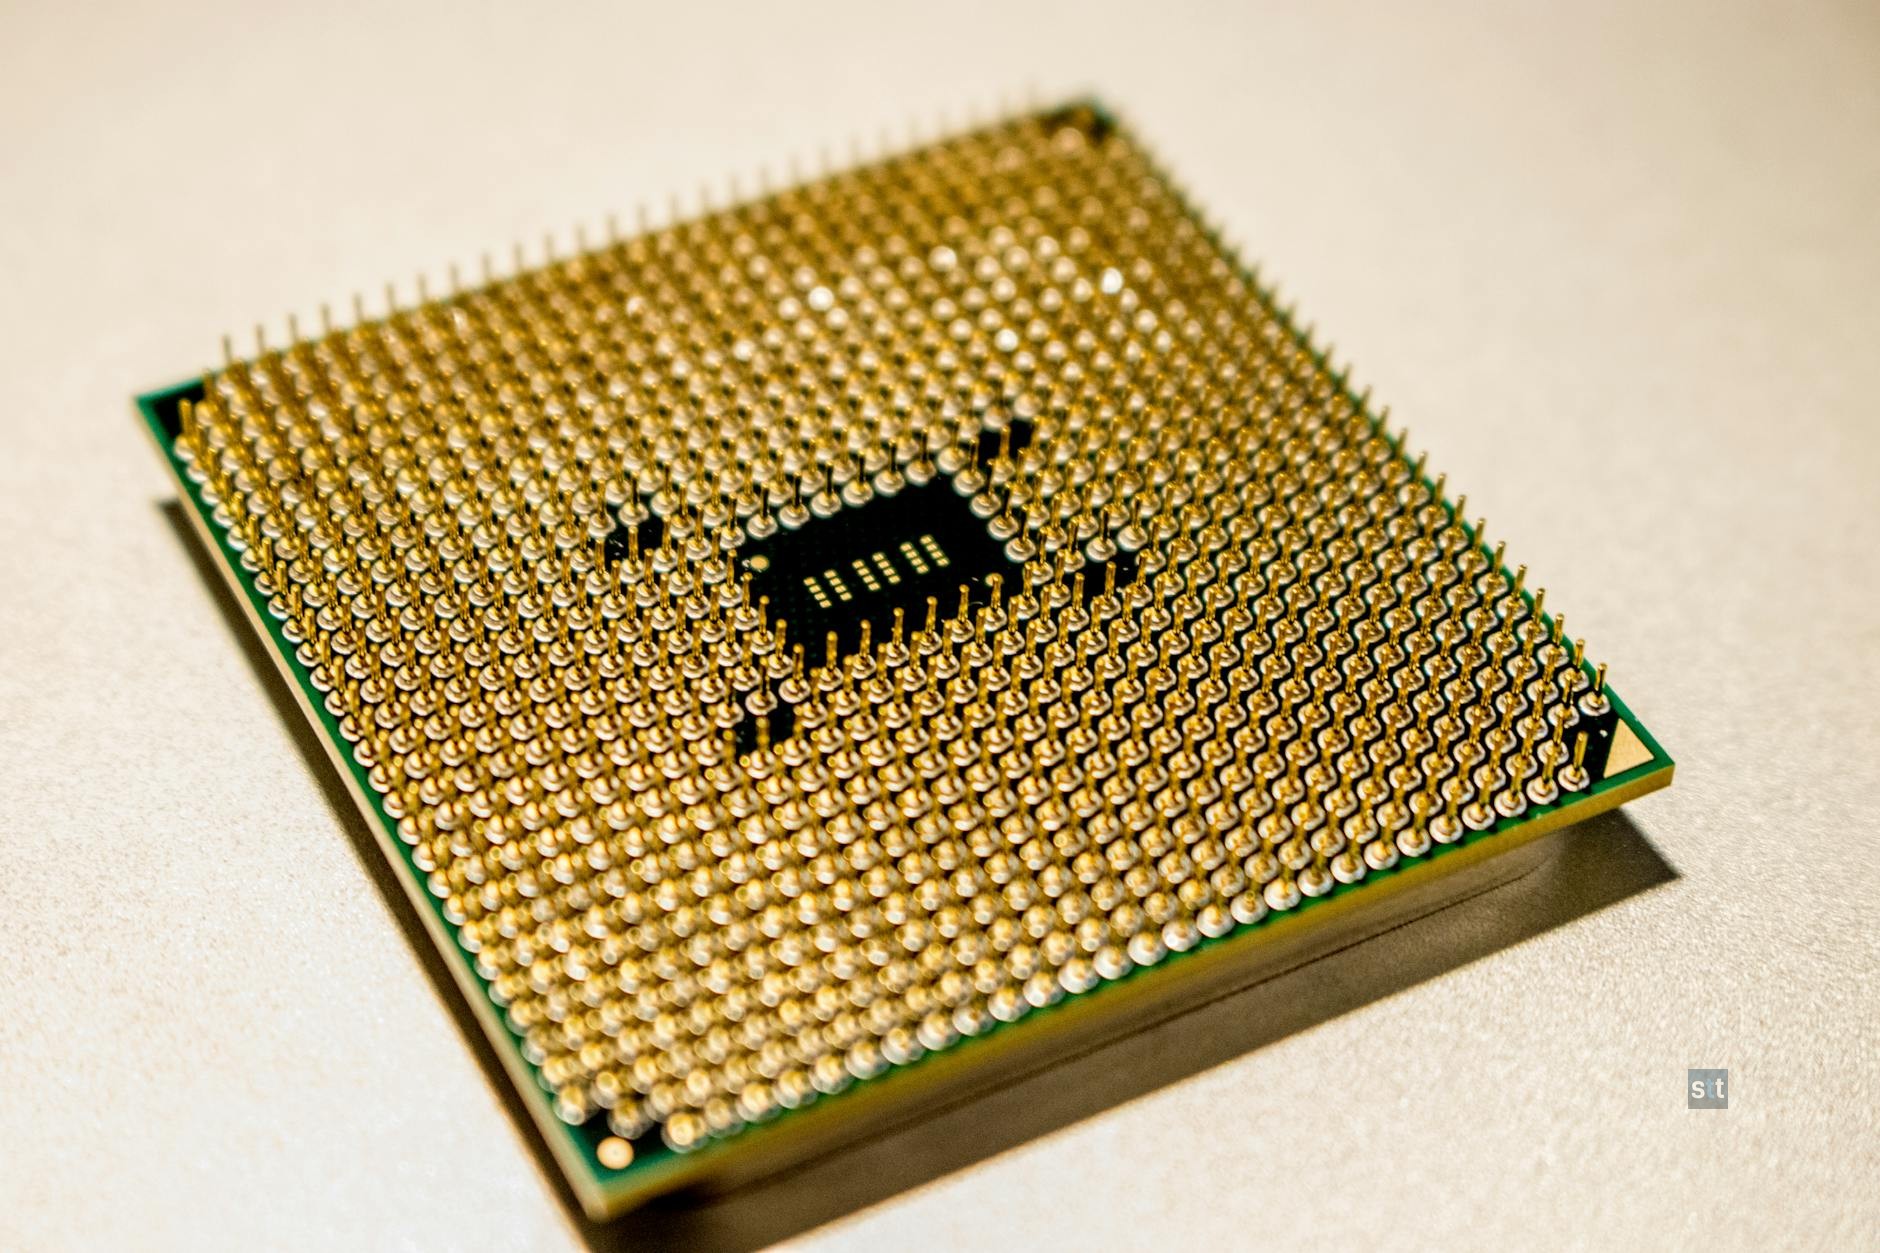

GCT Semiconductor Holding Inc. stocks have been trading up by 31.25 percent amid bullish sentiment on its 5G chipset prospects.
Market Insights For GCT Semiconductor Holding Inc.
- Weekly chart shows GCTS rebounding from a mid-week dip near $1.40 and closing higher around $1.89, signaling renewed short-term buying interest.
- Intraday move from roughly $1.35 to $1.83 on a single wide-range session points to aggressive momentum trading and potential short-covering.
- Financials show GCT Semiconductor Holding Inc. generating about $2.9M in quarterly revenue but posting heavy operating and net losses.
- Balance sheet reveals negative equity and tight liquidity, with a very low current ratio and significant short-term debt.
- Traders in GCTS must balance explosive price swings against substantial ongoing cash burn and deeply negative margins.

Weekly Update May 11 – May 15, 2026: On Sunday, May 17, 2026 GCT Semiconductor Holding Inc. stock [NYSE: GCTS] is trending up by 31.25%! Discover the key drivers behind this movement as well as our expert analysis in the detailed breakdown below.
Technology industry expert:
Analyst sentiment – negative
GigaCloud Technology Solutions (GCTS) is in an extremely weak fundamental position, effectively a distressed micro-cap with negligible scale: Q1 revenue of ~$1.9M against an enterprise value of ~$203M implies a price-to-sales of ~35x despite deeply negative margins (EBIT margin roughly -400%+ on the quarter, -1200%+ on trailing figures). Equity is negative ($74M), working capital is deeply underwater (current ratio ~0.2; current debt ~$52M vs cash ~$7.2M), and ROA below -100% underscores an unsustainable capital structure.
Technically, GCTS has shifted from a mid-range consolidation into a short-term upside breakout attempt: over the last five sessions, price rebounded from a 1.40–1.50 base to close near 1.89, with a wide-range bar on the last session (1.83–2.05 intraday, close below high), signaling emerging but fragile upside momentum. Assuming elevated volume confirmed the breakout, the key actionable trading level is support at 1.60–1.65; a sustained break below 1.60 would invalidate the rebound, while upside traders should use 2.05 as the next resistance/target.
More Breaking News
- NOK Stock Slides As Earnings Strength Fails To Impress Traders
- WFF Stock Plunges Then Bases As Volatility Grips Chart
- CMCSA Stock Grinds Higher As Earnings Beat Meets Big Restructure
- CIFR Stock Slides As Volatility Grips Cipher Mining
With no material recent news, the stock trades as a speculative restructuring and balance-sheet event play rather than a fundamentals-based Technology/Semiconductors peer. Sector benchmarks enjoy positive earnings, scale, and healthier leverage, while GCTS carries negative equity, heavy short-term debt, and structurally loss-making operations. My verdict is outright negative: risk/reward is poor absent a clear recapitalization catalyst. For trading, resistance sits at 2.05 then 2.40, support at 1.60 and 1.40; any price above 2.50 would be driven purely by speculative flows, not fundamentals.
Quick Financial Overview
GCTS is trading like a speculative small-cap, with price action that can move sharply in a single session. On the weekly chart, GCT Semiconductor Holding Inc. dipped toward the mid-$1.40s, then pushed back to roughly $1.89, which is near the top of the recent weekly range. That recovery after weakness suggests active short-term traders are willing to step in on pullbacks, but the swings also highlight elevated risk.
The intraday data reinforces that picture. A 5-minute bar showing a drive from about $1.35 to a high near $1.87 and closing around $1.83 is a classic momentum spike. Moves like this often come with high volume and short covering, and they rarely stay quiet afterward. For traders, this kind of behavior means tight risk controls and clear trade plans are essential, because the tape can flip quickly.
Under the surface, the fundamentals are very weak. GCT Semiconductor Holding Inc. reported roughly $1.9M in quarterly revenue, but operating income came in near -$6.1M and net income around -$9.9M. Margins are deeply negative, with profit metrics well below zero and a price-to-sales ratio above 35, which is high given the losses. Cash at about $7.2M sits against current liabilities above $74M, a current ratio near 0.2, and negative equity around -$74M, all pointing to financial stress that traders cannot ignore.
Conclusion
The Risk-Reward Picture For Active Traders GCTS sits at the intersection of violent price action and stressed financials, which is exactly where short-term traders often look for opportunity. The recent weekly bounce from the $1.40s to the high-$1.80s shows that GCT Semiconductor Holding Inc. can move fast when momentum flips, especially with intraday spikes like the run from about $1.35 to $1.83. For day traders and scalpers, this kind of behavior can offer clean setups, but only if entries and exits are tightly defined.
At the same time, the income statement and balance sheet tell a clear story of pressure. Heavy quarterly losses near $9.9M, negative gross margin, and substantial cash burn, alongside a current ratio near 0.2 and negative equity, frame GCTS as a high-risk name. Any pullback from these levels could be sharp if sentiment turns, while further upside likely depends on continued speculative interest rather than strong fundamentals.
For traders, the focus should be on the chart levels created by the recent range, the speed of intraday moves, and the persistent downside risk from the company’s financial position. As I tell my students, “You can trade a weak company’s stock, but you cannot trade it blindly — price action is your edge, and risk management is your only defense.” As Tim Bohen, lead trainer with StocksToTrade says, “Success in trading is more about cutting losses quickly than finding winners.”.”,”scores”:{“risk-level”:”high”},”trade”:”false”
This is stock news, not investment advice. StocksToTrade News delivers real-time stock market updates tailored to highlight the key catalysts driving short-term price movements. Our coverage is designed for active traders and investors who thrive in fast-moving markets, with a focus on volatile sectors like penny stocks, AI stocks, Robinhood stocks and other momentum plays. From earnings reports and FDA approvals to mergers, new contracts, and unusual trading volume, we break down the events that can spark significant price action.
Looking to level up your trading game? Explore StocksToTrade, the ultimate platform for traders. With powerful tools designed for swing and day trading, integrated news scanning, and even social media monitoring, StocksToTrade keeps you one step ahead.
Check out our quick startup guide for new traders!
- How to Read Stock Charts: A Guide for Beginners
- Trading Plan: 6 Steps to Create One
- How To Create a Stock Watchlist
Ready to build your watchlists? Check out these curated lists:
Once your watchlist is set, take the next step and trade with confidence using StocksToTrade’s robust platform. Don’t miss out — grab your 14-day trial for just $7 and experience the edge you need to thrive in today’s fast-paced markets.