
Galaxy Digital Inc. stocks have been trading up by 7.97 percent amid bullish sentiment on rising institutional crypto adoption.
Click Here for a Millionaire's POV on Trading GLXY
SUBSCRIBE FOR ALERTSJOIN 50,000+ ACTIVE TRADERS
Key Takeaways
- Shares of GLXY have fallen from the low $20s to near $17, breaking a short-term uptrend and signaling shifting momentum.
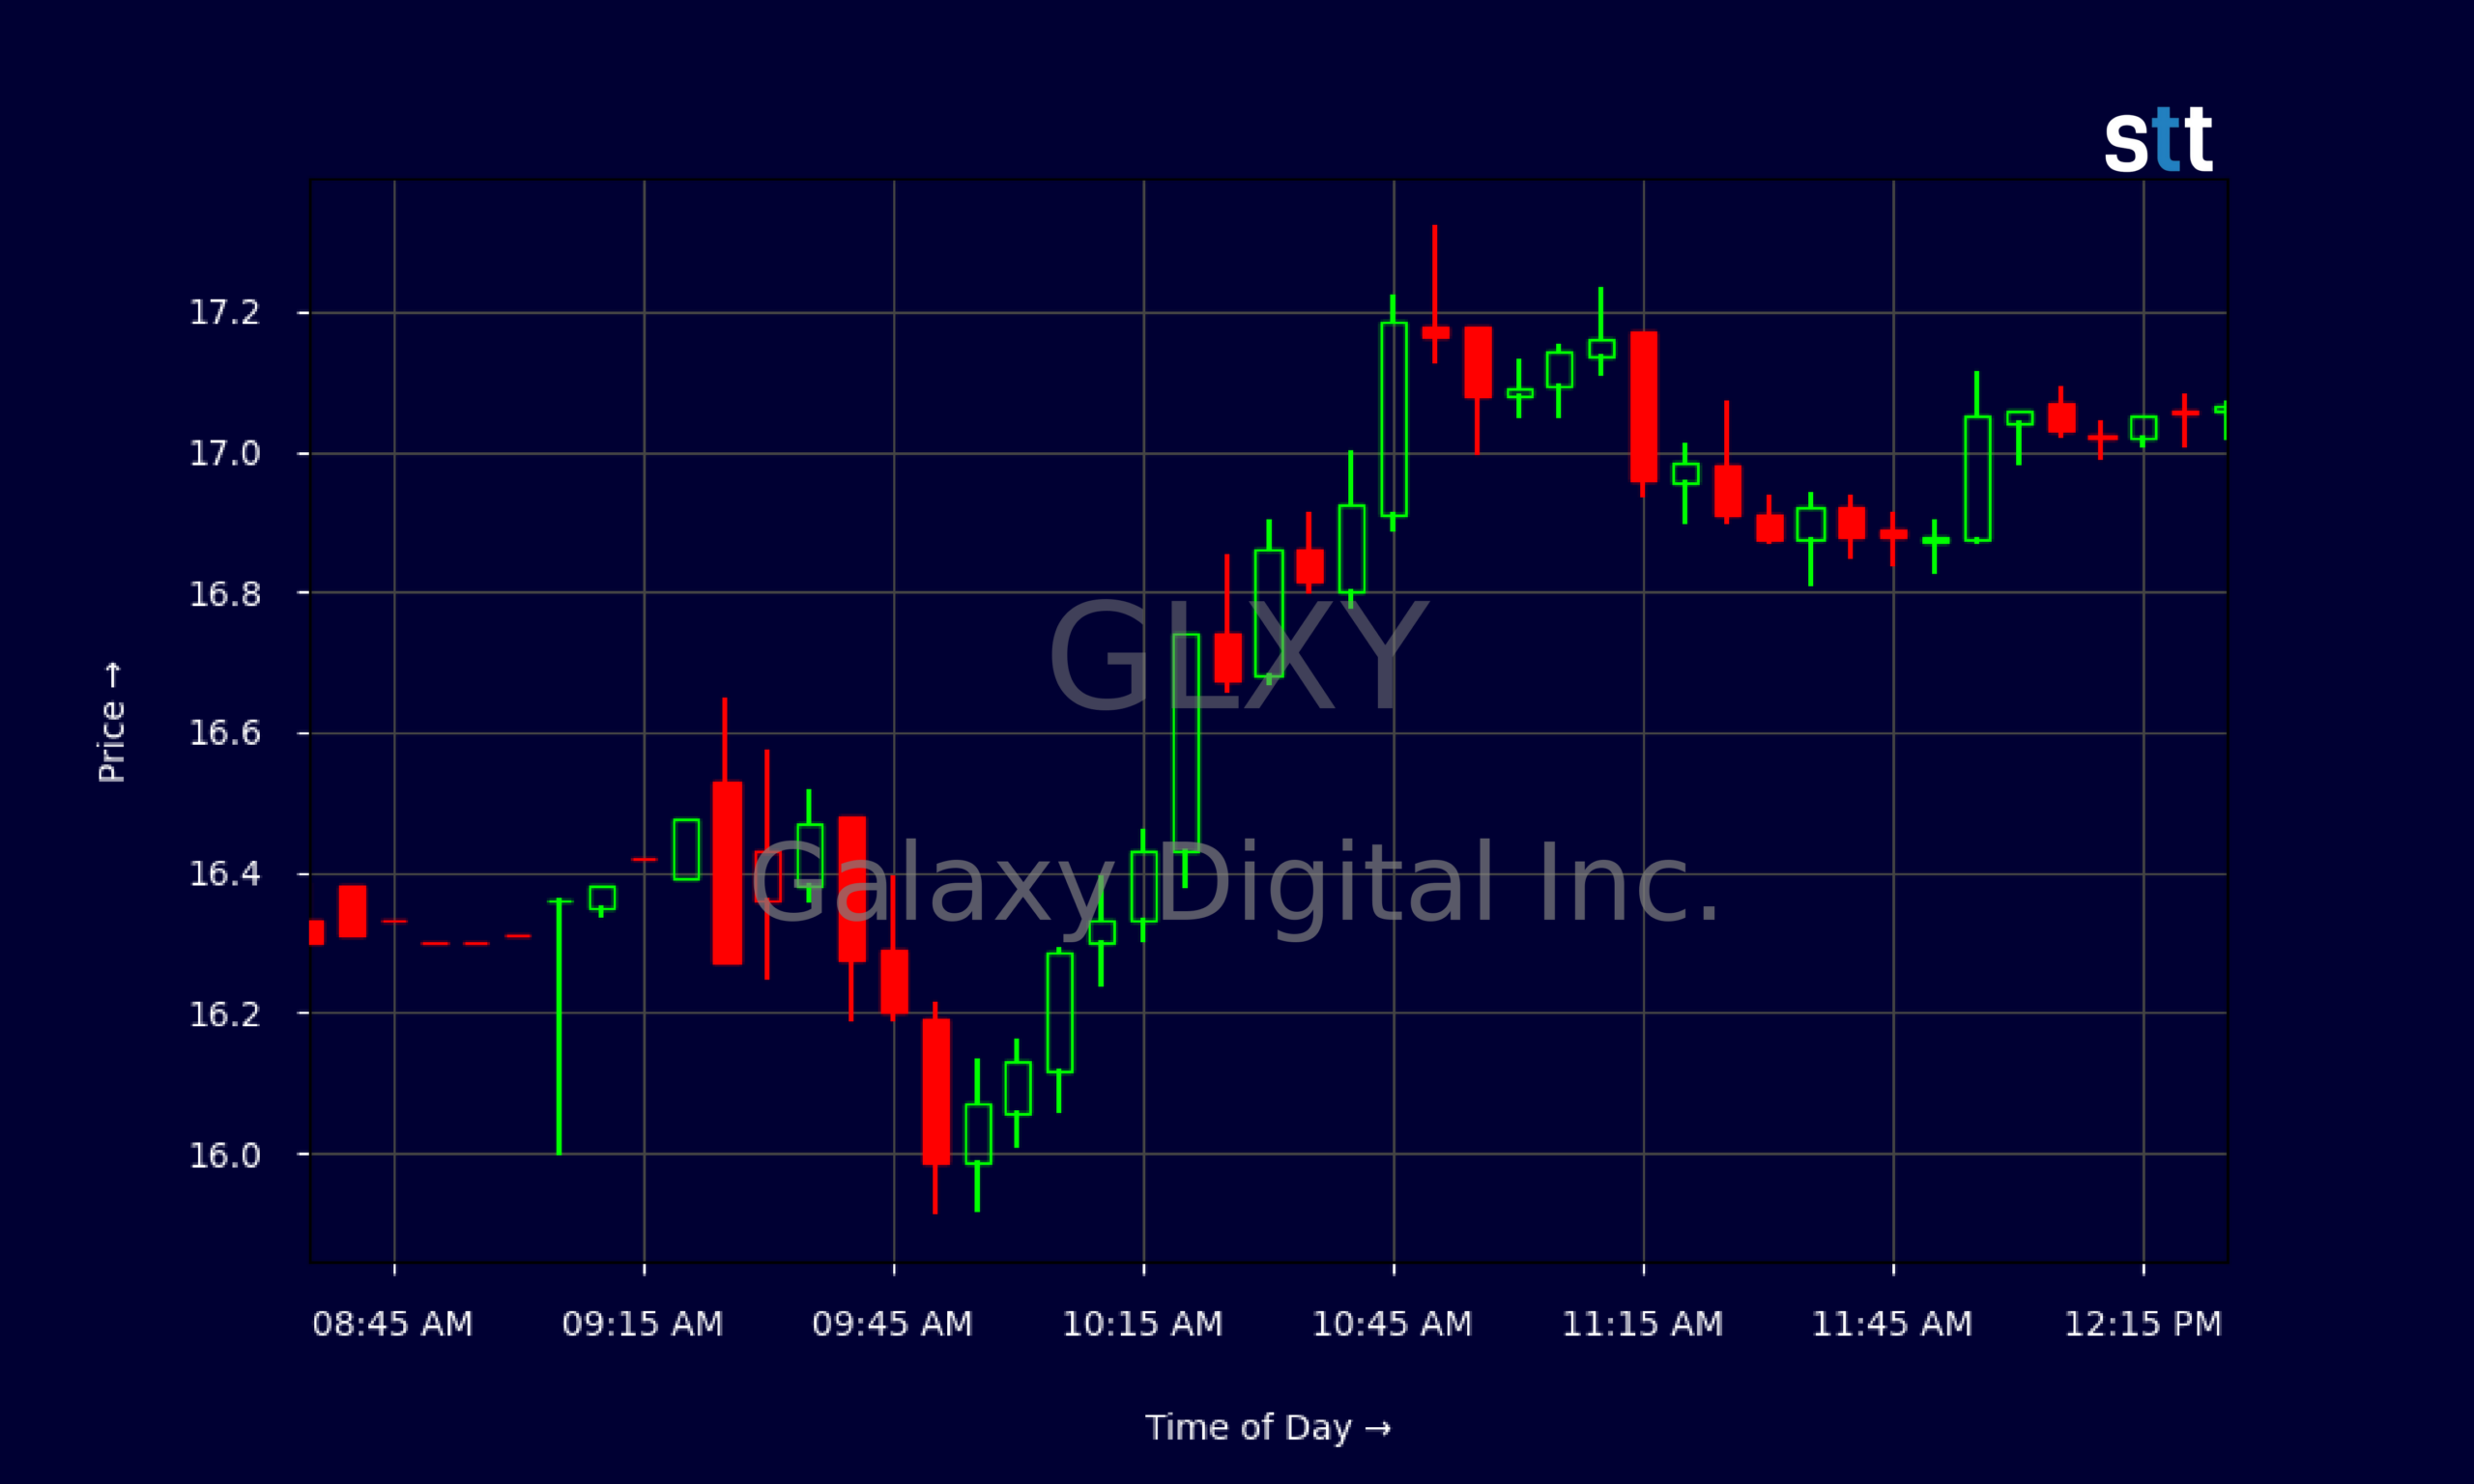
- Recent intraday trading in GLXY shows a sharp morning push off the lows, followed by tight midday consolidation around $17.
- Galaxy Digital Inc. is generating strong revenue, but GLXY still shows negative earnings and weak profitability ratios.
- The balance sheet for Galaxy Digital Inc. carries meaningful debt but also solid liquidity, giving GLXY room to ride sector volatility.
- Active traders are tracking GLXY around recent lows as a key line in the sand for the next move.
Live Update At 12:32:21 EDT: On Wednesday, October 21, 2026 Galaxy Digital Inc. stock [NASDAQ: GLXY] is trending up by 7.97%! Discover the key drivers behind this movement as well as our expert analysis in the detailed breakdown below.
Quick Financial Overview
GLXY is a classic story of big revenue, thin margins, and heavy trading swings. Galaxy Digital Inc. booked roughly $6.04B in revenue over the last period, yet the company is still losing money on the bottom line. Profit margins are negative across the board, with profit margin near -0.78% and return on equity running around -11% to -27% depending on the lookback. For traders, that means GLXY is not a steady cash cow; it is a volatility vehicle tied to sentiment and sector flows.
More Breaking News
- AHT Stock Pops As Fee Waiver And Buyback Pledge Ease Dilution Fears
- SPHR Stock Slides As Sphere’s Wizard Of Oz Cash Machine Meets Wall Street Doubt
- ENVX Stock Jumps As Drone Battery Orders Ignite Growth Story
- SPCX Stock Climbs As Starlink Mobile And AI Bets Accelerate
On the plus side, Galaxy Digital Inc. shows strong top-line throughput. Asset turnover near 5.8 suggests GLXY is using its asset base aggressively to generate revenue, even if that revenue has not yet translated into lasting profits. Cash and short-term investments sit around $2.61B, with current assets clearly ahead of current liabilities. A current ratio near 1.5 and quick ratio near 1.1 tell traders that GLXY has enough liquidity to manage day-to-day swings, even with debt-to-equity above 1.0. In simple terms, Galaxy Digital Inc. is leveraged, unprofitable, but liquid enough to stay in the game while traders ride the chart.
Why Traders Are Watching GLXY Price Action
The chart on GLXY has the attention of momentum traders. Over the past few weeks, Galaxy Digital Inc. slid from the mid-$20s down toward the high teens. The daily data show GLXY topping near $24.50 earlier in the month, then making a steady series of lower highs: $23–$22, then $21–$20, and now a closing print near $17.02. That steady stair-step lower tells traders the trend has shifted from breakout mode to correction.
What stands out on GLXY is how quickly the character changed. Galaxy Digital Inc. went from trading above $23 on 2026/10/05 to closing near $17 just over two weeks later. That’s a drawdown of roughly 25% in a short window. For short sellers and reactive day traders, that’s opportunity. For late longs in GLXY, it’s pain.
Zooming into the intraday action, the 5‑minute chart shows GLXY opening around $16.43, dipping to the mid-$15.90s, and then grinding higher into the $17 area. That move off the low shows dip buyers still care about Galaxy Digital Inc., but the afternoon tape is tight. From late morning through early afternoon, GLXY oscillates in a narrow $16.85–$17.10 band. That’s textbook consolidation after a morning push.
For active traders, this kind of price action in GLXY often sets up the next leg. If Galaxy Digital Inc. can hold above the morning low and keep building higher lows intraday, short squeezes and scalp-long setups are on the table. If GLXY loses that low with volume, the downtrend on the daily chart can accelerate. Either way, the stock is tradable, and that’s what matters to short-term players.
Conclusion
GLXY sits at an important crossroads. On one side, Galaxy Digital Inc. shows eye‑catching revenue scale, strong asset turnover, and enough liquidity to keep swinging in a volatile market. On the other, profitability is deeply negative, leverage is real, and the chart has shifted from strength to pressure over the past couple of weeks. Traders looking at GLXY are not paying for steady dividends or predictable earnings; they are paying for motion.
Right now, that motion is down from the mid-$20s toward the high teens. The intraday bounce and midday coil around $17 tell chart readers that Galaxy Digital Inc. is trying to find a temporary floor. GLXY becomes especially interesting if it either reclaims the $18–$19 range on volume or cracks below the recent $15.90 area. Those are the battle lines many short-term traders will map out.
This is where the core rule from Tim Sykes’ community matters most: “Cut losses quickly; don’t marry a stock.” It also echoes a key mindset from veteran day trading educators: as Tim Bohen, lead trainer with StocksToTrade says, “For me, trading is more about managing risk than finding the next big mover.” GLXY offers range, volatility, and liquidity, but Galaxy Digital Inc. also carries real fundamental risk under the surface. For educational and research-focused traders, the job now is to study the GLXY chart, know the key levels, respect the risk, and let the price action—not hope—drive every trading decision.
This is stock news, not investment advice. StocksToTrade News delivers real-time stock market updates tailored to highlight the key catalysts driving short-term price movements. Our coverage is designed for active traders and investors who thrive in fast-moving markets, with a focus on volatile sectors like penny stocks, AI stocks, Robinhood stocks and other momentum plays. From earnings reports and FDA approvals to mergers, new contracts, and unusual trading volume, we break down the events that can spark significant price action.
Looking to level up your trading game? Explore StocksToTrade, the ultimate platform for traders. With powerful tools designed for swing and day trading, integrated news scanning, and even social media monitoring, StocksToTrade keeps you one step ahead.
Check out our quick startup guide for new traders!
- How to Read Stock Charts: A Guide for Beginners
- Trading Plan: 6 Steps to Create One
- How To Create a Stock Watchlist
Ready to build your watchlists? Check out these curated lists:
Once your watchlist is set, take the next step and trade with confidence using StocksToTrade’s robust platform. Don’t miss out — grab your 14-day trial for just $7 and experience the edge you need to thrive in today’s fast-paced markets.