

FuelCell Energy Inc. stocks have been trading up by 11.81 percent amid upbeat sentiment on clean-energy demand and project momentum.
What Traders Need To Know
- A recent Form 4 filing reports a change in beneficial ownership of FuelCell Energy securities by an insider or major holder.
- The filing does not state in this summary whether the insider transaction was a purchase or sale of FCEL shares.
- No information is given on the size or price of the ownership change, limiting how much traders can infer from the filing.
- Recent weekly candles show FCEL bouncing between roughly the low-$12s and high-$13s, signaling active short-term two-sided trade.
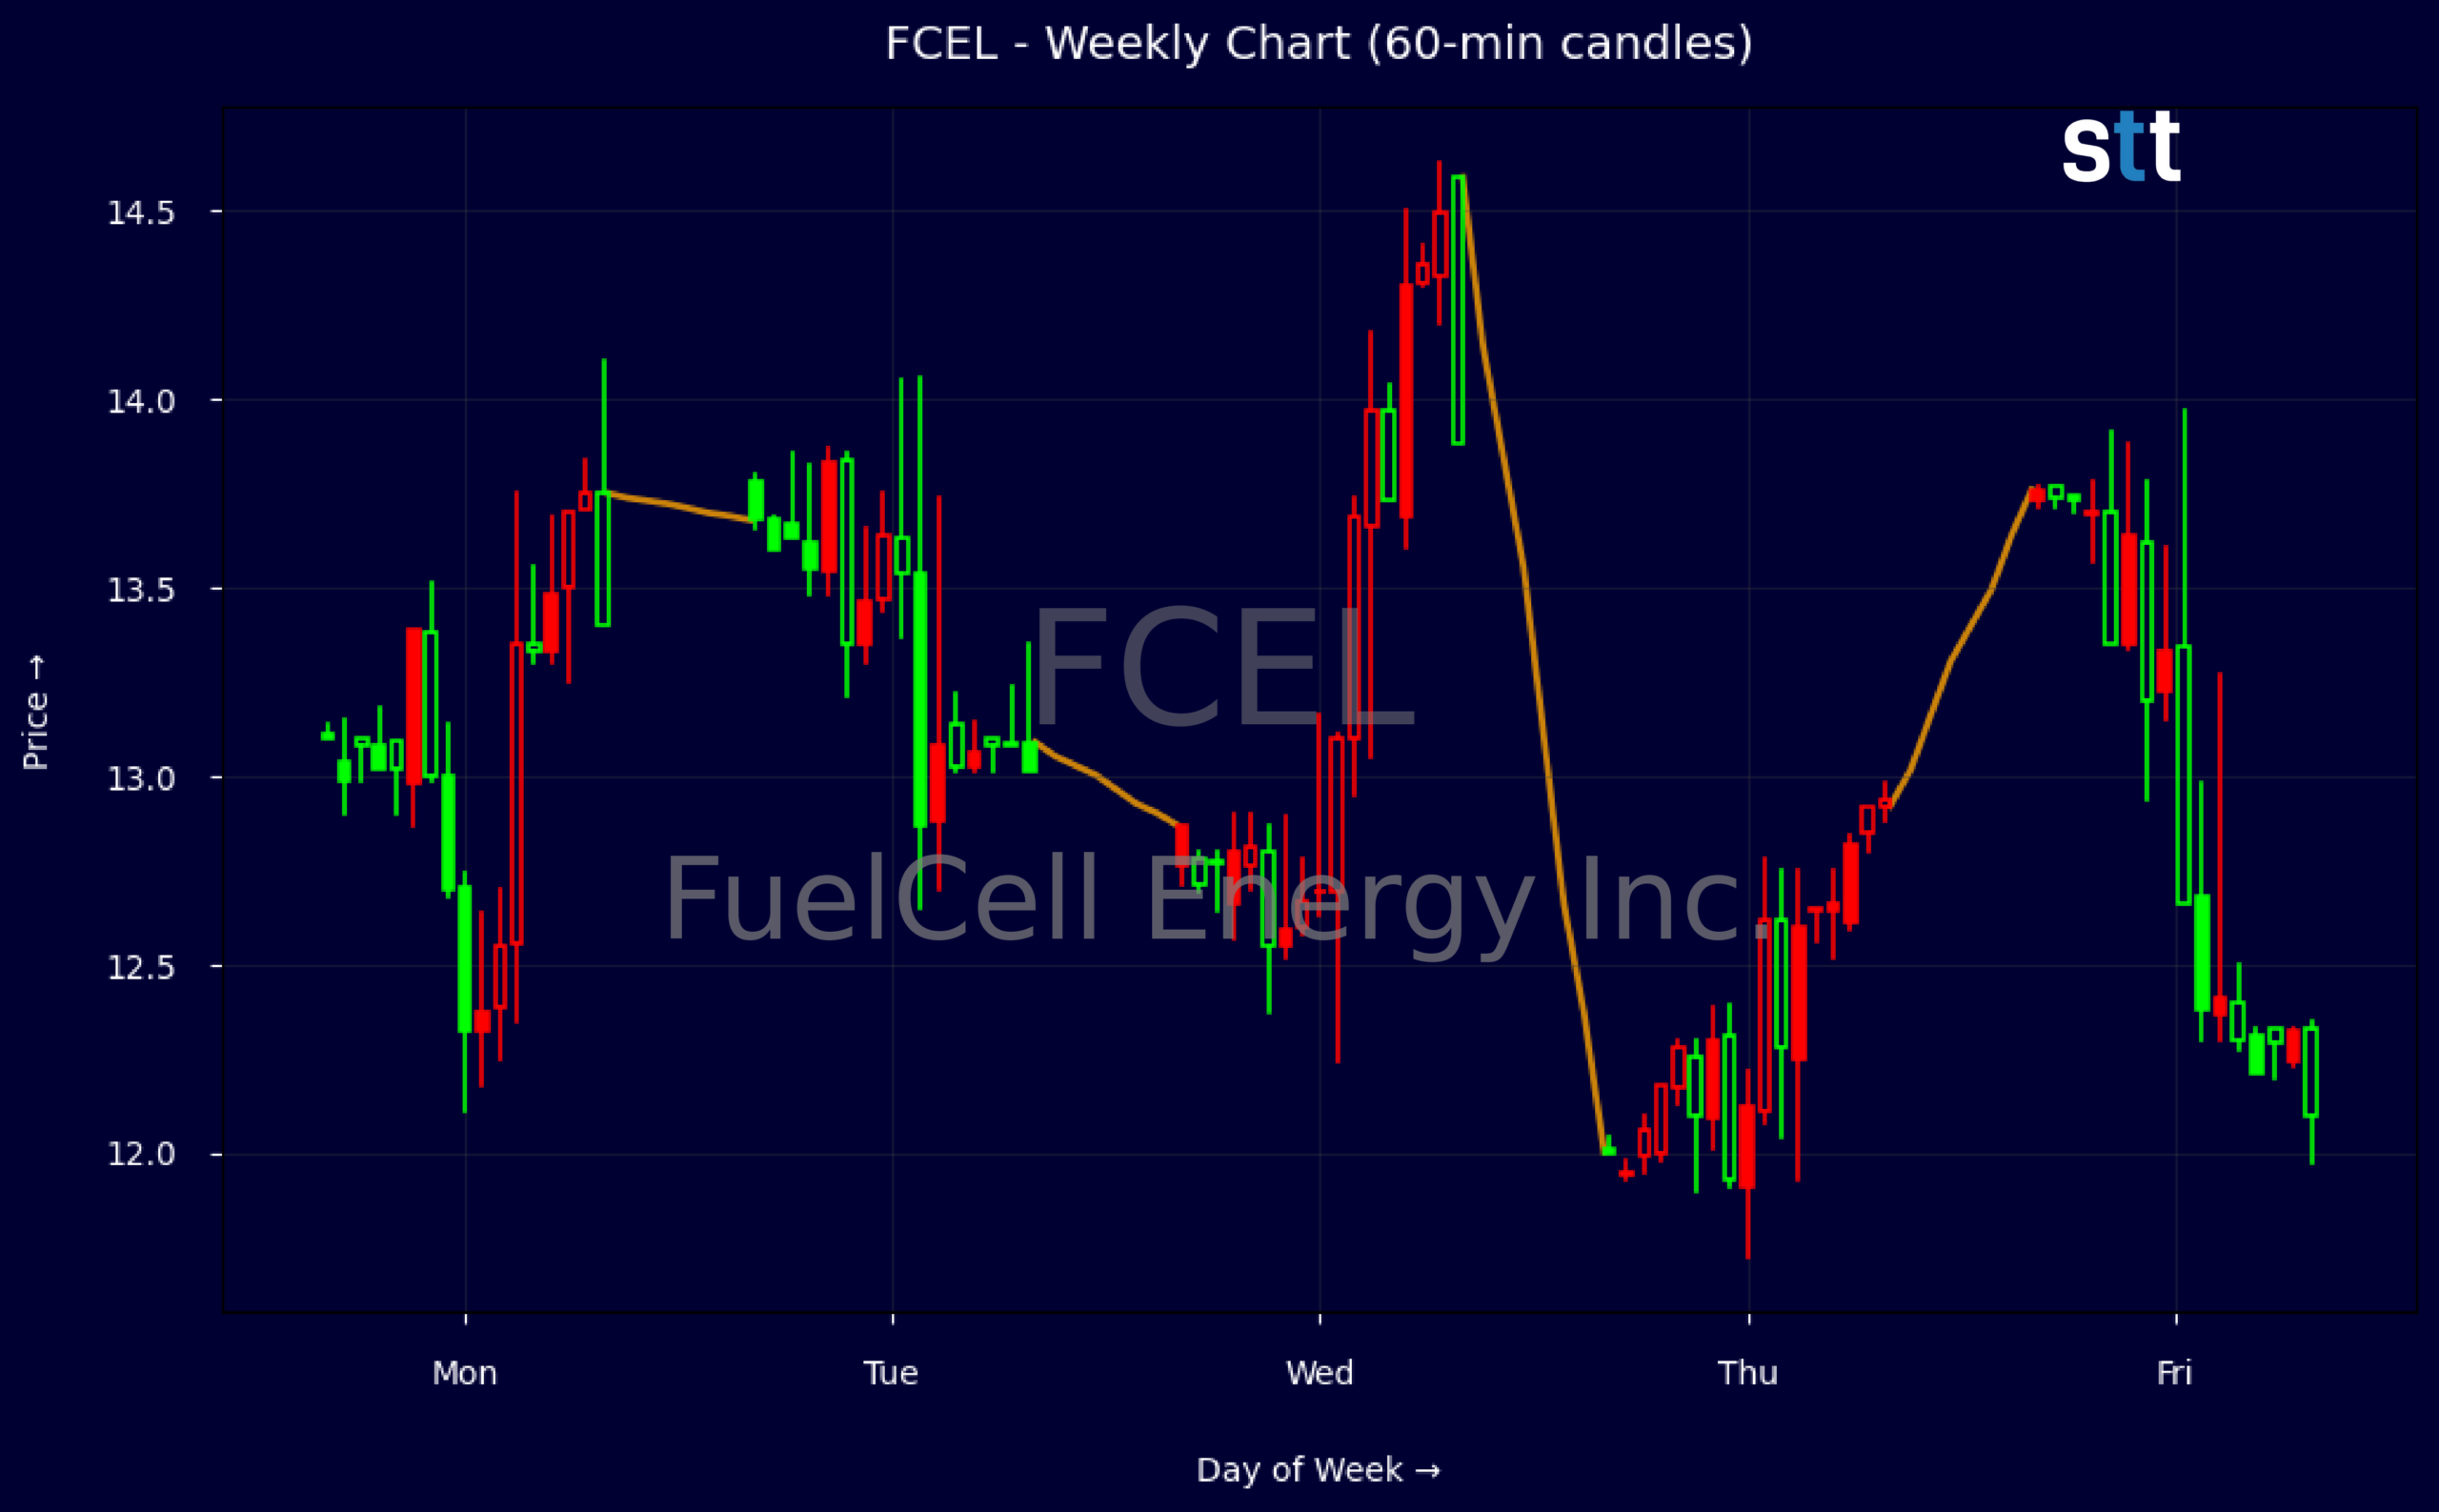
Weekly Update May 04 – May 08, 2026: On Sunday, May 10, 2026 FuelCell Energy Inc. stock [NASDAQ: FCEL] is trending up by 11.81%! Discover the key drivers behind this movement as well as our expert analysis in the detailed breakdown below.
Industrials industry expert:
Analyst sentiment – negative
FuelCell Energy occupies a niche but subscale position in stationary fuel cells, with weak fundamentals masked by a strong balance sheet. Revenues of ~$158M are growing (3-year CAGR ~38%), yet gross margin is deeply negative (-16%) and net margin about -109%. ROE (-28%) and ROA (-18%) are structurally poor, and free cash flow remains negative (-$35M Q1). However, leverage is low (D/E 0.04, LT debt/cap 0.02) and liquidity strong (current ratio 8x, cash ~$312M), giving multi‑year runway but no evidence of economic profitability.
Technically, FCEL trades in a volatile range with no confirmed uptrend. This week’s prints clustered around $12–14, with a failed push above $13.80 and quick rejection, confirming $13.80–14.00 as near-term resistance; $12.00 is the key support after intraday tests. Five‑minute candles show heavy selling on approaches to $13.70–13.80 with rising volume and fading bids. A practical trading level is a tactical short entry near $13.70 with a stop above $14.20, targeting a reversion toward $12.20.
More Breaking News
- MPT Stock Slides As Traders Weigh Debt, Dividend Risk
- CMCSA Rallies As Earnings Beat Collides With Restructuring Overhang
- AAL Stock Slides As Fuel Shock Slams 2026 Outlook
- SNAP Stock Slips As Ads, Regulation And Insider Selling Weigh
Recent news flow is minimal, with only a Form 4 ownership change that does not alter the investment case. Compared with Industrials and broader Industrial Goods peers, FCEL lags badly on profitability, returns on capital, and cash generation, despite similar or richer price-to-sales (~4.3x) and price-to-book (~1.0x) multiples. I view risk/reward as unattractive; expect the stock to trade in a $12–14 band with structural resistance at $14 and limited upside absent clear, sustained positive margin inflection.
Quick Financial Overview
FuelCell Energy Inc. sits in a tricky middle ground that short-term traders tend to like: clear revenue growth with weak profitability and a liquid balance sheet. Revenue over the last year was about $158.2M, with multi‑year revenue growth in the mid‑double digits, but the latest quarter showed total revenue of only $30.53M and a gross loss of $5.86M. That pressure flows through to a quarterly net loss of $22.86M and a basic EPS of -$0.49, keeping FCEL firmly in “story and momentum” territory rather than earnings strength.
Margins and returns underline that point. The company posts an EBIT margin of 6.3%, but a pretax margin of about -126.7% and a total profit margin near -109.4%. Return on equity around -23.8% and return on assets near -17.7% confirm that FuelCell Energy Inc. is not yet turning growth into real economic value. On the flip side, the balance sheet looks relatively strong for a speculative name: current ratio near 8, quick ratio above 5, low total‑debt‑to‑equity around 0.04, and cash and equivalents of roughly $311.8M against total liabilities of about $214.5M.
Cash flow and price action complete the trading picture. Operating cash flow last quarter was roughly -$33.94M and free cash flow about -$34.71M, but financing inflows of about $74.8M drove an increase in cash to nearly $379.6M by period end. On the chart, weekly data show FCEL ranging between about $12.00 and $13.83 with closes mostly clustered in the low‑to‑mid $13 area, suggesting an active range rather than a clean trend. A recent intraday 5‑minute candle opening around $12.46 and closing near $13.70 shows fast money stepping in aggressively, which is exactly the type of volatility short‑term traders look for.
Conclusion
FuelCell Energy Inc. offers a textbook example of a speculative, range‑trading name where price often moves ahead of fundamentals. The lone fresh catalyst is the Form 4 insider or major holder ownership change, but with no detail here on whether it was a buy or sell, and no size data, traders should treat it as a neutral data point rather than a signal. The real edge right now comes from understanding how FCEL behaves around its recent $12.00–$13.80 band and how that lines up with its cash‑rich but loss‑making financial profile.
For short‑term traders, the combination of negative earnings, weak returns, and strong liquidity means dilution and volatility remain ongoing risks, but outright financial stress does not appear immediate. That usually translates into sharp sentiment‑driven swings rather than a slow grind to zero or a straight trend higher. FCEL and FuelCell Energy Inc. will likely continue to trade more on headlines, order wins, and shifts in risk appetite than on quarterly EPS numbers alone. As I tell my students, “Names like FCEL are not about believing the story forever; they are about reading the tape, respecting your levels, and letting the price action, not hope, dictate your trade.” As Tim Bohen, lead trainer with StocksToTrade says, “The best way to learn is by tracking trades, wins, losses, and lessons learned. Every trade has something to teach.”.
This is stock news, not investment advice. StocksToTrade News delivers real-time stock market updates tailored to highlight the key catalysts driving short-term price movements. Our coverage is designed for active traders and investors who thrive in fast-moving markets, with a focus on volatile sectors like penny stocks, AI stocks, Robinhood stocks and other momentum plays. From earnings reports and FDA approvals to mergers, new contracts, and unusual trading volume, we break down the events that can spark significant price action.
Looking to level up your trading game? Explore StocksToTrade, the ultimate platform for traders. With powerful tools designed for swing and day trading, integrated news scanning, and even social media monitoring, StocksToTrade keeps you one step ahead.
Check out our quick startup guide for new traders!
- How to Read Stock Charts: A Guide for Beginners
- Trading Plan: 6 Steps to Create One
- How To Create a Stock Watchlist
Ready to build your watchlists? Check out these curated lists:
Once your watchlist is set, take the next step and trade with confidence using StocksToTrade’s robust platform. Don’t miss out — grab your 14-day trial for just $7 and experience the edge you need to thrive in today’s fast-paced markets.