

FormFactor Inc. stocks have been trading up by 7.38 percent following upbeat semiconductor demand and advanced chip-testing outlook.
What Traders Need To Know
- Upcoming appearances at Jefferies Semiconductor, Citi Global TMT, and B. Riley Consumer & TMT conferences should boost visibility for FormFactor Inc. among institutions following semiconductor test names.
- An amended Schedule 13G filing shows a notable but passive ownership change in FORM by institutional or large holders, pointing to ongoing portfolio interest without an activist angle.
- Multiple recent Form 4 filings flag insider ownership changes in FormFactor Inc., but with no detail on trade size or direction, the signals remain neutral and hard to trade.
- Weekly price data show FORM rebounding from mid‑$90s toward $104, while an intraday spike suggests active short‑term momentum and strong day‑trader interest.
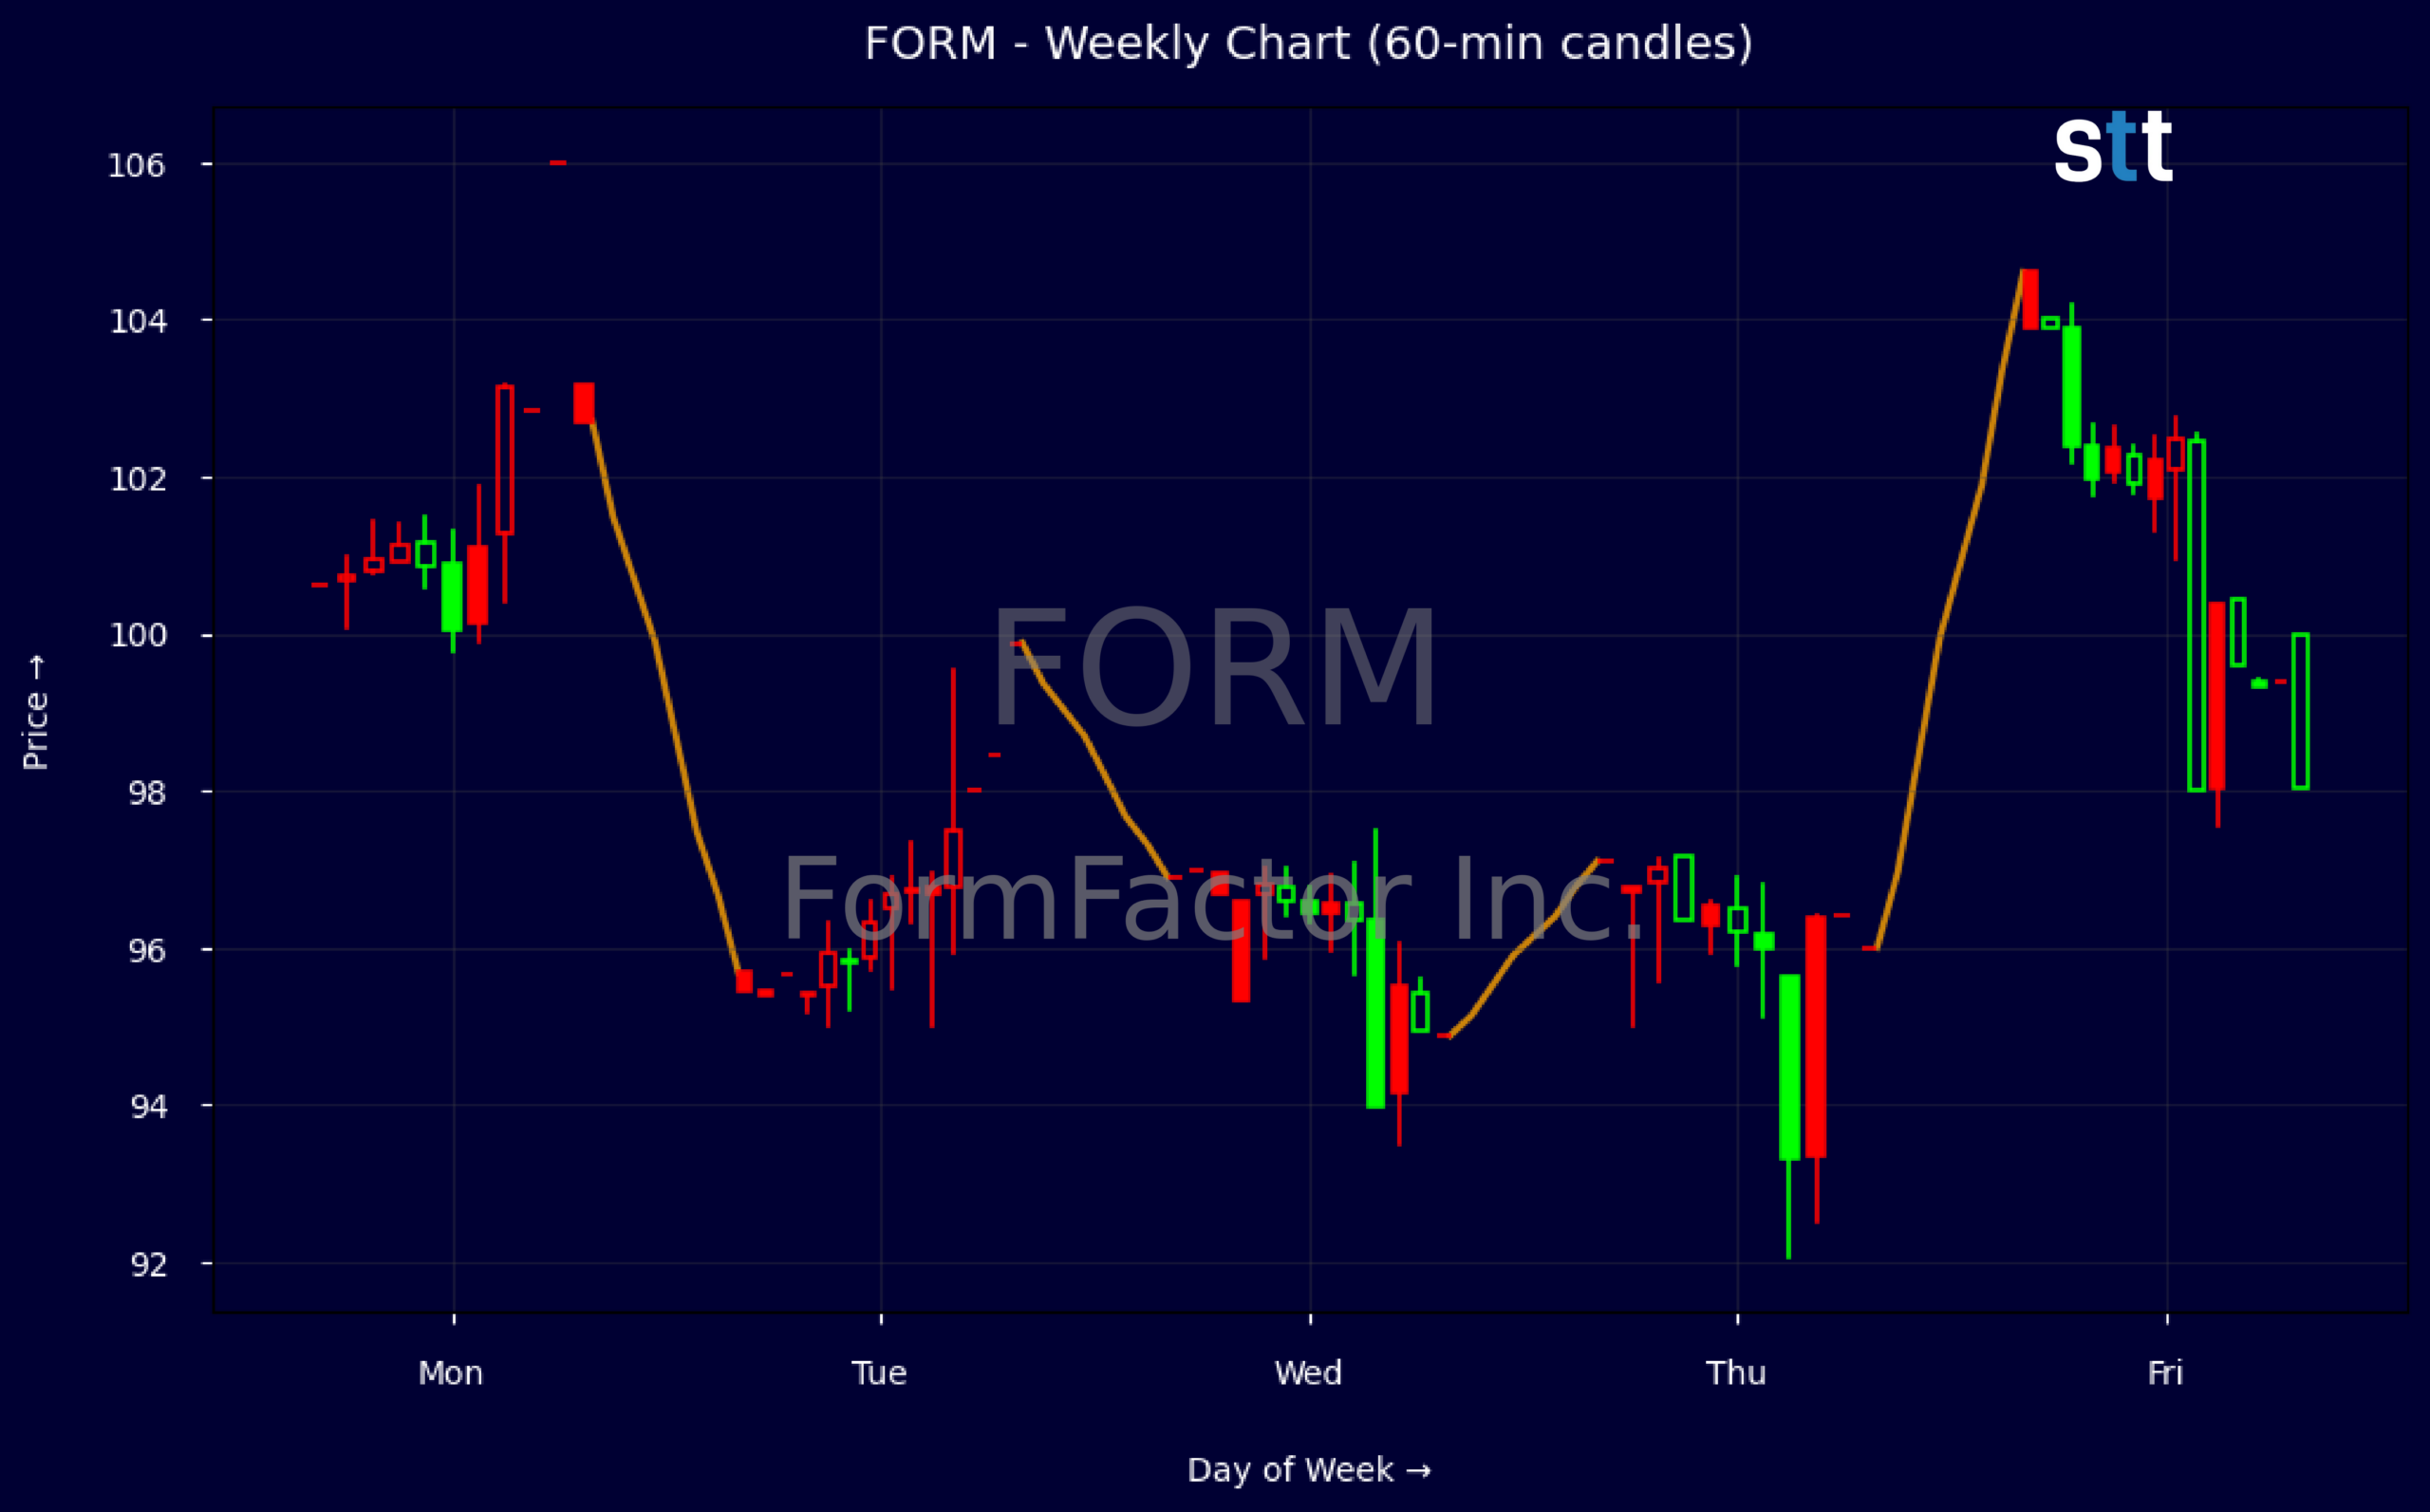
Weekly Update Aug 31 – Sep 04, 2026: On Saturday, September 05, 2026 FormFactor Inc. stock [NASDAQ: FORM] is trending up by 7.38%! Discover the key drivers behind this movement as well as our expert analysis in the detailed breakdown below.
Technology industry expert:
Analyst sentiment – positive
FormFactor sits in the upper tier of semiconductor test equipment vendors, with solid but not spectacular profitability and a premium valuation. Gross margin at 43% and EBIT margin at 13% confirm a defensible niche, while ROE around 11% and ROIC improving (QTR 16%) show disciplined capital allocation. Balance sheet strength is exceptional: net cash, debt-to-equity near zero, current ratio 4.1. However, a P/E ~67 and price-to-sales ~8.4 embed aggressive growth expectations despite mid‑single‑digit revenue CAGR over five years.
Technically, the dominant trend is up, with a sharp rebound from mid‑90s to above 103 in just a few sessions and a new short-term high at 104.6. Recent 5‑minute candles show strong buying into the close and shallow intraday pullbacks, consistent with institutional accumulation on rising volume. First actionable level is support at 95–96, the prior congestion zone; above, resistance sits near 105. A high‑probability strategy is buying pullbacks toward 97–99 with a stop below 95 and upside toward 110.
More Breaking News
- SPCX Slides As Headline Risk And Competition Hammer Sentiment
- CMCSA Stock Grinds Higher As Earnings Beat Meets Big Restructure
- Pinterest Stock Slips As Revenue Misses Rattle Traders
- MPT Stock Slides As Traders Focus On Debt And Cash Flow
Near term, catalysts are modest but constructive: multiple investor conferences should reinforce the secular test demand narrative, while new and amended institutional positions signal growing buy-side interest without activist overhang. Insider Form 4 activity is noise in absence of directional detail. Versus broader Tech and Semi Equipment peers, FORM trades at a rich multiple but with superior balance sheet quality and cyclical leverage. I see the risk-reward as favorable up to $110, with near-term support at 95 and secondary at 90.
Quick Financial Overview
FormFactor Inc. sits in an interesting spot for traders: strong on margins and balance sheet, but priced for continued growth. Recent trailing revenue of about $785M, with a gross margin near 43%, shows a solid, high‑value semiconductor test business. Profitability metrics, including EBIT margin around 13% and profit margin near 13%, confirm that FORM converts a good share of sales into bottom‑line results. Returns on equity close to 11% and on assets above 9% back up the idea of efficient capital use.
Valuation, however, is not cheap. A price‑to‑earnings ratio above 66 and price‑to‑sales over 8 tell traders the stock already bakes in a bullish growth path. With price‑to‑book around 6.8 and price‑to‑free‑cash‑flow mid‑30s, FormFactor Inc. trades like a quality growth name, not a turnaround. The balance sheet is a plus: total debt to equity near 0.03, current ratio about 4.1, and quick ratio above 3 signal low financial risk and strong liquidity.
On the tape, the weekly chart shows FORM pulling back from $100.61 to the mid‑$90s, then recovering and pushing back to roughly $103.90. That bounce suggests dip buyers are active around mid‑$90s, making that zone a key reference for support. The intraday five‑minute candle, with a move from roughly $99.64 to $104.20 before closing near the high, signals aggressive demand intraday and possible breakout behavior. Traders should see this as a stock where momentum can accelerate quickly once liquidity shows up.
Conclusion
FormFactor Inc. currently blends solid fundamentals with a valuation that demands execution, which is exactly the type of setup momentum‑oriented swing and position traders should treat with respect. The company’s strong margins, clean balance sheet, and healthy free cash flow give a fundamental floor, but the high earnings multiple means any stumble in growth or guidance could hit FORM hard. That is why upcoming appearances at the Jefferies Semiconductor, Citi Global TMT, and B. Riley Consumer & TMT conferences matter: commentary from management can reset expectations, drive volume, and create tradable moves.
Ownership updates add another layer. The amended Schedule 13G shows continuing institutional interest, but it is passive, not activist, so traders should not expect immediate strategic drama from that filing alone. Meanwhile, the cluster of Form 4 insider transactions, without detail on buys versus sells, is best read as background noise rather than a directional trigger. Against that backdrop, the recent rebound from the mid‑$90s into the low $100s and the sharp intraday push toward $104 put FORM on breakout watch for active traders. As I tell my students, “The edge is not in predicting the story, it is in knowing exactly what you will do when price hits your level.” As Tim Bohen, lead trainer with StocksToTrade says, “If you’re still guessing at the end of your analysis, it’s probably not a trade worth taking.” This content is for educational and research use only.
This is stock news, not investment advice. StocksToTrade News delivers real-time stock market updates tailored to highlight the key catalysts driving short-term price movements. Our coverage is designed for active traders and investors who thrive in fast-moving markets, with a focus on volatile sectors like penny stocks, AI stocks, Robinhood stocks and other momentum plays. From earnings reports and FDA approvals to mergers, new contracts, and unusual trading volume, we break down the events that can spark significant price action.
Looking to level up your trading game? Explore StocksToTrade, the ultimate platform for traders. With powerful tools designed for swing and day trading, integrated news scanning, and even social media monitoring, StocksToTrade keeps you one step ahead.
Check out our quick startup guide for new traders!
- How to Read Stock Charts: A Guide for Beginners
- Trading Plan: 6 Steps to Create One
- How To Create a Stock Watchlist
Ready to build your watchlists? Check out these curated lists:
Once your watchlist is set, take the next step and trade with confidence using StocksToTrade’s robust platform. Don’t miss out — grab your 14-day trial for just $7 and experience the edge you need to thrive in today’s fast-paced markets.