
Fly-E Group Inc. stocks have been trading down by -10.42 percent amid heightened concerns from the most negative recent headline.
Click Here for a Millionaire's POV on Trading FLYE
SUBSCRIBE FOR ALERTSJOIN 50,000+ ACTIVE TRADERS
Key Takeaways
- FLYE has exploded from a $1.20s base into the mid-$3s, with a spike to $6.31 showing aggressive trading momentum and heavy profit-taking.
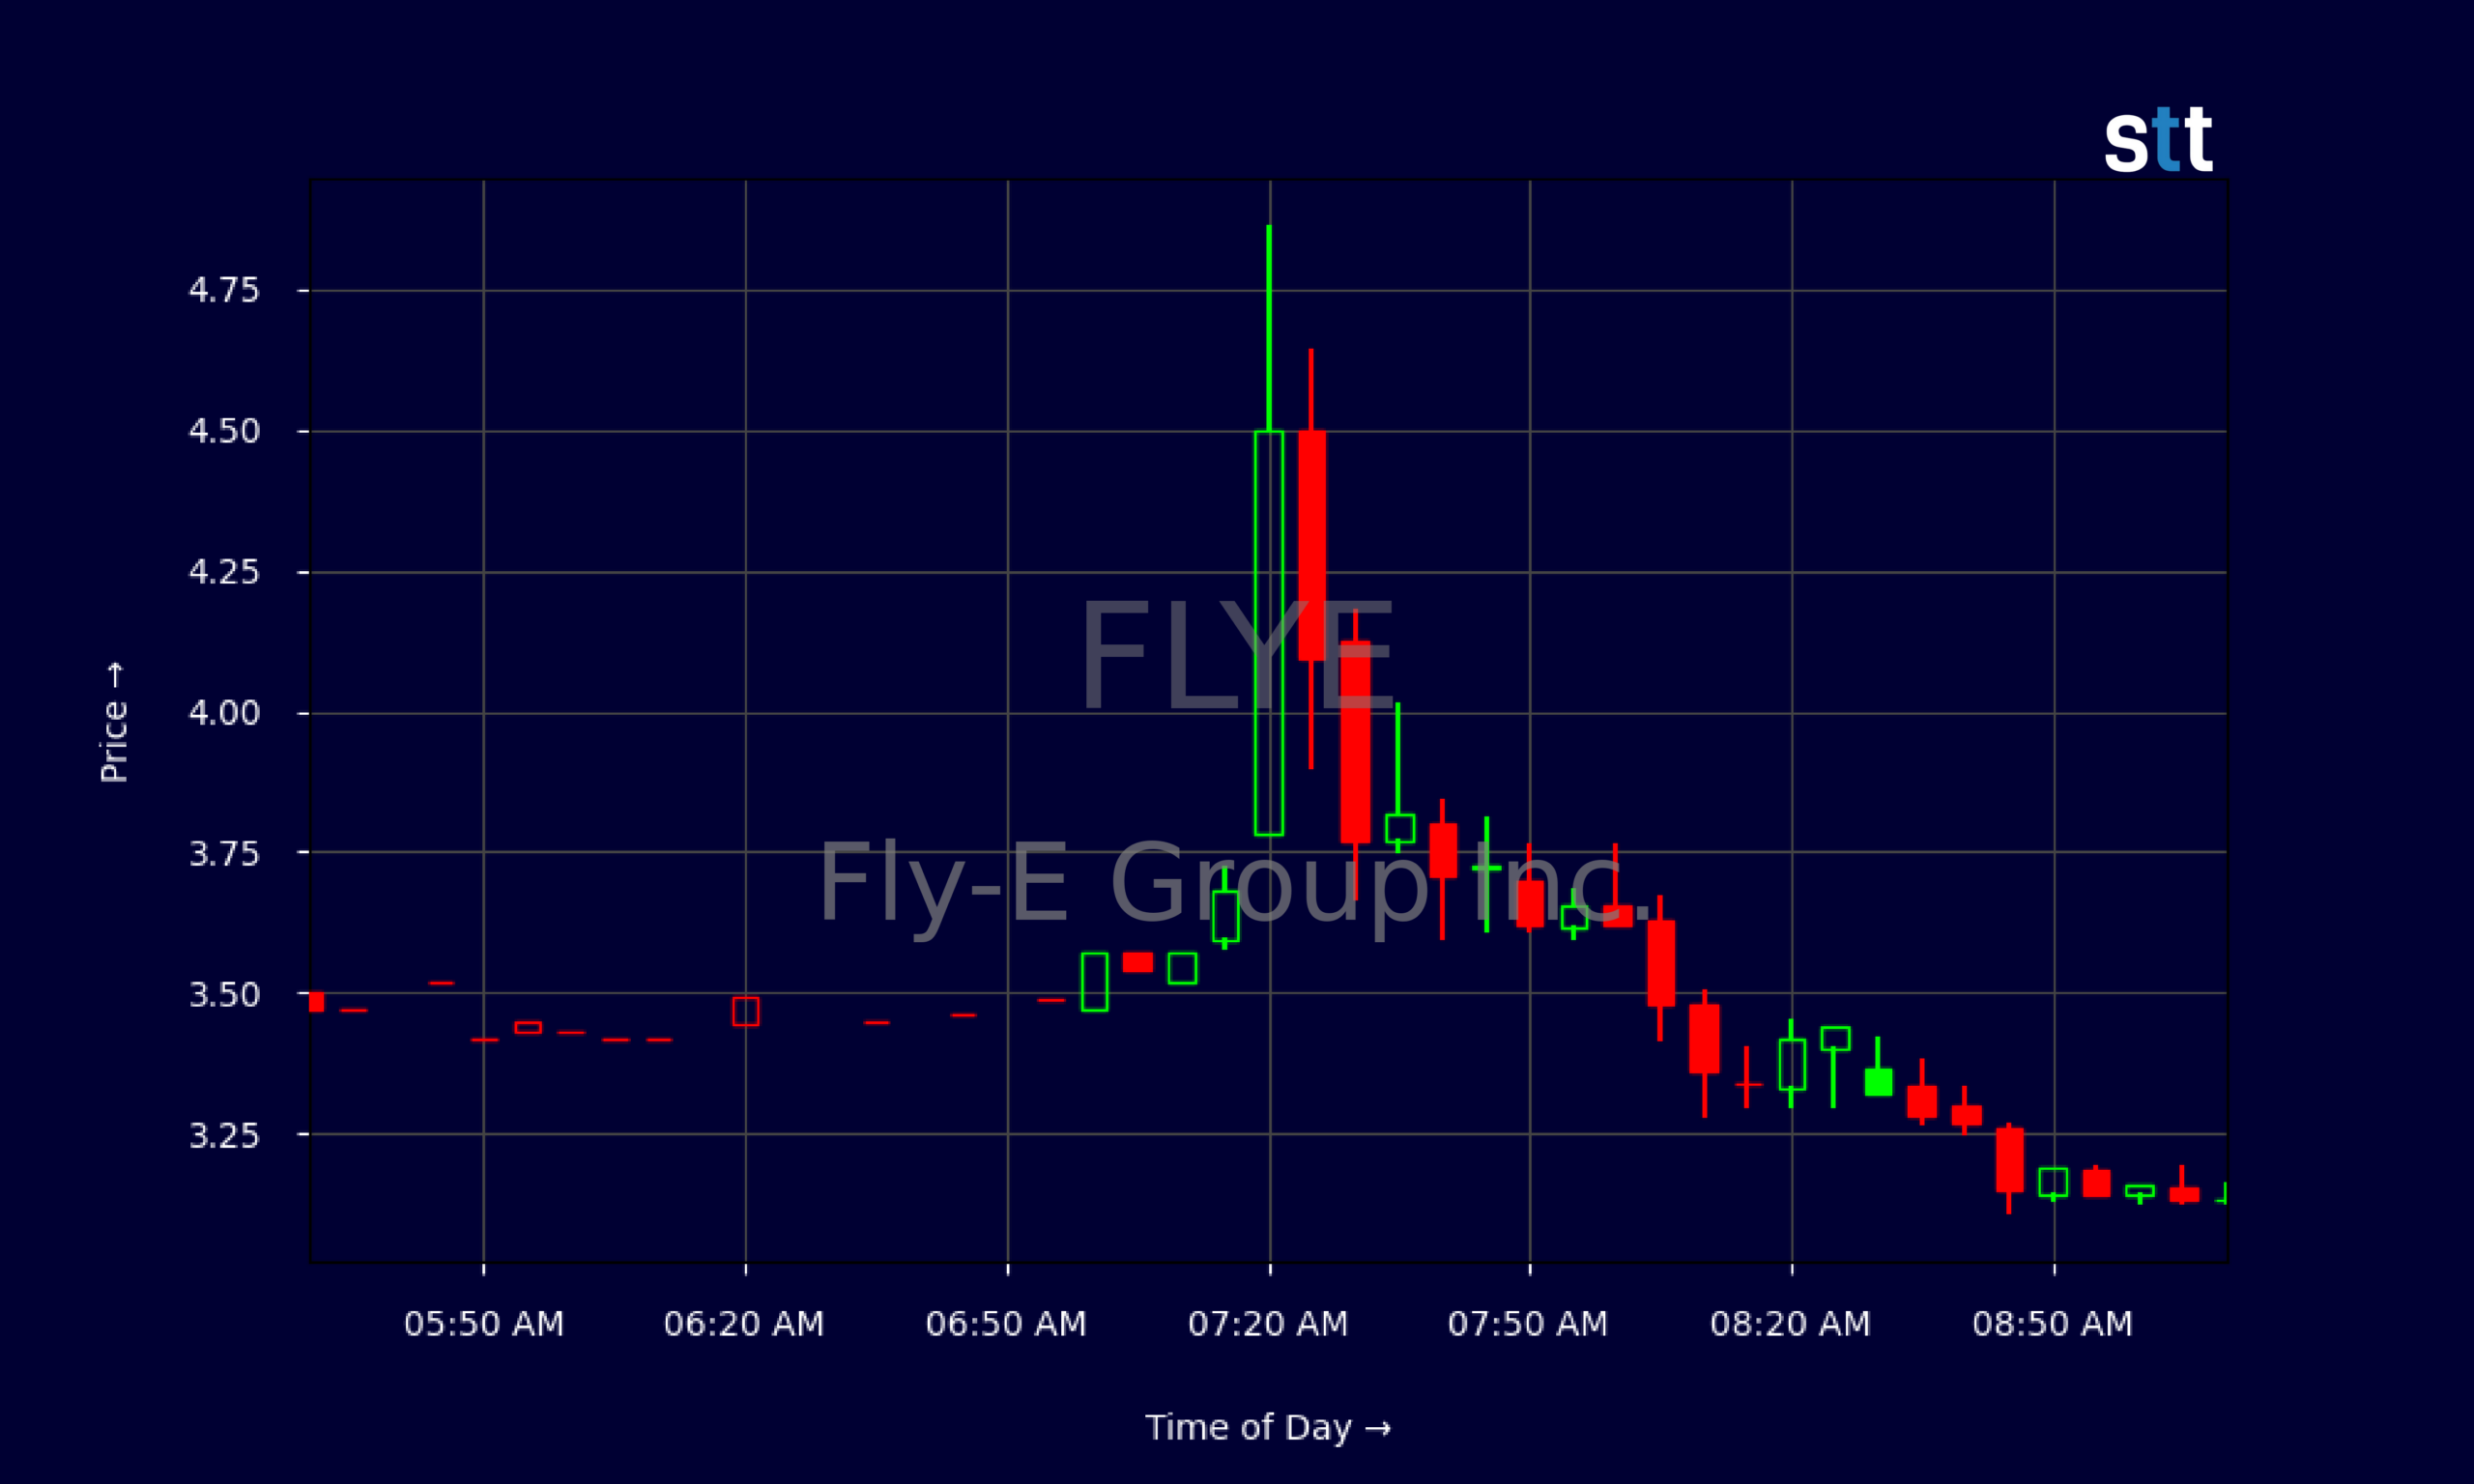
- The intraday chart for Fly-E Group Inc. shows wild premarket swings above $4 followed by consolidation in the low-to-mid $3 range, a classic momentum fade pattern.
- Financials for FLYE reveal negative margins and heavy losses, but a low price-to-sales ratio near 0.23 signals deep-discount trading versus revenue.
- Fly-E Group Inc. carries manageable leverage, with a current ratio around 2, giving traders some confidence the company can weather near-term cash burn.
Live Update At 09:18:38 EDT: On Wednesday, October 14, 2026 Fly-E Group Inc. stock [NASDAQ: FLYE] is trending down by -10.42%! Discover the key drivers behind this movement as well as our expert analysis in the detailed breakdown below.
Quick Financial Overview
FLYE is trading like a classic beaten-down revenue story. Fly-E Group Inc. generates about $19.1M in annual revenue, but the margins are rough. Profit margin sits near -68%, with EBIT margin around -56%, which tells traders the business is still deep in the red. For active trading, that kind of red ink often means one thing: the story has to be price action and potential, not current earnings strength.
Despite the losses, FLYE looks cheap on a pure sales lens. A price-to-sales ratio of roughly 0.23 and price-to-book around 0.28 mean the market values Fly-E Group Inc. at a steep discount to both revenue and equity. The balance sheet shows total assets near $26.2M and equity around $13.5M, versus enterprise value of about $15.9M. Debt-to-equity near 0.75 and a current ratio of 2 suggest FLYE is leveraged, but not drowning.
More Breaking News
- SDEV Stock Whipsaws As Momentum Traders Pile In
- Micron Stock Slides As Legal And China DRAM Risks Mount
- JBLU Stock Slides As Wall Street Slashes Price Targets
- TTMI Stock Slides As AI Expansion Spending Ramps Up
Cash flow is still a concern. Operating cash flow is roughly -$190K for the recent quarter and free cash flow is negative, highlighting ongoing burn. For traders, Fly-E Group Inc. sits in the “speculative turnaround” bucket, where price can move fast on any hint of operational improvement or capital moves.
Why Traders Are Watching FLYE’s Chart
The chart is where FLYE really grabs attention. Over the last few weeks, Fly-E Group Inc. floated quietly in the $1.30–$1.50 zone. Then the switch flipped. On 2026/10/13, the stock opened around $2.16, ripped as high as $6.31, then closed near $3.55. That’s a massive range, more than doubling off the prior close of $2.05 and printing a monster wick on the daily candle.
For day traders, that kind of action screams opportunity and risk. FLYE now has a clear support-versus-resistance map. The $1.20s–$1.30s region is the recent base. The $3.50s area is current supply, and $6.31 is the blow-off top that marks where late buyers got trapped. Fly-E Group Inc. will stay on many watchlists as long as it holds above prior resistance in the low $2s.
Intraday, the 5‑minute tape shows how violent the move was. In premarket, FLYE spiked from the mid-$3s to the mid-$4s, tagged $4.86, then started to fade. By later morning, prices churned between $3.20 and $3.50, tightening into consolidation. That’s textbook momentum: early squeeze, sharp reversal, then a range where shorts and longs battle it out.
For short-term trading, Fly-E Group Inc. now trades like a former runner. Breaks above the $4 area can trigger another squeeze toward the prior high, while sustained trading below $3 raises the odds of a round trip back toward the $2s. Volume and level 2 action will be key tells.
Conclusion
FLYE is a messy story fundamentally, but that’s exactly what many short-term traders hunt. Fly-E Group Inc. has real revenue near $19.1M, yet deep losses and negative returns on equity north of -80%. The market’s answer, so far, is a low-multiple, high-volatility stock that can double in a day and still trade below book value. That combination turns FLYE into a trading vehicle, not a comfort play.
The balance sheet gives Fly-E Group Inc. some breathing room, with working capital over $8.1M and a current ratio around 2, but cash on hand is thin at roughly $60K, and free cash flow is negative. Those numbers keep the pressure on management to either grow the top line or cut the burn. Any clear move on cost control, financing, or strategic focus can light a new fire under the chart. For pattern-focused traders, that kind of catalyst-driven story aligns with the idea that, as Tim Bohen, lead trainer with StocksToTrade says, “There’s a pattern in everything; you just have to stick around long enough to see it.”
For now, traders should treat FLYE as a pure price-action setup: respect support in the low $2s, watch resistance zones in the $3s and $4s, and never fall in love with the story. As Tim Sykes often says, “The market doesn’t owe you anything; your only edge is preparation and discipline.” Fly-E Group Inc. is offering the volatility. It’s on traders to bring the plan.
This is stock news, not investment advice. StocksToTrade News delivers real-time stock market updates tailored to highlight the key catalysts driving short-term price movements. Our coverage is designed for active traders and investors who thrive in fast-moving markets, with a focus on volatile sectors like penny stocks, AI stocks, Robinhood stocks and other momentum plays. From earnings reports and FDA approvals to mergers, new contracts, and unusual trading volume, we break down the events that can spark significant price action.
Looking to level up your trading game? Explore StocksToTrade, the ultimate platform for traders. With powerful tools designed for swing and day trading, integrated news scanning, and even social media monitoring, StocksToTrade keeps you one step ahead.
Check out our quick startup guide for new traders!
- How to Read Stock Charts: A Guide for Beginners
- Trading Plan: 6 Steps to Create One
- How To Create a Stock Watchlist
Ready to build your watchlists? Check out these curated lists:
Once your watchlist is set, take the next step and trade with confidence using StocksToTrade’s robust platform. Don’t miss out — grab your 14-day trial for just $7 and experience the edge you need to thrive in today’s fast-paced markets.