
Flagstar Bank N.A. faces heightened investor anxiety after regulatory scrutiny on regional lenders, with stocks have been trading down by -9.11 percent.
Click Here for a Millionaire's POV on Trading FLG
SUBSCRIBE FOR ALERTSJOIN 50,000+ ACTIVE TRADERS
Key Takeaways
- US regional banks face a tougher-than-expected setup into Q3 earnings, with BofA seeing the group’s stocks “languish” under macro headwinds and shifting trader concerns.
- Flagstar Bank (FLG), a mid-cap lender, leads the pack in downward Q3 EPS estimate cuts from BofA, signaling greater earnings risk than peers.
- The sector backdrop plus Flagstar’s sharper revisions raise the bar for any Q3 upside surprise and keep caution high for short-term trading setups.
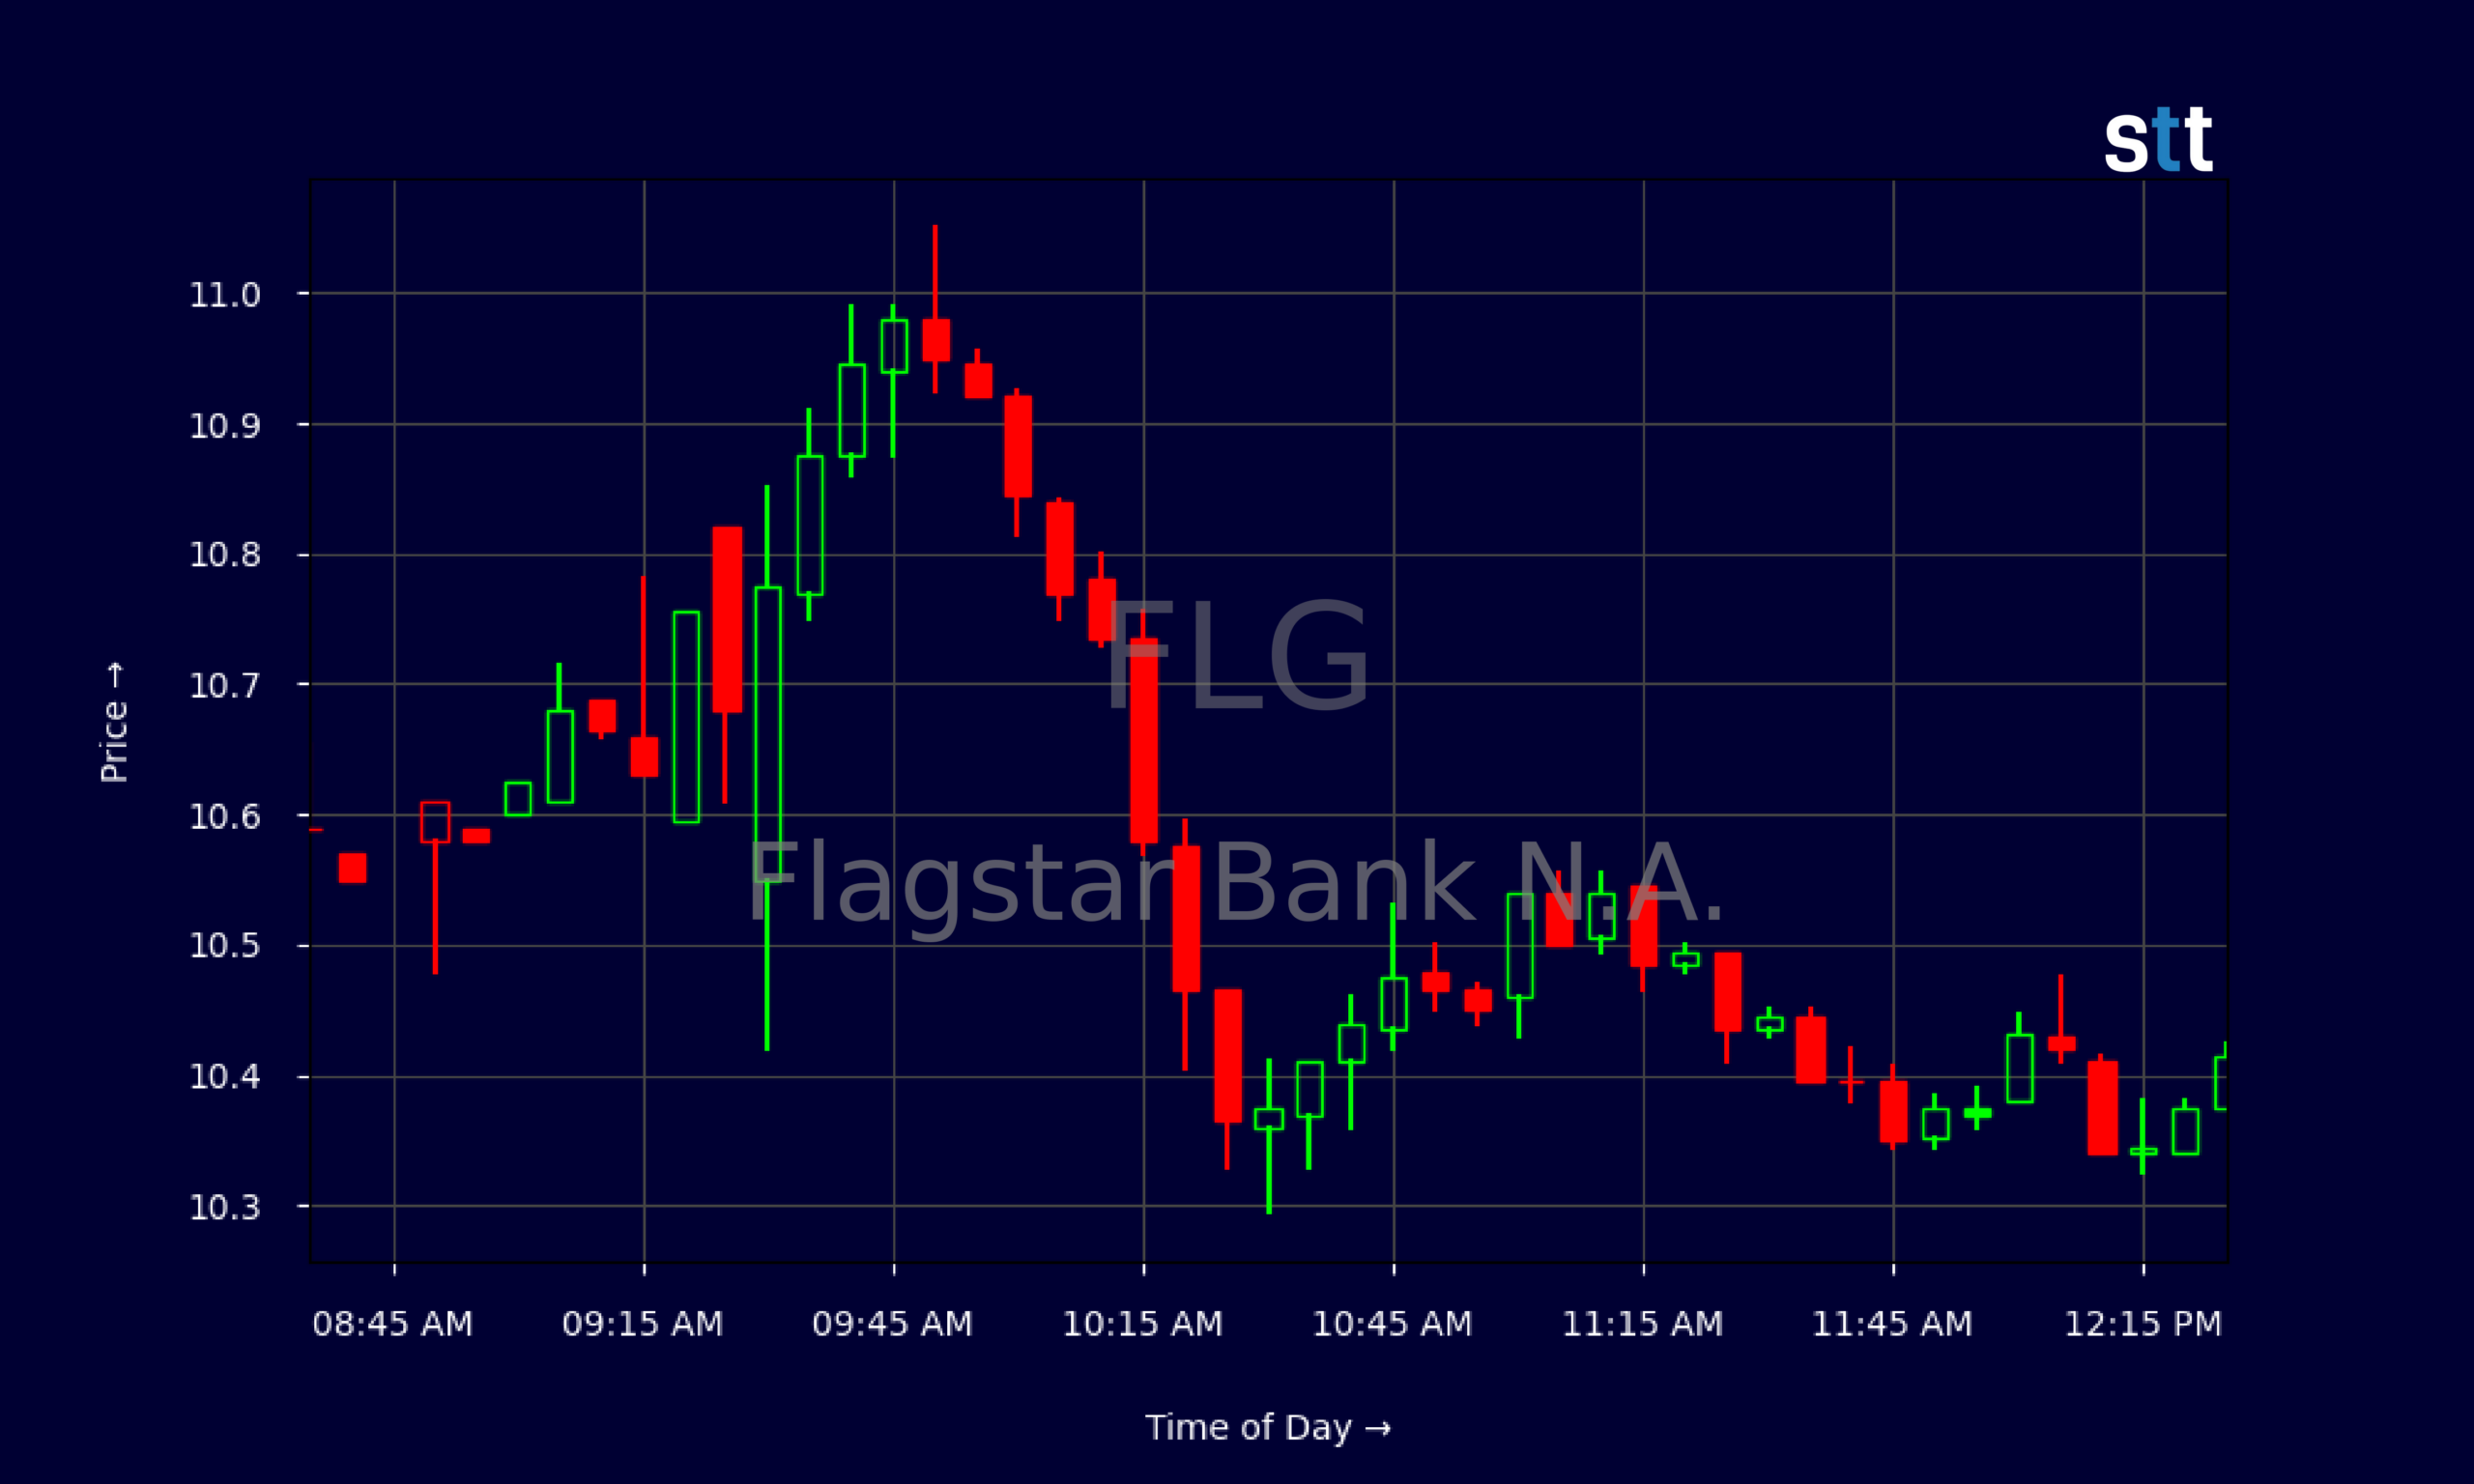
Live Update At 12:33:10 EDT: On Friday, October 23, 2026 Flagstar Bank N.A. stock [NYSE: FLG] is trending down by -9.11%! Discover the key drivers behind this movement as well as our expert analysis in the detailed breakdown below.
Quick Financial Overview
FLG has been leaking lower for weeks, and the chart shows it clearly. From a recent swing high near $12.28 on 2026/09/28, Flagstar Bank has faded to about $10.40 on 2026/10/23. That’s roughly a 15% pullback, and the closing range has tightened around $10.90–$11.20 before this latest breakdown, signaling supply winning over demand.
Intraday on 2026/10/23, FLG opened near $10.55, popped briefly toward $11.05, then sold off steadily to close around $10.40. That intraday pattern — early push, then grind lower — tells traders that sellers are hitting strength rather than chasing bids.
More Breaking News
- NCPL Stock Slides As Financial Pressures Test Traders’ Nerves
- SPCX Stock Jumps As Q3 Profit, Tesla Merger Talk Ignite AI Hype
- FLG Stock Slips As BofA Slashes Q3 Earnings View
- SKYQ Restarts Nevada Refinery As Traders Eye Momentum
Fundamentals back up that cautious tape. Flagstar Bank generated about $2.06B in revenue over the last period, but profitability is thin. Net income for the latest quarter was only $34M, and net margin is under 1%. The P/E around 283 is sky-high for a regional bank, even if you adjust for temporarily depressed earnings. At the same time, FLG trades at only 0.62 times book value, a classic regional-bank signal that the market does not fully trust the balance sheet or earnings power. For active traders, that mix — low valuation vs. book, but rich vs. earnings — screams “show me” heading into Q3.
Why Traders Are Watching FLG Into Q3
The macro backdrop is working against FLG. BofA is telling clients that US regional banks, as a group, face a tougher-than-expected setup into Q3 earnings, even after a valuation reset. That means the market already marked these names down, yet big money still expects them to “languish” as rates, credit quality worries, and deposit competition hang over the group. FLG trades inside that storm.
What makes Flagstar Bank stand out is not strength, but pressure. BofA highlights FLG as leading the group in downward Q3 EPS estimate revisions. When a mid‑cap lender like Flagstar takes the steepest cuts, traders pay attention. It signals that analysts see FLG’s earnings power as more vulnerable than peers under the same macro conditions.
Look back at the tape. FLG has slipped from the low $12s to near $10 in less than a month while posting a lot of tight, overlapping candles — classic grinding downtrend price action. That lines up with traders slowly adjusting to weaker earnings expectations rather than one big shock. FLG’s Q2 numbers already showed how thin the cushion is: $516M in total revenue, $440M in net interest income, and yet only $34M dropping to the bottom line. Interest expense of $536M basically swallowed the spread, highlighting how sensitive Flagstar Bank is to funding costs.
For short-term trading, this combo of weak momentum, negative estimate revisions, and a heavy sector backdrop creates a clear narrative. FLG remains a “prove it” name. Any rally into Q3 earnings is likely to meet overhead resistance from trapped longs, while a disappointment can accelerate the downtrend. That’s exactly the type of setup momentum traders study — not to marry the stock, but to time emotion-driven swings.
Conclusion
FLG sits at the intersection of fragile fundamentals and a hostile macro environment. BofA’s call that regional bank stocks are set to “languish” into Q3 tells traders not to expect a friendly tailwind from the sector. On top of that, Flagstar Bank absorbing the biggest downward EPS estimate cuts among its peers signals that Street expectations are resetting lower, not higher.
Yet the picture is not one‑dimensional. FLG still carries $87.7B in assets, over $67.5B in deposits, and around $8.1B in equity. The stock trades at a steep discount to its $18.40 book value per share, which often draws in value‑oriented traders looking for mean reversion. Balance‑sheet leverage is high, but not out of character for a regional bank. That sets up a clear tug‑of‑war: cheap on book value, expensive on earnings, and under a dark Q3 cloud.
For active traders, the edge is in preparation, not prediction. Map the key support zone around $10, the recent resistance in the low $11s, and watch how FLG trades into the Q3 print and any BofA or Street commentary. As Tim Sykes loves to say, “The market doesn’t care about your opinion, only about price action and risk management.” As Tim Bohen, lead trainer with StocksToTrade says, “The best trades are the ones you can make without emotion. Plan it, then execute it as if it’s routine.”. For FLG, that means respecting the downtrend, staying nimble around headlines, and cutting losses fast if the Q3 story fails to improve. This is educational, research-focused analysis — use it to sharpen your trading plan, not to chase a hunch.
This is stock news, not investment advice. StocksToTrade News delivers real-time stock market updates tailored to highlight the key catalysts driving short-term price movements. Our coverage is designed for active traders and investors who thrive in fast-moving markets, with a focus on volatile sectors like penny stocks, AI stocks, Robinhood stocks and other momentum plays. From earnings reports and FDA approvals to mergers, new contracts, and unusual trading volume, we break down the events that can spark significant price action.
Looking to level up your trading game? Explore StocksToTrade, the ultimate platform for traders. With powerful tools designed for swing and day trading, integrated news scanning, and even social media monitoring, StocksToTrade keeps you one step ahead.
Check out our quick startup guide for new traders!
- How to Read Stock Charts: A Guide for Beginners
- Trading Plan: 6 Steps to Create One
- How To Create a Stock Watchlist
Ready to build your watchlists? Check out these curated lists:
Once your watchlist is set, take the next step and trade with confidence using StocksToTrade’s robust platform. Don’t miss out — grab your 14-day trial for just $7 and experience the edge you need to thrive in today’s fast-paced markets.