
Fermi Inc. faces heightened pressure as regulatory probes intensify, and its stocks have been trading down by -5.54 percent.
Click Here for a Millionaire's POV on Trading FRMI
SUBSCRIBE FOR ALERTSJOIN 50,000+ ACTIVE TRADERS
Key Takeaways
- FRMI has dropped from the mid‑$4s to below $3 in recent weeks, putting the stock firmly in pullback territory.
- Fermi Inc. is posting negative earnings and free cash flow, with FRMI burning over $230M in recent reporting.
- Leverage is moderate, but FRMI’s low current ratio signals tight liquidity that active traders cannot ignore.
- Intraday trading shows tight consolidation around $3, a classic battleground between dip buyers and short sellers.
- Chart structure and weak fundamentals keep FRMI squarely on the radar for momentum and day traders.
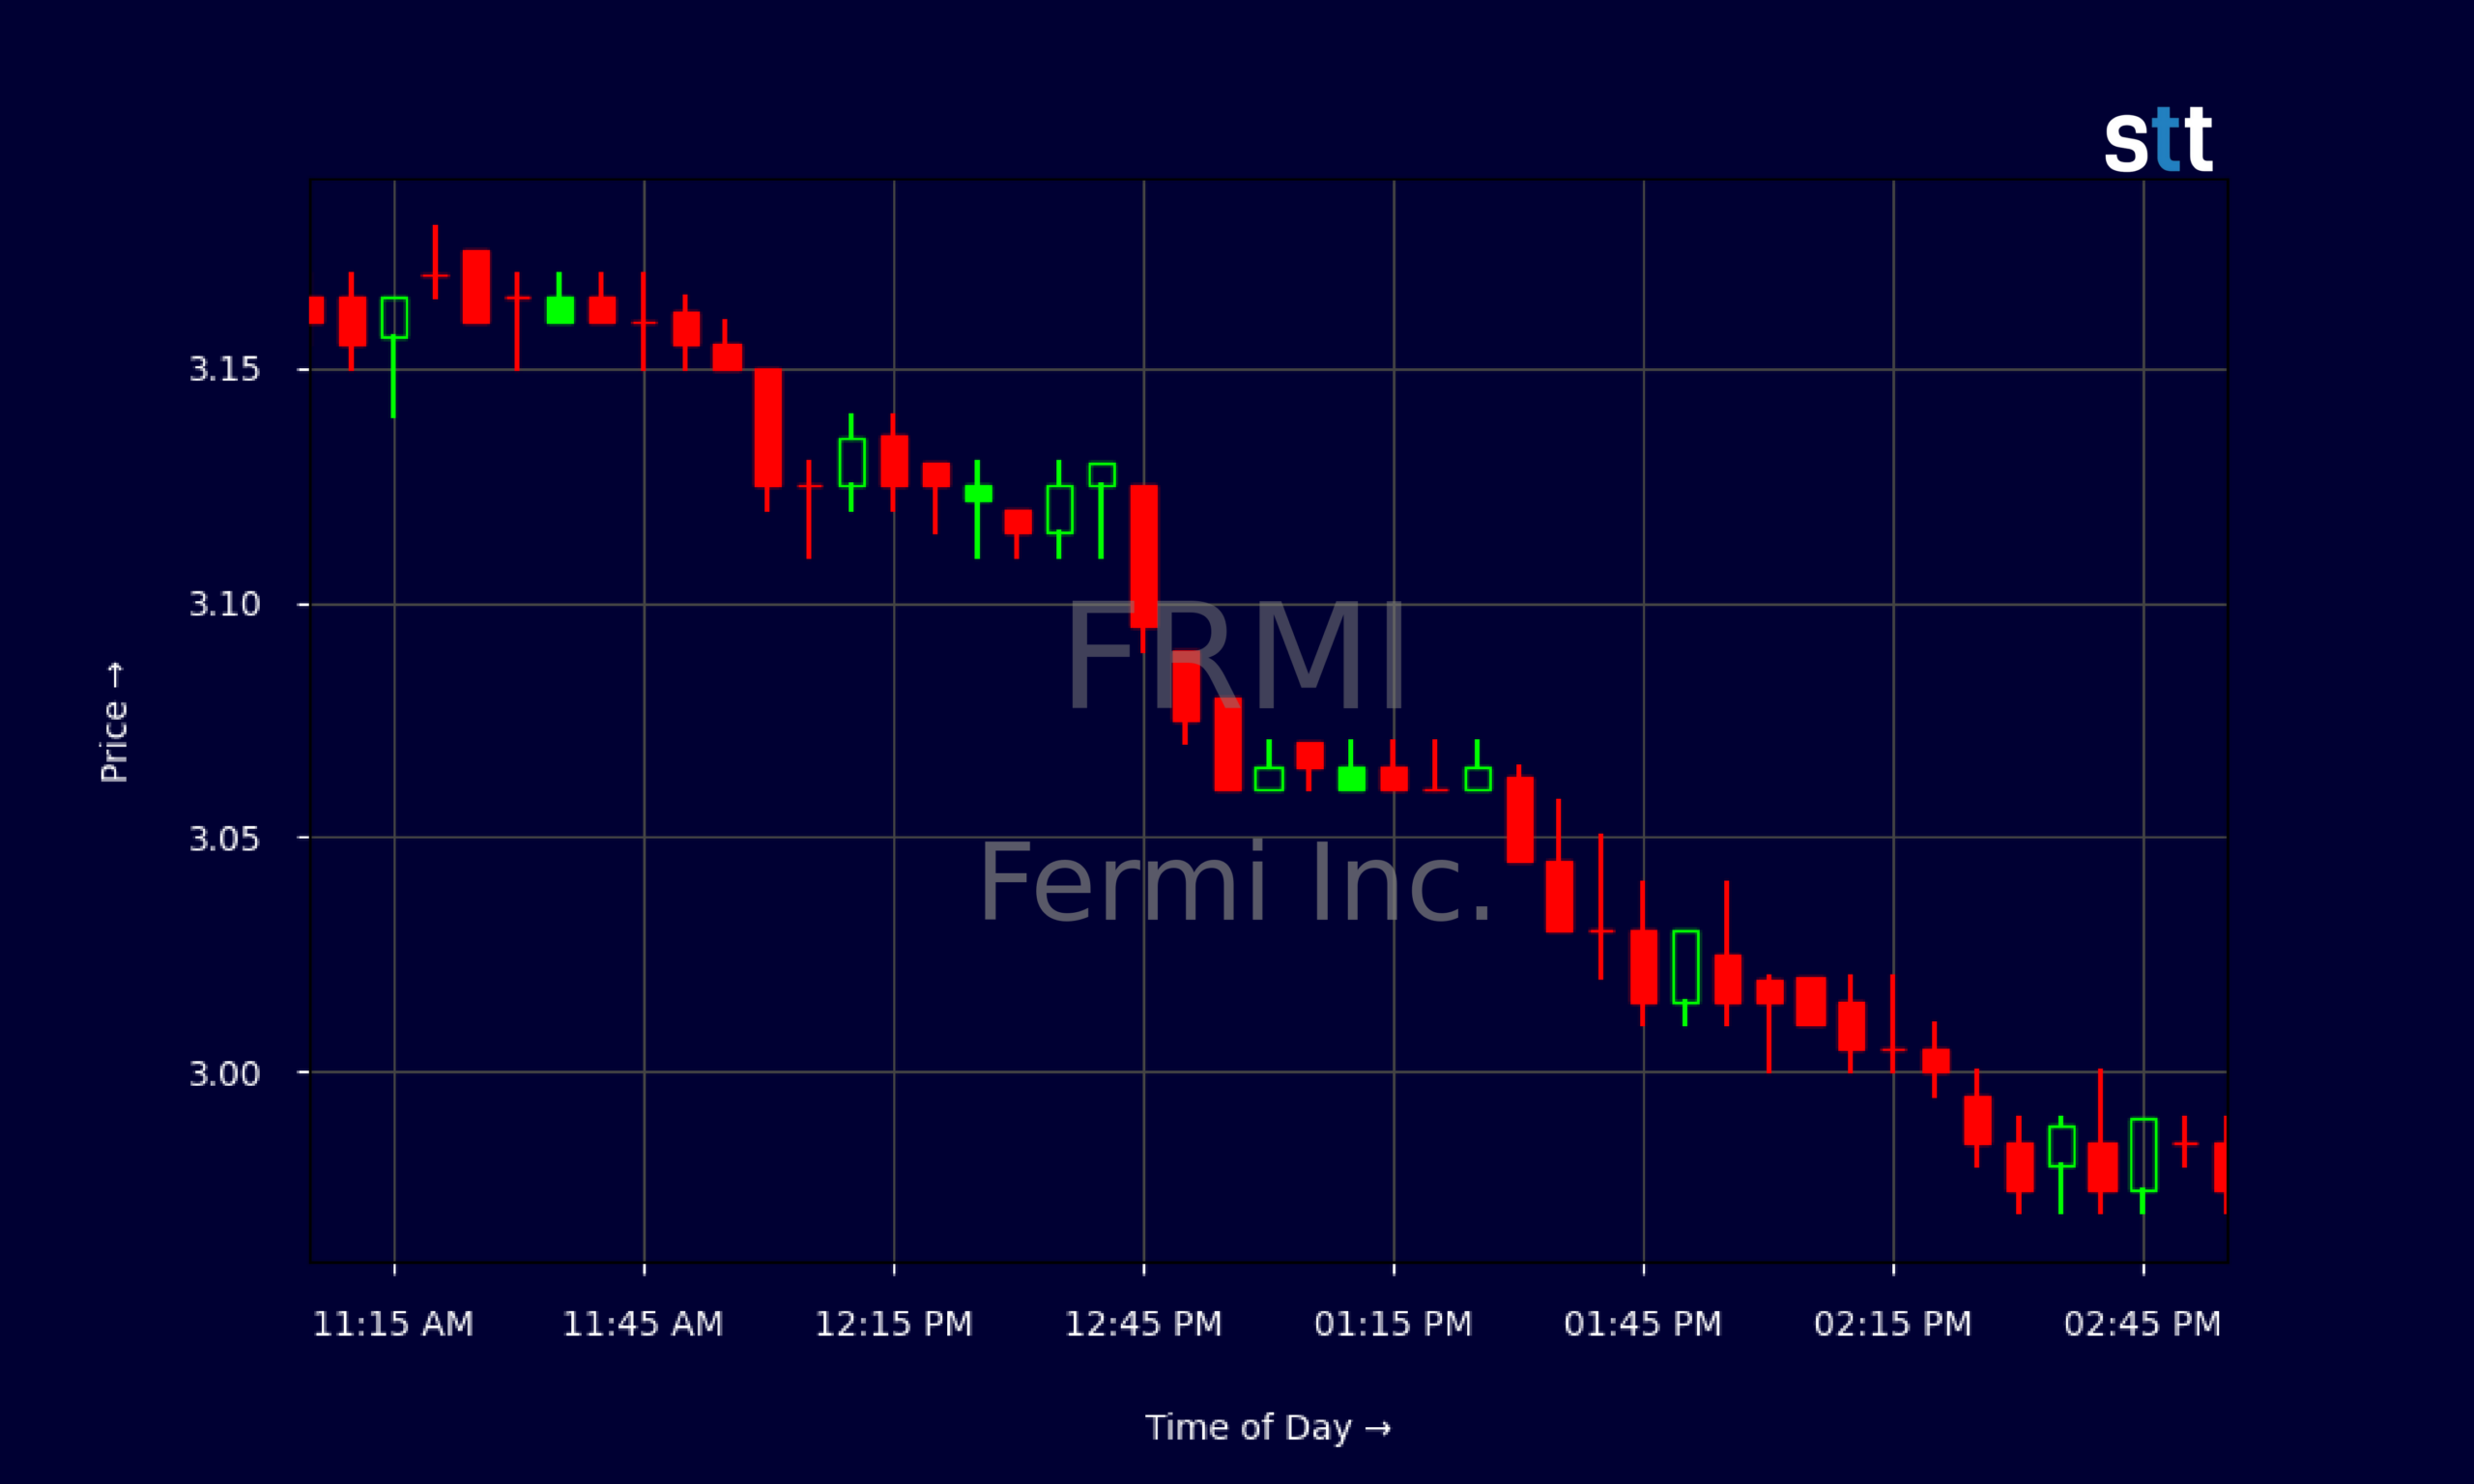
Live Update At 15:03:15 EDT: On Monday, October 19, 2026 Fermi Inc. stock [NASDAQ: FRMI] is trending down by -5.54%! Discover the key drivers behind this movement as well as our expert analysis in the detailed breakdown below.
Quick Financial Overview
FRMI is trading like a classic high‑risk, story‑driven small cap. On the daily chart, Fermi Inc. has slid from closes around $4.50 on 2026/09/24 down to about $2.99 on 2026/10/19. That’s roughly a one‑third drawdown in less than a month. For short‑term traders, that’s a strong downtrend, not just noise.
Under the hood, FRMI’s numbers back up the volatility. Fermi Inc. reported a quarterly net loss of about $25.8M, or roughly -$0.04 per share. EBITDA is negative, and free cash flow sits around -$233.6M. That tells traders FRMI is spending heavily and not yet generating enough cash to support itself.
More Breaking News
- SNDG Leverage ETF Pulls Back As Volatility Cools
- TTD Slides As Evercore Flags Weak Ad Demand Trend
- TRGP Stock Draws Wave Of Target Hikes Ahead Of Q3
- SKYD Plunges As Skydance Faces Legal And Debt Fallout
The balance sheet for Fermi Inc. shows about $62.5M in cash against $520.1M of current debt, with a current ratio of just 0.3. FRMI’s price‑to‑book near 2.1 and negative returns on assets and equity underline how speculative the story is. In simple terms, FRMI is a cash‑burning, leveraged name, and the chart is starting to reflect that risk.
Why Traders Are Watching FRMI’s $3 Level
FRMI has turned into a real lesson in how fast sentiment can flip when a story name runs out of momentum. Just weeks ago, Fermi Inc. was holding the low‑$4s, with repeated closes between $4.20 and $4.55 from 2026/09/24 to 2026/09/30. That zone acted as support for days. Once FRMI broke under $4 in early October, the character changed. Lower highs stacked up: $4.23 on 2026/10/06, then $3.97 and $3.66, and finally sub‑$3 by 2026/10/19.
For traders, that stair‑step lower tells a clear story: supply is in control. Every bounce in FRMI has been sold into. When you line that up with Fermi Inc.’s negative free cash flow and thin liquidity, the market is basically pricing in execution risk and potential dilution down the road.
Intraday, the 5‑minute chart shows FRMI opening near $3.26 and spending the entire day grinding lower into the high‑$2.90s. Range is tight, volume (implied by all those small candles) looks like churn, and price keeps snapping back to the $3 area. That sort of consolidation after a downtrend often sets up the next big move.
Short sellers are eyeing a clean break of $2.90 as the next push. Dip buyers are hoping Fermi Inc. can defend this round number and squeeze back toward $3.20–$3.30. Either way, FRMI offers exactly what active traders want: volatility, clear levels, and a fundamental backdrop that justifies strong opinions on both sides.
Conclusion
FRMI sits at a critical point where technicals and fundamentals are finally in sync, and not in a good way. The chart shows Fermi Inc. rolling over from the mid‑$4s into the high‑$2s and low‑$3s. The financials tell us why: negative earnings, negative free cash flow, a low current ratio, and meaningful debt obligations. That mix keeps pressure on FRMI and explains why every bounce has been short‑lived.
For disciplined traders, this is not a name to blindly marry. It’s a setup to stalk with a plan. FRMI around $3 gives clear risk levels: use the recent low as a stop if you’re trying to play a bounce, or lean on failed pops toward prior resistance if you’re trading the short side. Fermi Inc. will reward preparation and punish hope. As Tim Bohen, lead trainer with StocksToTrade says, “The best trades are the ones you can make without emotion. Plan it, then execute it as if it’s routine.” That mindset applies perfectly here: map out your risk, size appropriately, and execute your trading plan without hesitation or attachment.
As Tim Sykes always says, “Cut losses quickly and don’t believe the hype — believe the price action.” FRMI’s price action is talking right now. Traders who respect the trend, the liquidity risk, and the cash burn at Fermi Inc. will be the ones still standing when the next big move hits. This breakdown is for educational and research purposes only, but the lessons in FRMI’s chart are real.
This is stock news, not investment advice. StocksToTrade News delivers real-time stock market updates tailored to highlight the key catalysts driving short-term price movements. Our coverage is designed for active traders and investors who thrive in fast-moving markets, with a focus on volatile sectors like penny stocks, AI stocks, Robinhood stocks and other momentum plays. From earnings reports and FDA approvals to mergers, new contracts, and unusual trading volume, we break down the events that can spark significant price action.
Looking to level up your trading game? Explore StocksToTrade, the ultimate platform for traders. With powerful tools designed for swing and day trading, integrated news scanning, and even social media monitoring, StocksToTrade keeps you one step ahead.
Check out our quick startup guide for new traders!
- How to Read Stock Charts: A Guide for Beginners
- Trading Plan: 6 Steps to Create One
- How To Create a Stock Watchlist
Ready to build your watchlists? Check out these curated lists:
Once your watchlist is set, take the next step and trade with confidence using StocksToTrade’s robust platform. Don’t miss out — grab your 14-day trial for just $7 and experience the edge you need to thrive in today’s fast-paced markets.