

FedEx Freight Holding Company Inc. stocks have been trading up by 13.96 percent amid upbeat freight demand and logistics outlook.
Market Insights For Active Traders
- Weekly chart shows FedEx Freight Holding Company Inc. breaking out from the low $110s to mid-$120s, signaling strong short-term momentum.
- Intraday tape in FDXF shows steady higher lows through the session, with buyers defending dips around $125 and pushing toward $127 resistance.
- Revenue of about $8.80B and positive pretax margins show FedEx Freight Holding Company Inc. generating real earnings power despite recent negative free cash flow.
- Heavy use of debt financing and negative book value make FDXF a higher-risk, higher-leverage freight play that active traders must monitor closely.
- Key battleground for FDXF in the near term is the $123–$127 band, where control between short-term buyers and sellers will likely set the next directional move.
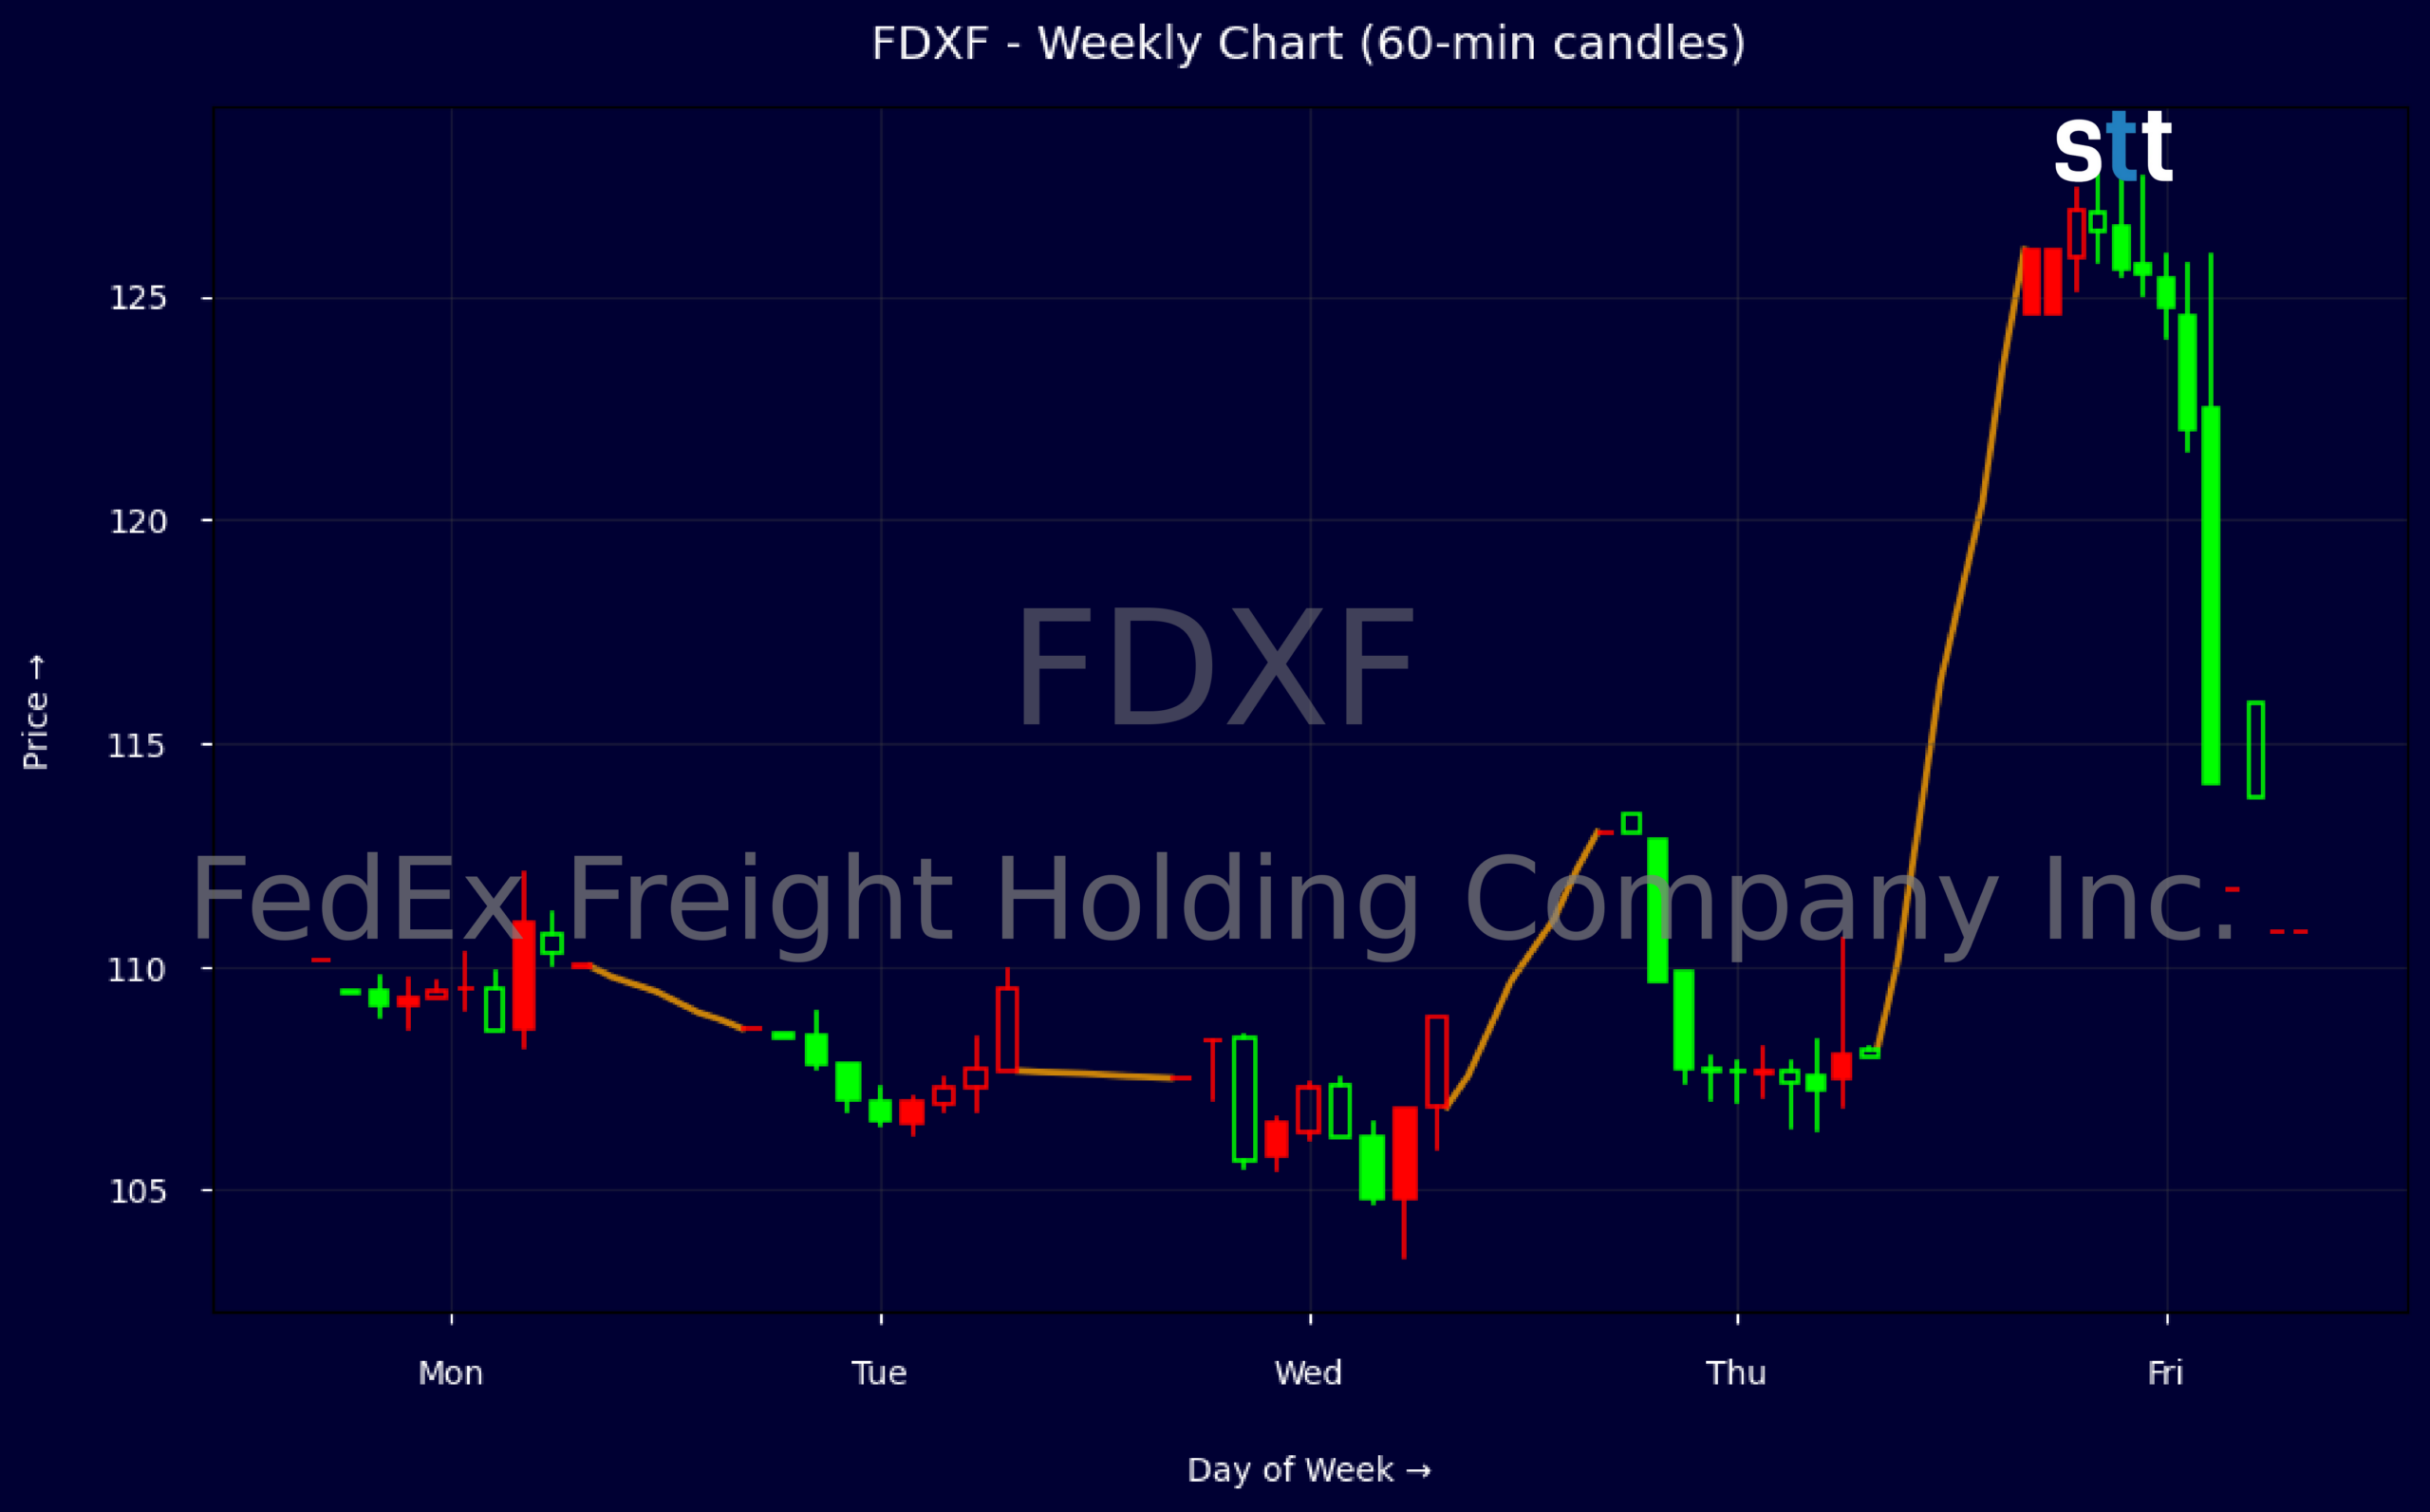
Weekly Update Oct 26 – Oct 30, 2026: On Friday, October 30, 2026 FedEx Freight Holding Company Inc. stock [NYSE: FDXF] is trending up by 13.96%! Discover the key drivers behind this movement as well as our expert analysis in the detailed breakdown below.
Industrials industry expert:
Analyst sentiment – positive
FDXF sits in a niche, asset‑intensive transportation/industrial slot with $8.8B in revenue and a solid 9.9% pre‑tax margin, but its balance sheet quality is weak. Negative equity (BVPS –$3.32, price‑to‑book –34.7x) and long‑term debt plus capital leases of $6.15B against $6.88B of assets underscore a leveraged structure. ROA of 4.4% is acceptable but not exceptional. Operating cash flow and free cash flow are both negative, relying heavily on $4.25B of fresh long‑term debt.
Technically, the stock has shifted from consolidation to a sharp upside breakout. In four sessions it moved from a 107–113 range to a 126 handle, with the final bar printing a strong close at 124.6 near the weekly high, signaling aggressive demand and likely elevated volume. The dominant trend is up. First actionable level is support at 113; pullbacks toward 113–115 offer a defined‑risk long entry with a stop below 107.
More Breaking News
- SPCX Slides As Headline Risk And Competition Hammer Sentiment
- WKHS Stock Draws Traders As EV Orders Grow And AI Pivot Emerges
- CareDx CDNA Rips Higher After Big Earnings Beat And Guidance Hike
- Regeneron Stock Jumps As Libtayo Data Fuels Bullish Targets
With no new fundamental news, trading is being driven by positioning and momentum rather than incremental information. Versus broader Industrials and Transportation benchmarks, FDXF screens as higher‑risk, higher‑beta given leverage and negative free cash flow, but with better near‑term operating margins. The breakout projects an initial upside objective around 135, with support at 113 and secondary support near 107. Risk‑reward favors tactical longs above 113; below 107 the setup deteriorates.
Quick Financial Overview
FedEx Freight Holding Company Inc. is posting sizable revenue near $8.80B, with a pretax profit margin of 9.9%. That means the core business is profitable at the operating level and has room to support its capital-heavy freight network. Return on assets of 4.39% is modest but positive, suggesting the company is squeezing reasonable earnings out of its asset base, even with a large fleet and infrastructure footprint.
On the balance sheet, FDXF runs with high leverage. Total liabilities sit above total assets, and common equity is negative, with book value per share around -$3.32. Long-term debt and capital lease obligations are roughly $6.15B, backed by about $4.75B of net property, plant, and equipment. For traders, that mix means the market is valuing FDXF more like an earnings and cash-flow vehicle than an asset play.
Cash flow data shows stress in the latest quarter. Operating cash flow was about -$346M, while free cash flow was also roughly -$346M, reflecting working capital pressure and heavy capital needs. Yet net income from continuing operations was positive at $158M, and management raised around $4.25B in long-term debt, boosting cash to $251M by period end. This combination—positive earnings, negative free cash, and fresh borrowing—creates a nuanced backdrop for how the stock trades.
Conclusion
This is stock news, not investment advice. StocksToTrade News delivers real-time stock market updates tailored to highlight the key catalysts driving short-term price movements. Our coverage is designed for active traders and investors who thrive in fast-moving markets, with a focus on volatile sectors like penny stocks, AI stocks, Robinhood stocks and other momentum plays. From earnings reports and FDA approvals to mergers, new contracts, and unusual trading volume, we break down the events that can spark significant price action.
Looking to level up your trading game? Explore StocksToTrade, the ultimate platform for traders. With powerful tools designed for swing and day trading, integrated news scanning, and even social media monitoring, StocksToTrade keeps you one step ahead.
Check out our quick startup guide for new traders!
- How to Read Stock Charts: A Guide for Beginners
- Trading Plan: 6 Steps to Create One
- How To Create a Stock Watchlist
Ready to build your watchlists? Check out these curated lists:
Once your watchlist is set, take the next step and trade with confidence using StocksToTrade’s robust platform. Don’t miss out — grab your 14-day trial for just $7 and experience the edge you need to thrive in today’s fast-paced markets.