
Exascale Labs Holdings Inc. stocks have been trading down by -14.42 percent following reports of weakened quarterly earnings guidance.
Click Here for a Millionaire's POV on Trading XLAB
SUBSCRIBE FOR ALERTSJOIN 50,000+ ACTIVE TRADERS
Key Takeaways
- Shares of Exascale Labs Holdings Inc. have swung from below $1 to above $3 in weeks, putting XLAB firmly on high-volatility watchlists.
- Recent daily candles show sharp spikes followed by pullbacks, signaling aggressive momentum trading rather than steady accumulation.
- XLAB’s revenue sits around $7.0M with steep negative margins, so the company is still in early, high-burn mode.
- The balance sheet shows about $4.2M in cash but negative equity, making dilution risk a key theme for active traders.
- Intraday action highlights tight consolidations around $2.60–$2.70 that short-term traders are using for scalps and risk-defined setups.
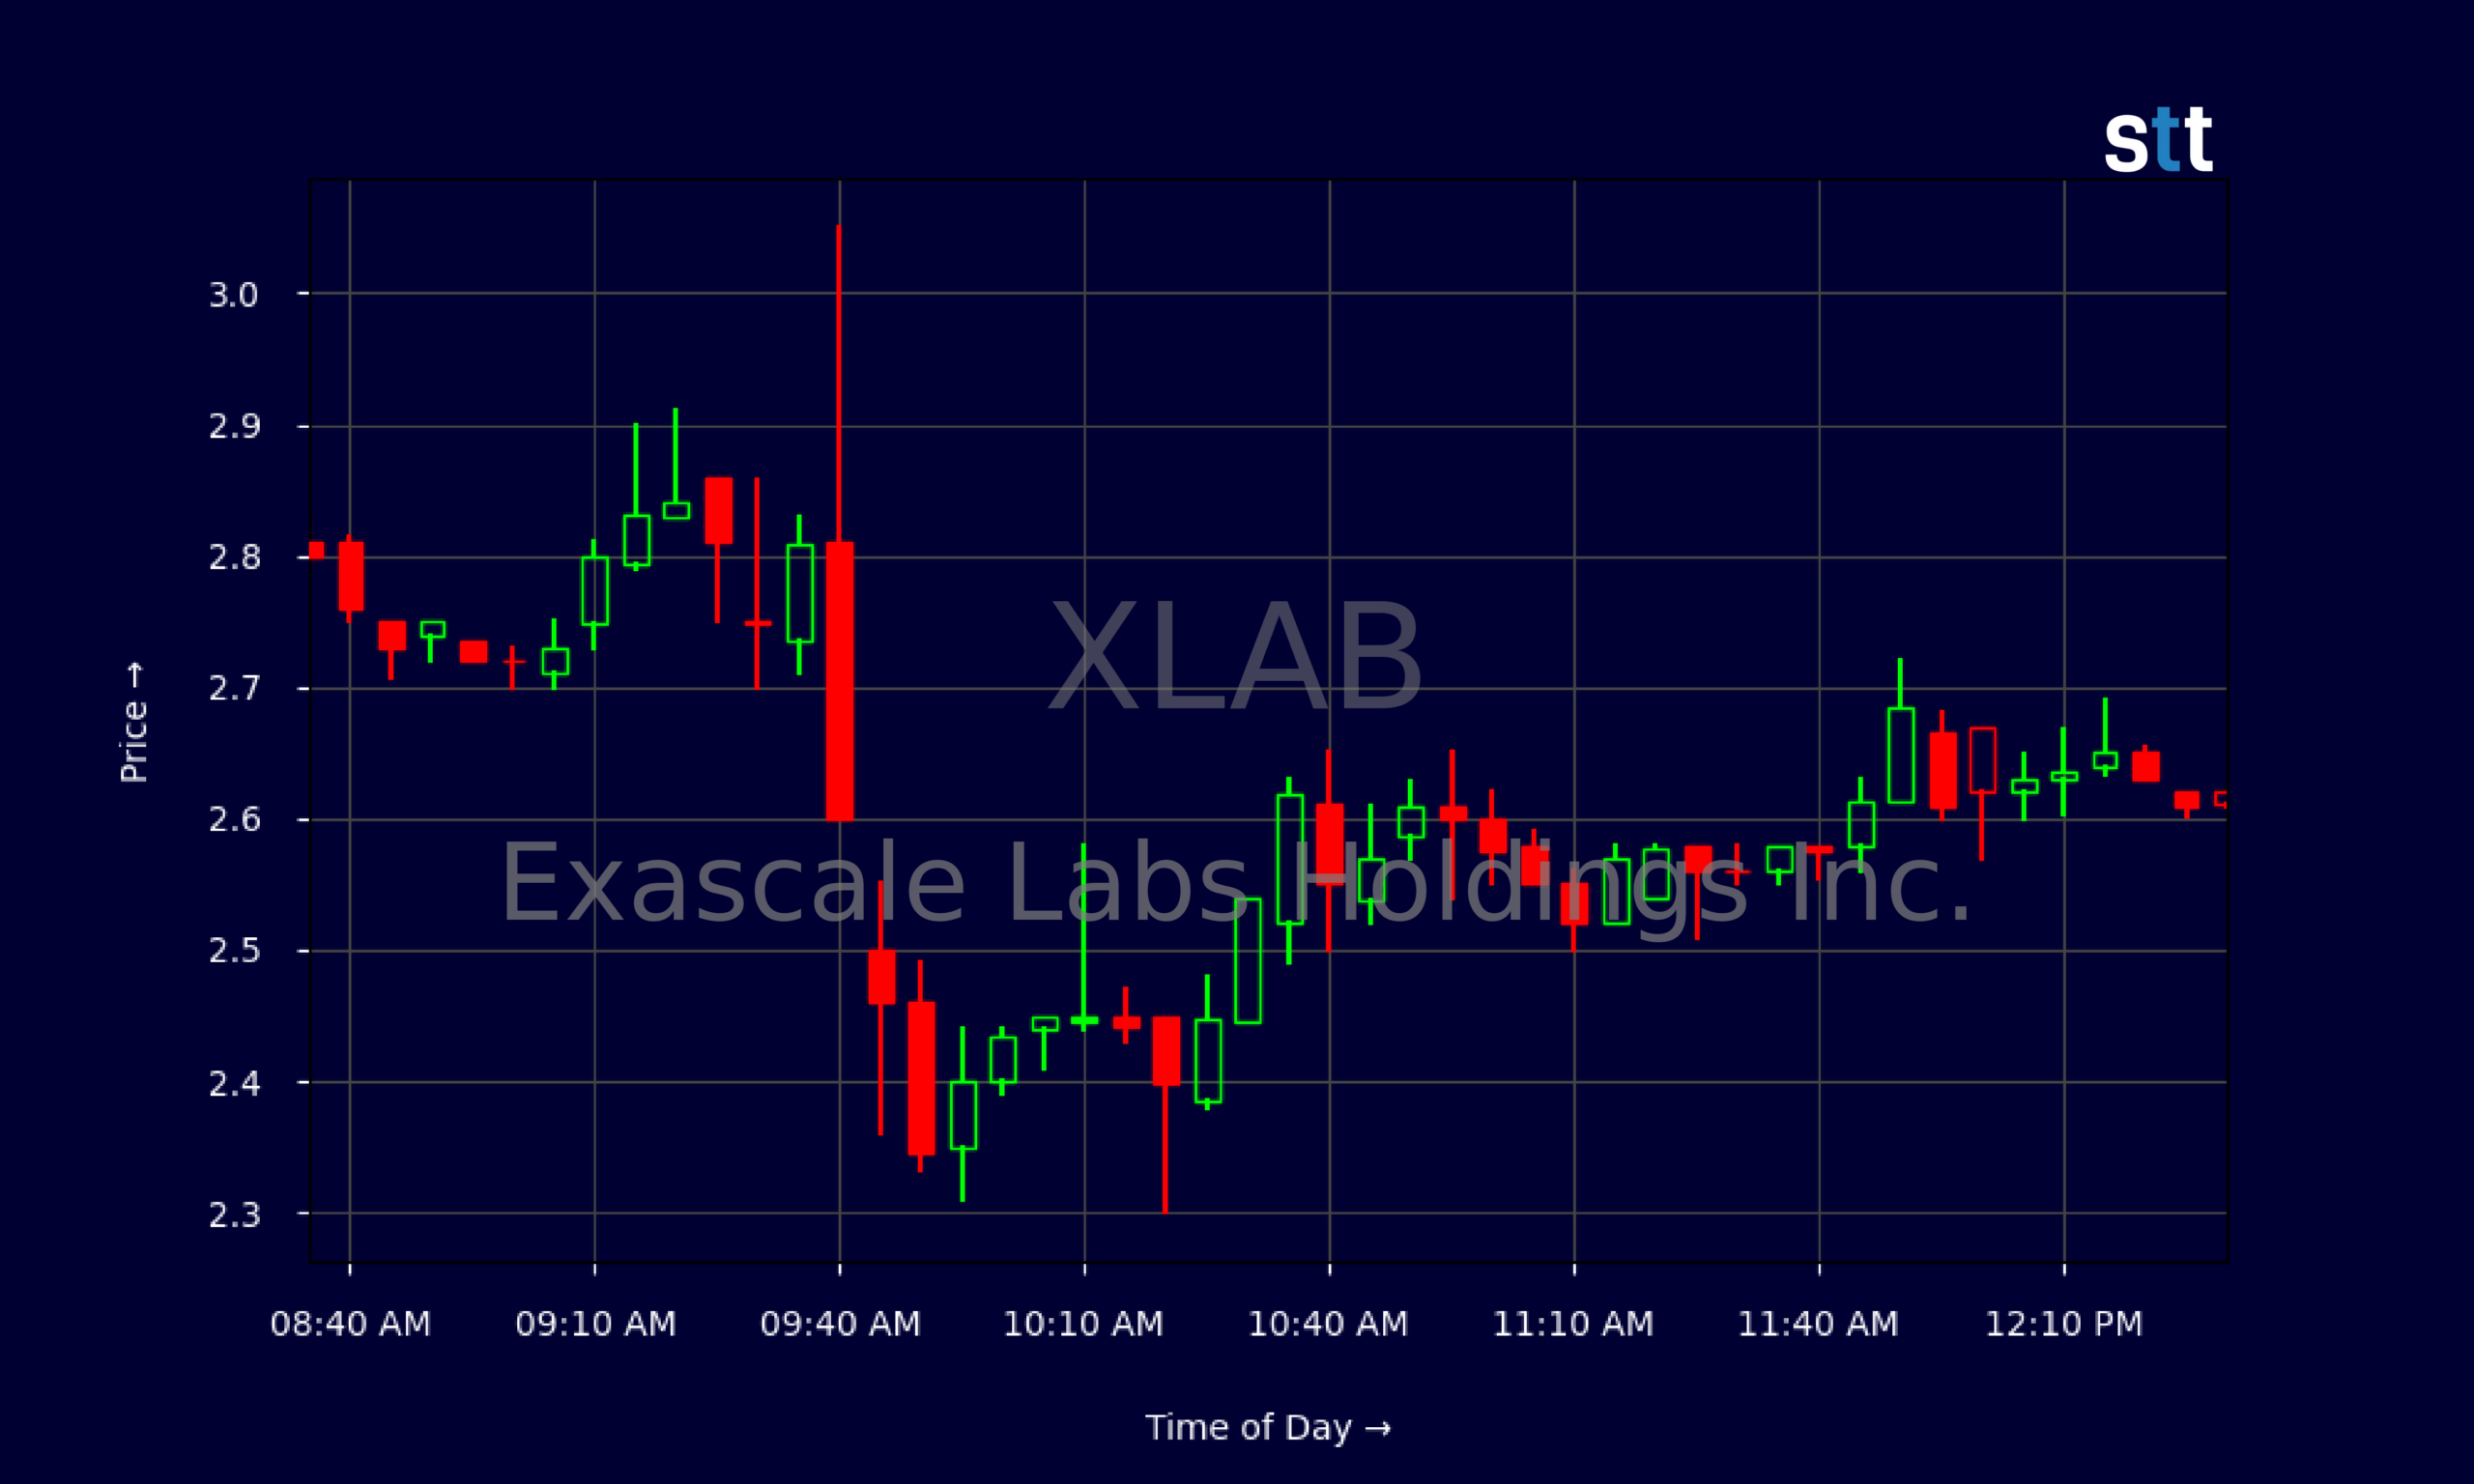
Live Update At 12:36:32 EDT: On Tuesday, October 20, 2026 Exascale Labs Holdings Inc. stock [NASDAQ: XLAB] is trending down by -14.42%! Discover the key drivers behind this movement as well as our expert analysis in the detailed breakdown below.
Quick Financial Overview
Exascale Labs Holdings Inc., trading under the ticker XLAB, is a classic small-cap battleground name. The company generated roughly $7.0M in revenue over the last period, but its pretax profit margin sits near -70%. That tells traders XLAB is still spending heavily to build its business and has not reached consistent profitability.
On the balance-sheet side, XLAB reports about $4.2M in cash and total assets around $7.3M. The problem is on the other side of the ledger. Total liabilities are roughly $20.3M, and stockholders’ equity is negative at about -$13.0M. A negative book value per share near -$0.20 and a price-to-sales ratio around 16.7 show that traders are paying up for the story, not the current fundamentals.
More Breaking News
- GM Stock Holds Up As Q3 Sales And EV Momentum Slide
- AMD Stock Rallies As AI Demand Supercharges Outlook
- XLAB Stock Whipsaws As Traders Target High-Volatility Setup
- SOFI Stock Draws Firepower As Stablecoin And Wall Street Bets Align
Cash flow is one bright spot. XLAB posted positive operating cash flow of about $2.7M and free cash flow in a similar range, helped by capital raises. Financing cash flow of about $4.4M, with over $4.2M from common stock issuance, underlines how much XLAB depends on the market to fund operations. For traders, that means volatility around any new capital raise is part of the game.
Why Traders Are Watching XLAB’s Momentum
XLAB has become a momentum playground. The daily chart shows Exascale Labs Holdings Inc. trading at $2.43–$2.58 range levels in late September, then sliding toward $1.00 by early October. From there, the stock launched a huge move. XLAB bounced off sub-$1 lows around 2026/10/14–2026/10/15 and ripped to an intraday high near $3.84 on 2026/10/16. That’s the kind of parabolic action momentum traders wait for all year.
After that spike, XLAB pulled back but stayed elevated. Closes around $3.06 on 2026/10/19 and $2.61 on 2026/10/20 show the stock is still up heavily from the early-October base. Big ranges — a high of $3.05 and low of $2.30 on 2026/10/20 — confirm ongoing tug-of-war between longs and shorts.
The intraday 5‑minute chart tells the same story in finer detail. Early in the session, XLAB flushed from a $2.81–$3.05 zone down into the mid-$2.30s. But instead of collapsing, Exascale Labs Holdings Inc. based between $2.40 and $2.65, then chopped in a tight band around $2.60 into midday. That kind of intraday consolidation after a hard selloff often sets up secondary moves — either a squeeze back toward the morning highs or a controlled breakdown if bids vanish.
For day traders, XLAB’s combination of expanding volume, wide intraday ranges, and clear intraday levels around $2.30 support and $3.00 resistance is ideal. Exascale Labs Holdings Inc. gives multiple entries and exits, but it demands strict risk control. One bad chase in XLAB can erase a week of gains.
Conclusion
XLAB sits in that dangerous but attractive zone where the chart looks explosive while the fundamentals still lag. Revenue of about $7.0M against large losses and negative equity tells traders this is not a value play. It’s a speculation vehicle. Exascale Labs Holdings Inc. relies heavily on equity financing, which means more offerings and dilution are always in the background. That helps explain why sharp spikes on the XLAB chart often meet hard selling — experienced traders lock in profits quickly, knowing the long-term story is unproven.
At the same time, XLAB’s positive operating and free cash flow in the latest period gives the company some breathing room. With roughly $4.2M in cash and only about 10 employees, Exascale Labs Holdings Inc. can keep pushing its growth plans near term. For traders, that translates into more potential catalysts and more volatility around each new filing or financial update, even when the exact timing is unclear. In that kind of fast-moving environment, many newer market participants fear missing the perfect entry or exit, but as Tim Bohen, lead trainer with StocksToTrade says, “Time and experience have taught me that missed opportunities are part of the game. There’s always another setup around the corner.” That mindset helps traders stay disciplined instead of chasing every single move in a ticker like XLAB.
Technically, the key zones are obvious. Below $2.30–$2.40, the recent bounce setup in XLAB starts to break. Above $3.00–$3.80, the prior blow‑off top becomes a roadmap for any future squeeze. As Tim Sykes loves to say, “The chart is the news for these small caps — learn the patterns, cut losses fast, and never fall in love with the story.” XLAB is a textbook case of that mindset in action, and traders who respect risk are the ones most likely to stick around long enough to learn from it.
This article is for educational and research purposes only and is not investment advice.
This is stock news, not investment advice. StocksToTrade News delivers real-time stock market updates tailored to highlight the key catalysts driving short-term price movements. Our coverage is designed for active traders and investors who thrive in fast-moving markets, with a focus on volatile sectors like penny stocks, AI stocks, Robinhood stocks and other momentum plays. From earnings reports and FDA approvals to mergers, new contracts, and unusual trading volume, we break down the events that can spark significant price action.
Looking to level up your trading game? Explore StocksToTrade, the ultimate platform for traders. With powerful tools designed for swing and day trading, integrated news scanning, and even social media monitoring, StocksToTrade keeps you one step ahead.
Check out our quick startup guide for new traders!
- How to Read Stock Charts: A Guide for Beginners
- Trading Plan: 6 Steps to Create One
- How To Create a Stock Watchlist
Ready to build your watchlists? Check out these curated lists:
Once your watchlist is set, take the next step and trade with confidence using StocksToTrade’s robust platform. Don’t miss out — grab your 14-day trial for just $7 and experience the edge you need to thrive in today’s fast-paced markets.