
Exascale Labs Holdings Inc. stocks have been trading up by 18.38 percent after announcing a transformative AI infrastructure partnership.
Click Here for a Millionaire's POV on Trading XLAB
SUBSCRIBE FOR ALERTSJOIN 50,000+ ACTIVE TRADERS
Key Takeaways
- Shares of XLAB have sold off hard from late-September levels above $2.80 to recent lows under $0.80 before a sharp bounce.
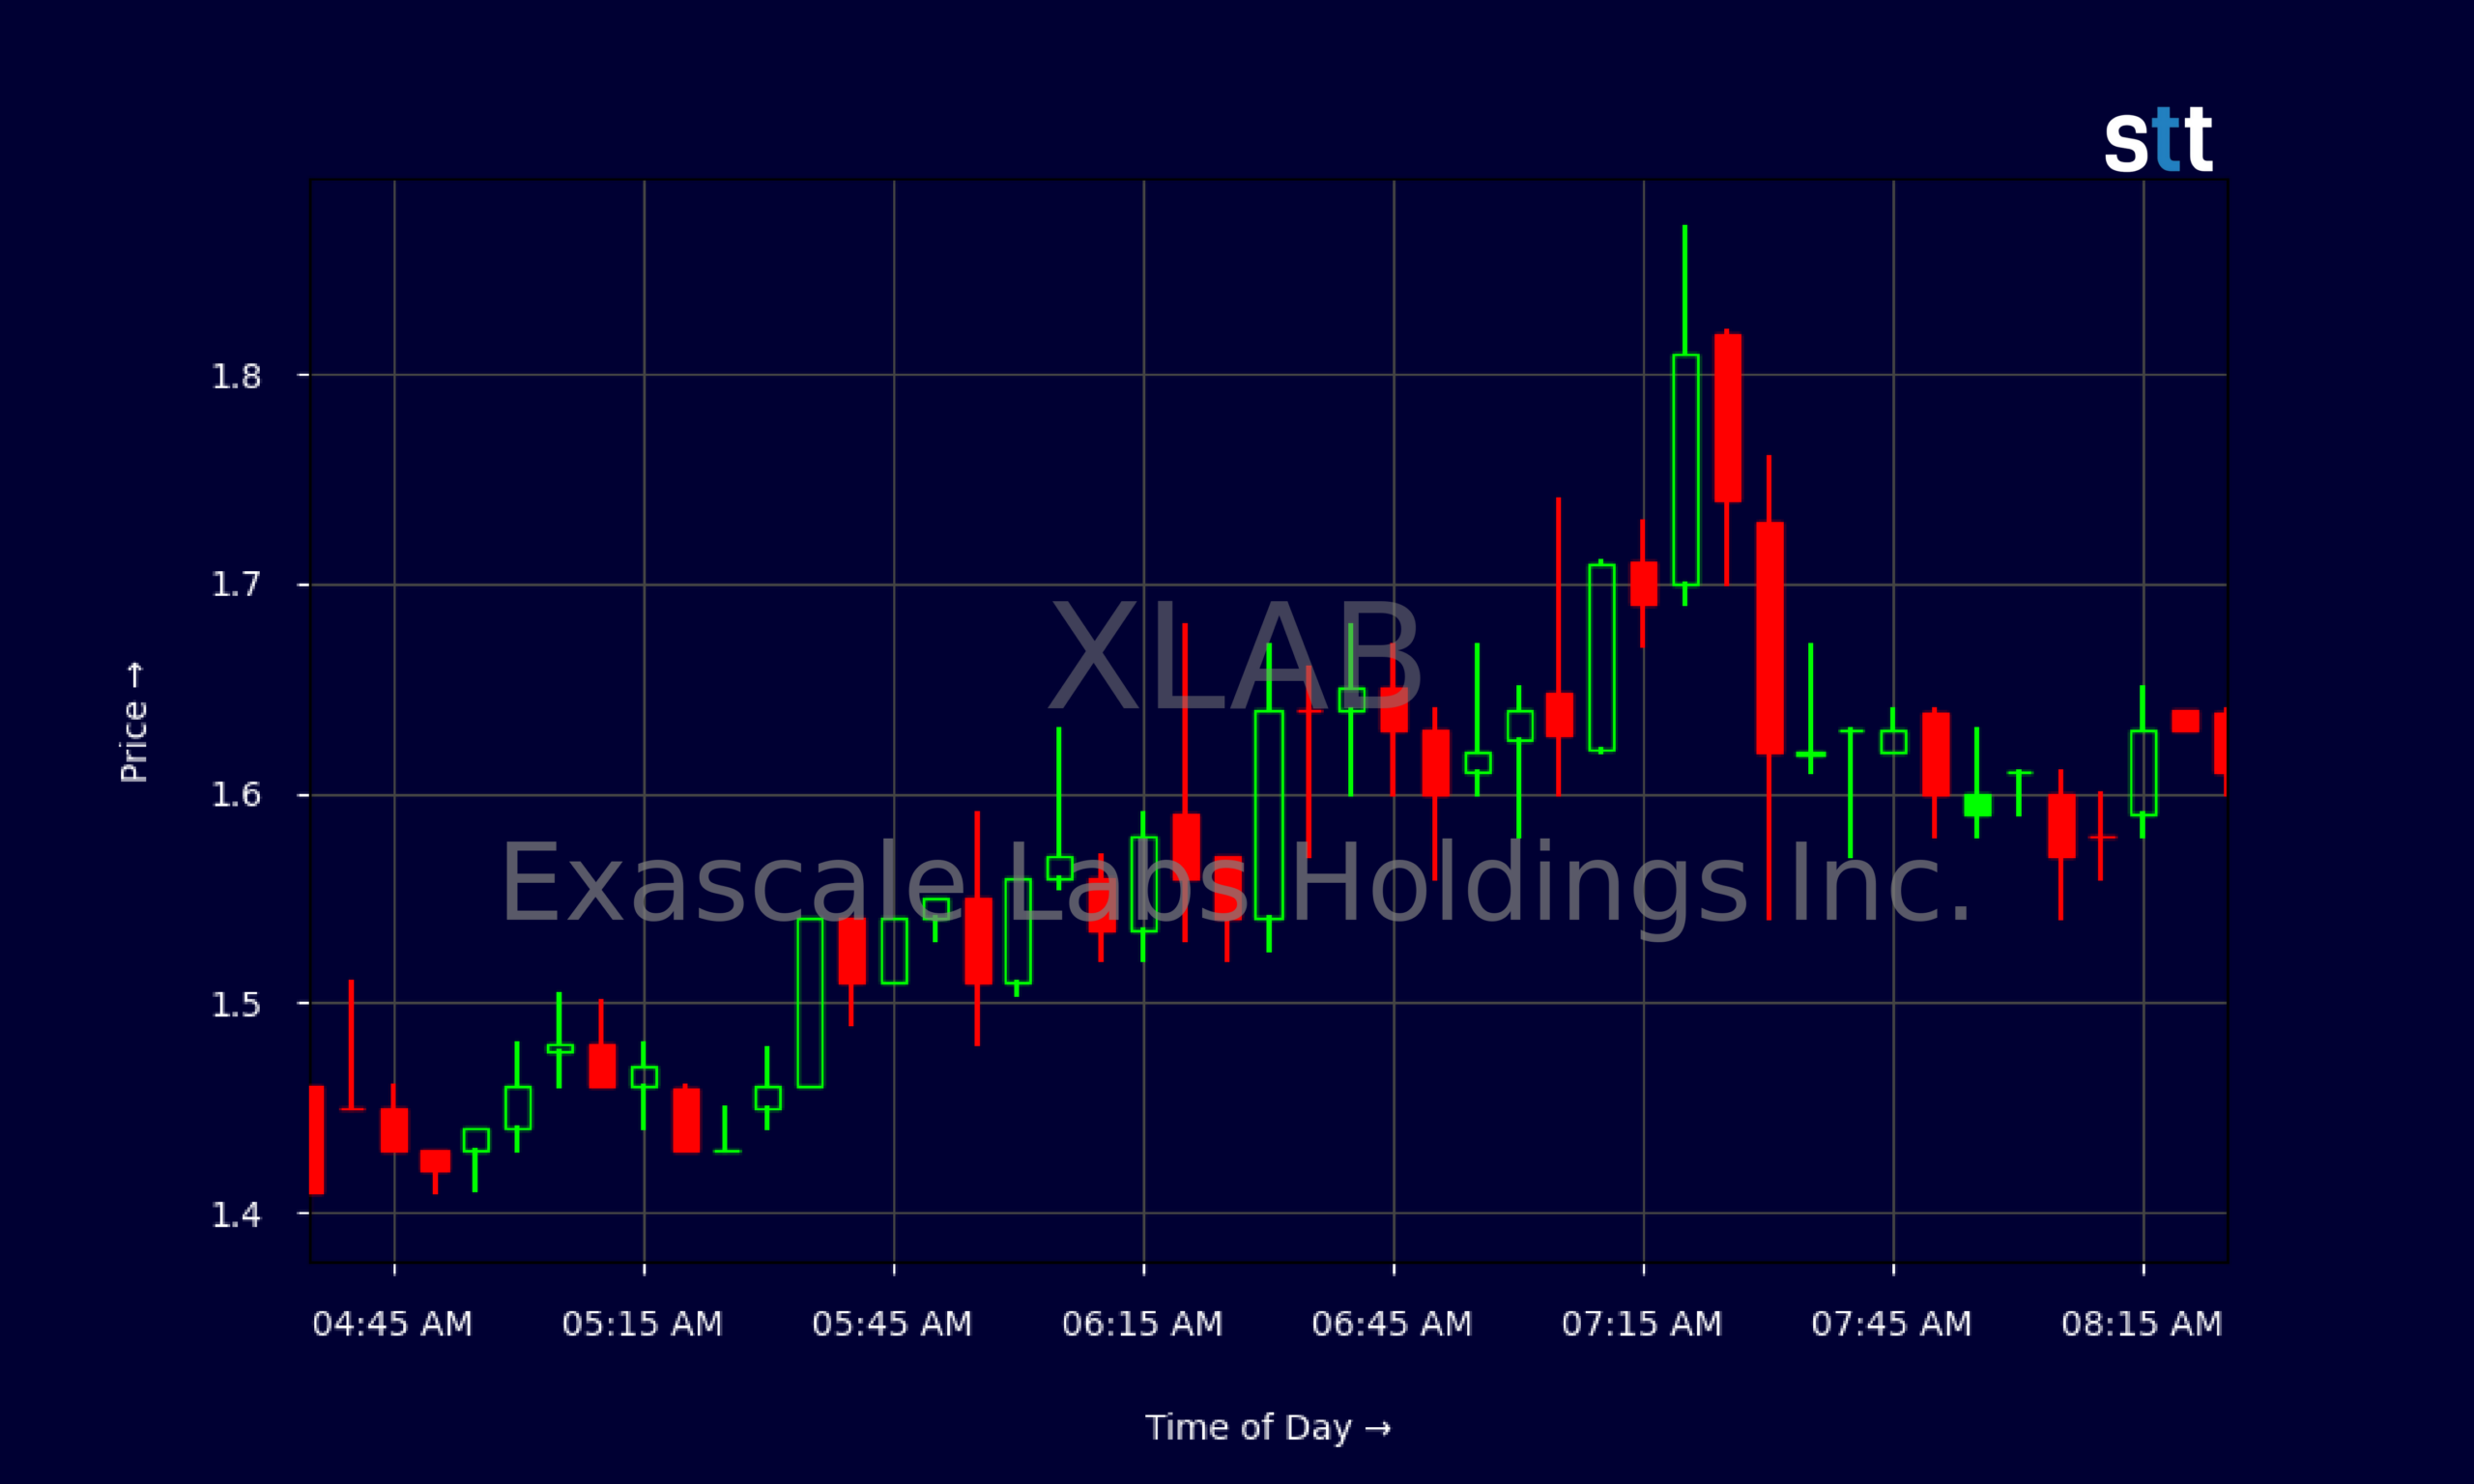
- Intraday action shows Exascale Labs Holdings Inc. grinding sideways around $1.50–$1.60, signaling short-term consolidation after heavy volatility.
- XLAB posts roughly $7.0M in revenue but runs a steep pretax loss, with negative margins and negative book value.
- Cash of about $4.2M versus heavy short-term liabilities leaves Exascale Labs Holdings Inc. reliant on continued capital markets access.
- Traders are watching whether XLAB can hold recent higher lows and build a base above $1.30.
Live Update At 08:32:44 EDT: On Friday, October 16, 2026 Exascale Labs Holdings Inc. stock [NASDAQ: XLAB] is trending up by 18.38%! Discover the key drivers behind this movement as well as our expert analysis in the detailed breakdown below.
Quick Financial Overview
XLAB is a tiny, high‑risk name that trades more on sentiment and momentum than on strong fundamentals. The latest report shows Exascale Labs Holdings Inc. generating about $7.0M in revenue, but the business is not profitable. The pretax profit margin sits near -70%, so for every $1 in sales, the company loses roughly $0.70. That is a big hole to climb out of.
On the balance‑sheet side, XLAB reports around $4.2M in cash against total liabilities of about $20.3M. Stockholders’ equity is deeply negative at roughly -$13.0M, which is why Exascale Labs Holdings Inc. shows a negative book value per share near -$0.20 and a price‑to‑book ratio that is also negative. The market is basically saying: the story and future potential matter more than current assets.
More Breaking News
- ETSY Stock Rallies As Upgrades And Payoneer Deal Boost Bulls
- GUTS Stock Reels As Revita Trial Fallout Fuels Class Actions
- ZTG Stock Slides As Volatility And Valuation Flash Warning Signs
- Tesla Stock Jumps As Q3 Deliveries And AI Story Heat Up
At the same time, XLAB did generate positive operating cash flow of about $2.7M in the latest quarter, largely helped by working capital shifts and stock issuance that brought in about $4.3M. For traders, that means Exascale Labs Holdings Inc. still has runway, but it is fueled by dilution and needs to keep raising or improving operations to stay in the game.
Why Traders Are Watching XLAB Price Action
The chart is where XLAB really speaks. In late September, Exascale Labs Holdings Inc. traded between $2.80 and just over $3.00. Since then, the stock has been in a steady downtrend, breaking $2.00, then $1.50, and finally dumping under $1.00. The recent low around $0.78 marks a massive drawdown from the $3 area — about a 70% slide in just a few weeks. That kind of move tells traders there is serious overhead supply and likely a lot of bagholders on every pop.
But XLAB is not just dying quietly. The latest daily candle shows the stock opening near $0.86, flushing below $0.80, then snapping back to close around $1.36. That’s a monster intraday reversal and a signal that dip‑buyers are willing to step in. For active traders, Exascale Labs Holdings Inc. now becomes a classic bounce‑and‑fade candidate: big range, trapped shorts, and beaten‑down longs looking for exits into strength.
Zoom in to the five‑minute chart and you see XLAB grinding in a tight channel between roughly $1.45 and $1.65 for several hours. That tells you the panic phase is cooling and Exascale Labs Holdings Inc. is trying to build a new equilibrium. Range contraction like this often comes before the next expansion — either a push toward $1.80 and above, or a roll back toward $1.20 and the prior day’s support. Short‑term traders will key off those levels as intraday lines in the sand while XLAB searches for a direction.
Conclusion
XLAB is the kind of speculative chart that momentum traders study every night. The fundamentals of Exascale Labs Holdings Inc. show a small revenue base, heavy losses, and negative equity, which is not what long‑term holders want to see. But this same weak foundation explains the big swings. When sentiment shifts even a little, XLAB can rip or dump fast because there is not much fundamental anchor on the price.
From a risk‑management angle, Exascale Labs Holdings Inc. remains a textbook “hot potato” ticker. The big fade from the $3 area, the breakdowns through each support level, and the violent bounce from sub‑$1 all highlight why you never marry a stock like XLAB. The edge is in trading the moves, not believing a story. As Tim Bohen, lead trainer with StocksToTrade says, “Success in trading is more about cutting losses quickly than finding winners.” That mindset fits perfectly with how XLAB trades, where disciplined risk control matters far more than chasing home‑run gains.
Traders in this community know the drill: focus on key levels, volume, and the broader market mood. If XLAB holds above the recent $1.30–$1.40 zone and pushes with strong volume, it can stay on watch for continuation. If it loses that area, the bounce risks turning into just another dead‑cat move on Exascale Labs Holdings Inc.
Tim Sykes says it best: “The market doesn’t care about your opinion, only your preparation.” XLAB rewards the prepared — those who study the chart, respect liquidity, and, most importantly, cut losses quickly when the trade proves them wrong.
This is stock news, not investment advice. StocksToTrade News delivers real-time stock market updates tailored to highlight the key catalysts driving short-term price movements. Our coverage is designed for active traders and investors who thrive in fast-moving markets, with a focus on volatile sectors like penny stocks, AI stocks, Robinhood stocks and other momentum plays. From earnings reports and FDA approvals to mergers, new contracts, and unusual trading volume, we break down the events that can spark significant price action.
Looking to level up your trading game? Explore StocksToTrade, the ultimate platform for traders. With powerful tools designed for swing and day trading, integrated news scanning, and even social media monitoring, StocksToTrade keeps you one step ahead.
Check out our quick startup guide for new traders!
- How to Read Stock Charts: A Guide for Beginners
- Trading Plan: 6 Steps to Create One
- How To Create a Stock Watchlist
Ready to build your watchlists? Check out these curated lists:
Once your watchlist is set, take the next step and trade with confidence using StocksToTrade’s robust platform. Don’t miss out — grab your 14-day trial for just $7 and experience the edge you need to thrive in today’s fast-paced markets.