

DXC Technology Company faces heightened investor concern after its most negative governance headline, as stocks have been trading down by -22.15 percent.
What Traders Need To Know
- Shares dropped roughly 26%–27% intraday into the high‑$8s, showing aggressive selling after DXC Technology Company updated its outlook.
- Q1 guidance at $0.40 EPS versus $0.68 expected and revenue of $2.97B–$3.0B versus $3.09B consensus signals weaker near‑term earnings power.
- FY27 targets of $2.40–$2.90 EPS and $12.11B–$12.35B revenue trail current Street estimates, pointing to a softer multi‑year path.
- Recent Q4 FY26 results showed slightly lower revenue, weaker organic growth, a swing to a GAAP loss, softening bookings, and guidance for further margin and free‑cash‑flow pressure.
- Stifel cut its price target from $14 to $12 while maintaining Hold, reflecting trimmed upside expectations after DXC’s disappointing update.
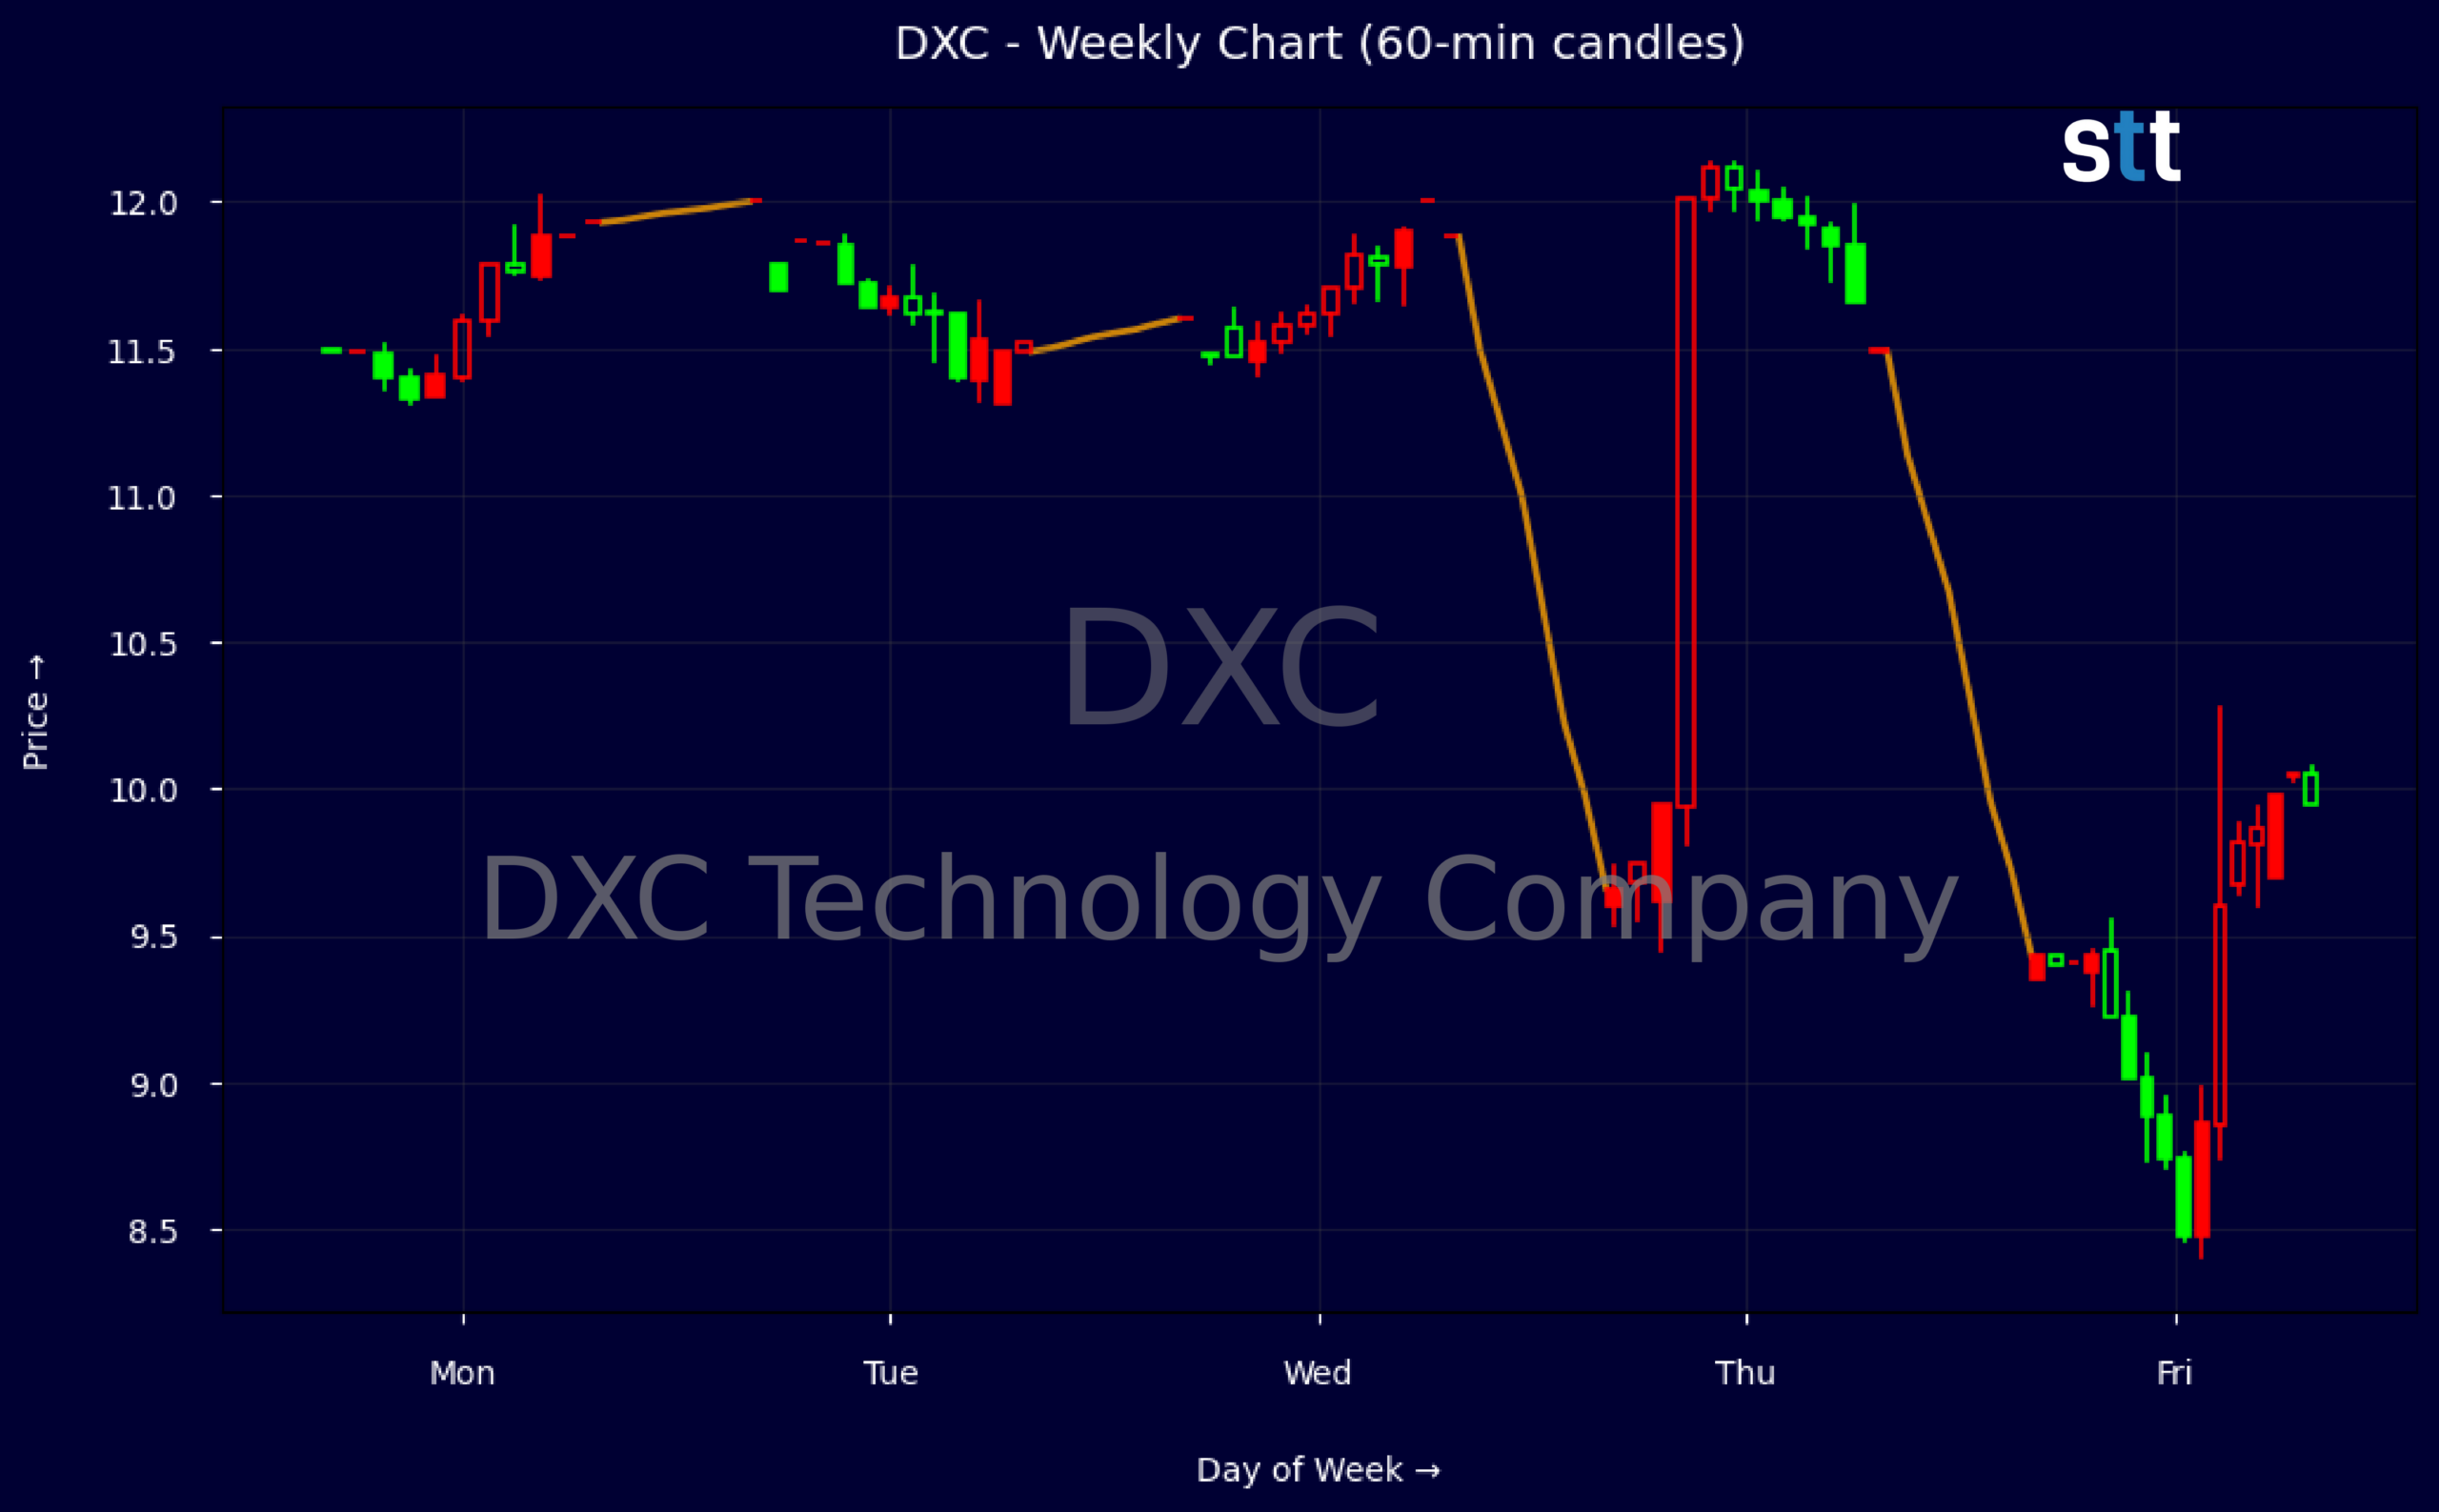
Weekly Update May 04 – May 08, 2026: On Sunday, May 10, 2026 DXC Technology Company stock [NYSE: DXC] is trending down by -22.15%! Discover the key drivers behind this movement as well as our expert analysis in the detailed breakdown below.
Technology industry expert:
Analyst sentiment – negative
DXC remains a subscale, structurally challenged IT services player with shrinking revenue (‑5–7% CAGR over 3–5 years) and thin profitability despite a respectable 16.9% EBITDA margin and 7.3% EBIT margin. The stock screens optically cheap (P/E 4.1x, ~0.13x sales, ~0.5x book, ~1x cash flow), but leverage is elevated (total debt/equity 1.37x, long‑term debt $3.6B) and ROA/ROE are weak and inconsistent. Free cash flow is solid ($266M FCF vs $414M CFO this quarter), yet negative revenue momentum and restructuring drag justify a clear value‑trap risk.
Recent price action shows a violent breakdown. After trading around $11.5–$12 early in the week, the stock gapped lower on guidance, hitting an intraday low near $9.26 and closing at $9.35 on heavy volume, confirming a decisive shift to a bearish trend. The failed attempt to hold $11.50–$12 has turned that band into key resistance. For trading, $9.00 is the first actionable level: sustained closes below it open downside toward mid‑$7s, while any oversold bounce is a short into the $10.50–$11.00 area.
More Breaking News
- SPCX Slides As Policy Shocks And New Rivals Hit SpaceX
- CareDx CDNA Rips Higher After Big Earnings Beat And Guidance Hike
- CMCSA Stock Grinds Higher As Restructuring Meets Earnings Beat
- BMNR Stock Holds Key Range As Traders Track Cash-Fueled Turnaround
Fundamentally, the stock’s 25–30% one‑day collapse reflects justified repricing after weak FY27 guidance (EPS $2.40–2.90 vs $3.18 consensus, revenues below Street, further organic decline and margin compression). Sector peers in Software & IT Services are growing low‑ to mid‑single digits with higher ROIC; DXC is shrinking with deteriorating bookings and AI/OASIS benefits pushed to FY29. I see continued derating risk, with fair value in an $8–$10 range near term; resistance sits at $11–$12, support $8 then $7.
Quick Financial Overview
The tape tells you how harsh the reset has been. DXC Technology Company traded near $12 earlier in the week, then broke hard after earnings and guidance, closing at $9.35 on 2026/05/08. The intraday 5‑minute candle shows a high around $10.28 and a flush down toward the mid‑$8s before a weak bounce, classic gap‑and‑bleed behavior when guidance shocks the market.
Under the hood, the business is shrinking. Trailing revenue sits near $12.87B with three‑ and five‑year revenue trends both negative, and Q4 FY26 showed slightly down sales and materially weaker organic growth. Management guided Q1 EPS and revenue below consensus, and FY27 targets also undercut current analyst numbers, signaling that the downtrend in fundamentals may persist rather than quickly mean‑revert.
Valuation has compressed hard, with a P/E around 4.1, price‑to‑sales near 0.13, and price‑to‑book roughly 0.51. Those numbers scream “cheap,” but the balance sheet carries total debt‑to‑equity of 1.37 and a quick ratio of 0.4, so this is not a low‑risk value play. Profitability is thin, with pre‑tax margin under 1% and GAAP results swinging to a loss in Q4 thanks to tax and non‑cash hits, even though free cash flow of about $266M in the latest quarter shows the company can still generate cash.
Conclusion
Trading DXC Technology Company here is about respecting both the violent repricing and the weak forward path. The stock has just repriced from roughly $12 to the high‑$8s on guidance that undercut expectations for Q1 and FY27, on top of a Q4 marked by softer organic growth, a GAAP loss, and deteriorating bookings. Valuation now looks optically low, but that discount reflects real execution risk, ongoing revenue contraction, and projected margin and free‑cash‑flow pressure.
For short‑term traders, DXC is now a broken momentum name with elevated intraday volatility and a wide range between the post‑gap high near $10 and the low‑$8 flush. Any bounce will likely be treated as a selling opportunity until the company proves it can stabilize revenue and margins, or until guidance stops stepping down. Longer‑dated AI and OASIS platform plans toward FY29 are too far out to drive near‑term bids.
The key for traders is to let the chart confirm whether this becomes a dead‑cat bounce setup, a base‑building pattern, or a continued trend‑down story. In an environment like this, you have to be especially selective about your entries and exits—chasing price without confirmation is how traders get trapped in fading bounces. As Tim Bohen, lead trainer with StocksToTrade says, “A good trade setup checks all the boxes—volume, trend, catalyst. Don’t trade if you’re missing pieces of the puzzle.”. As I tell my students, “Cheap stocks get cheaper when the story is deteriorating, so let price and volume show you when the heavy sellers are finally done.”
This is stock news, not investment advice. StocksToTrade News delivers real-time stock market updates tailored to highlight the key catalysts driving short-term price movements. Our coverage is designed for active traders and investors who thrive in fast-moving markets, with a focus on volatile sectors like penny stocks, AI stocks, Robinhood stocks and other momentum plays. From earnings reports and FDA approvals to mergers, new contracts, and unusual trading volume, we break down the events that can spark significant price action.
Looking to level up your trading game? Explore StocksToTrade, the ultimate platform for traders. With powerful tools designed for swing and day trading, integrated news scanning, and even social media monitoring, StocksToTrade keeps you one step ahead.
Check out our quick startup guide for new traders!
- How to Read Stock Charts: A Guide for Beginners
- Trading Plan: 6 Steps to Create One
- How To Create a Stock Watchlist
Ready to build your watchlists? Check out these curated lists:
Once your watchlist is set, take the next step and trade with confidence using StocksToTrade’s robust platform. Don’t miss out — grab your 14-day trial for just $7 and experience the edge you need to thrive in today’s fast-paced markets.