
Digital Brands Group Inc. stocks have been trading down by -10.01 percent following highly negative coverage of its financial stability.
What Traders Need To Know
- Price in Digital Brands Group Inc. spiked from the mid-$3s to above $6, showing explosive short-term momentum.
- Intraday action saw DBGI whip between $5s and low $7s, flagging high-day-trader interest and heavy volatility.
- Margins at Digital Brands Group Inc. remain deeply negative, signaling a high-risk turnaround story.
- Liquidity is tight, with low cash and high current liabilities, so DBGI must keep raising funds or improve cash flow.
- Traders should treat DBGI as a speculative momentum vehicle, not a stable swing name.
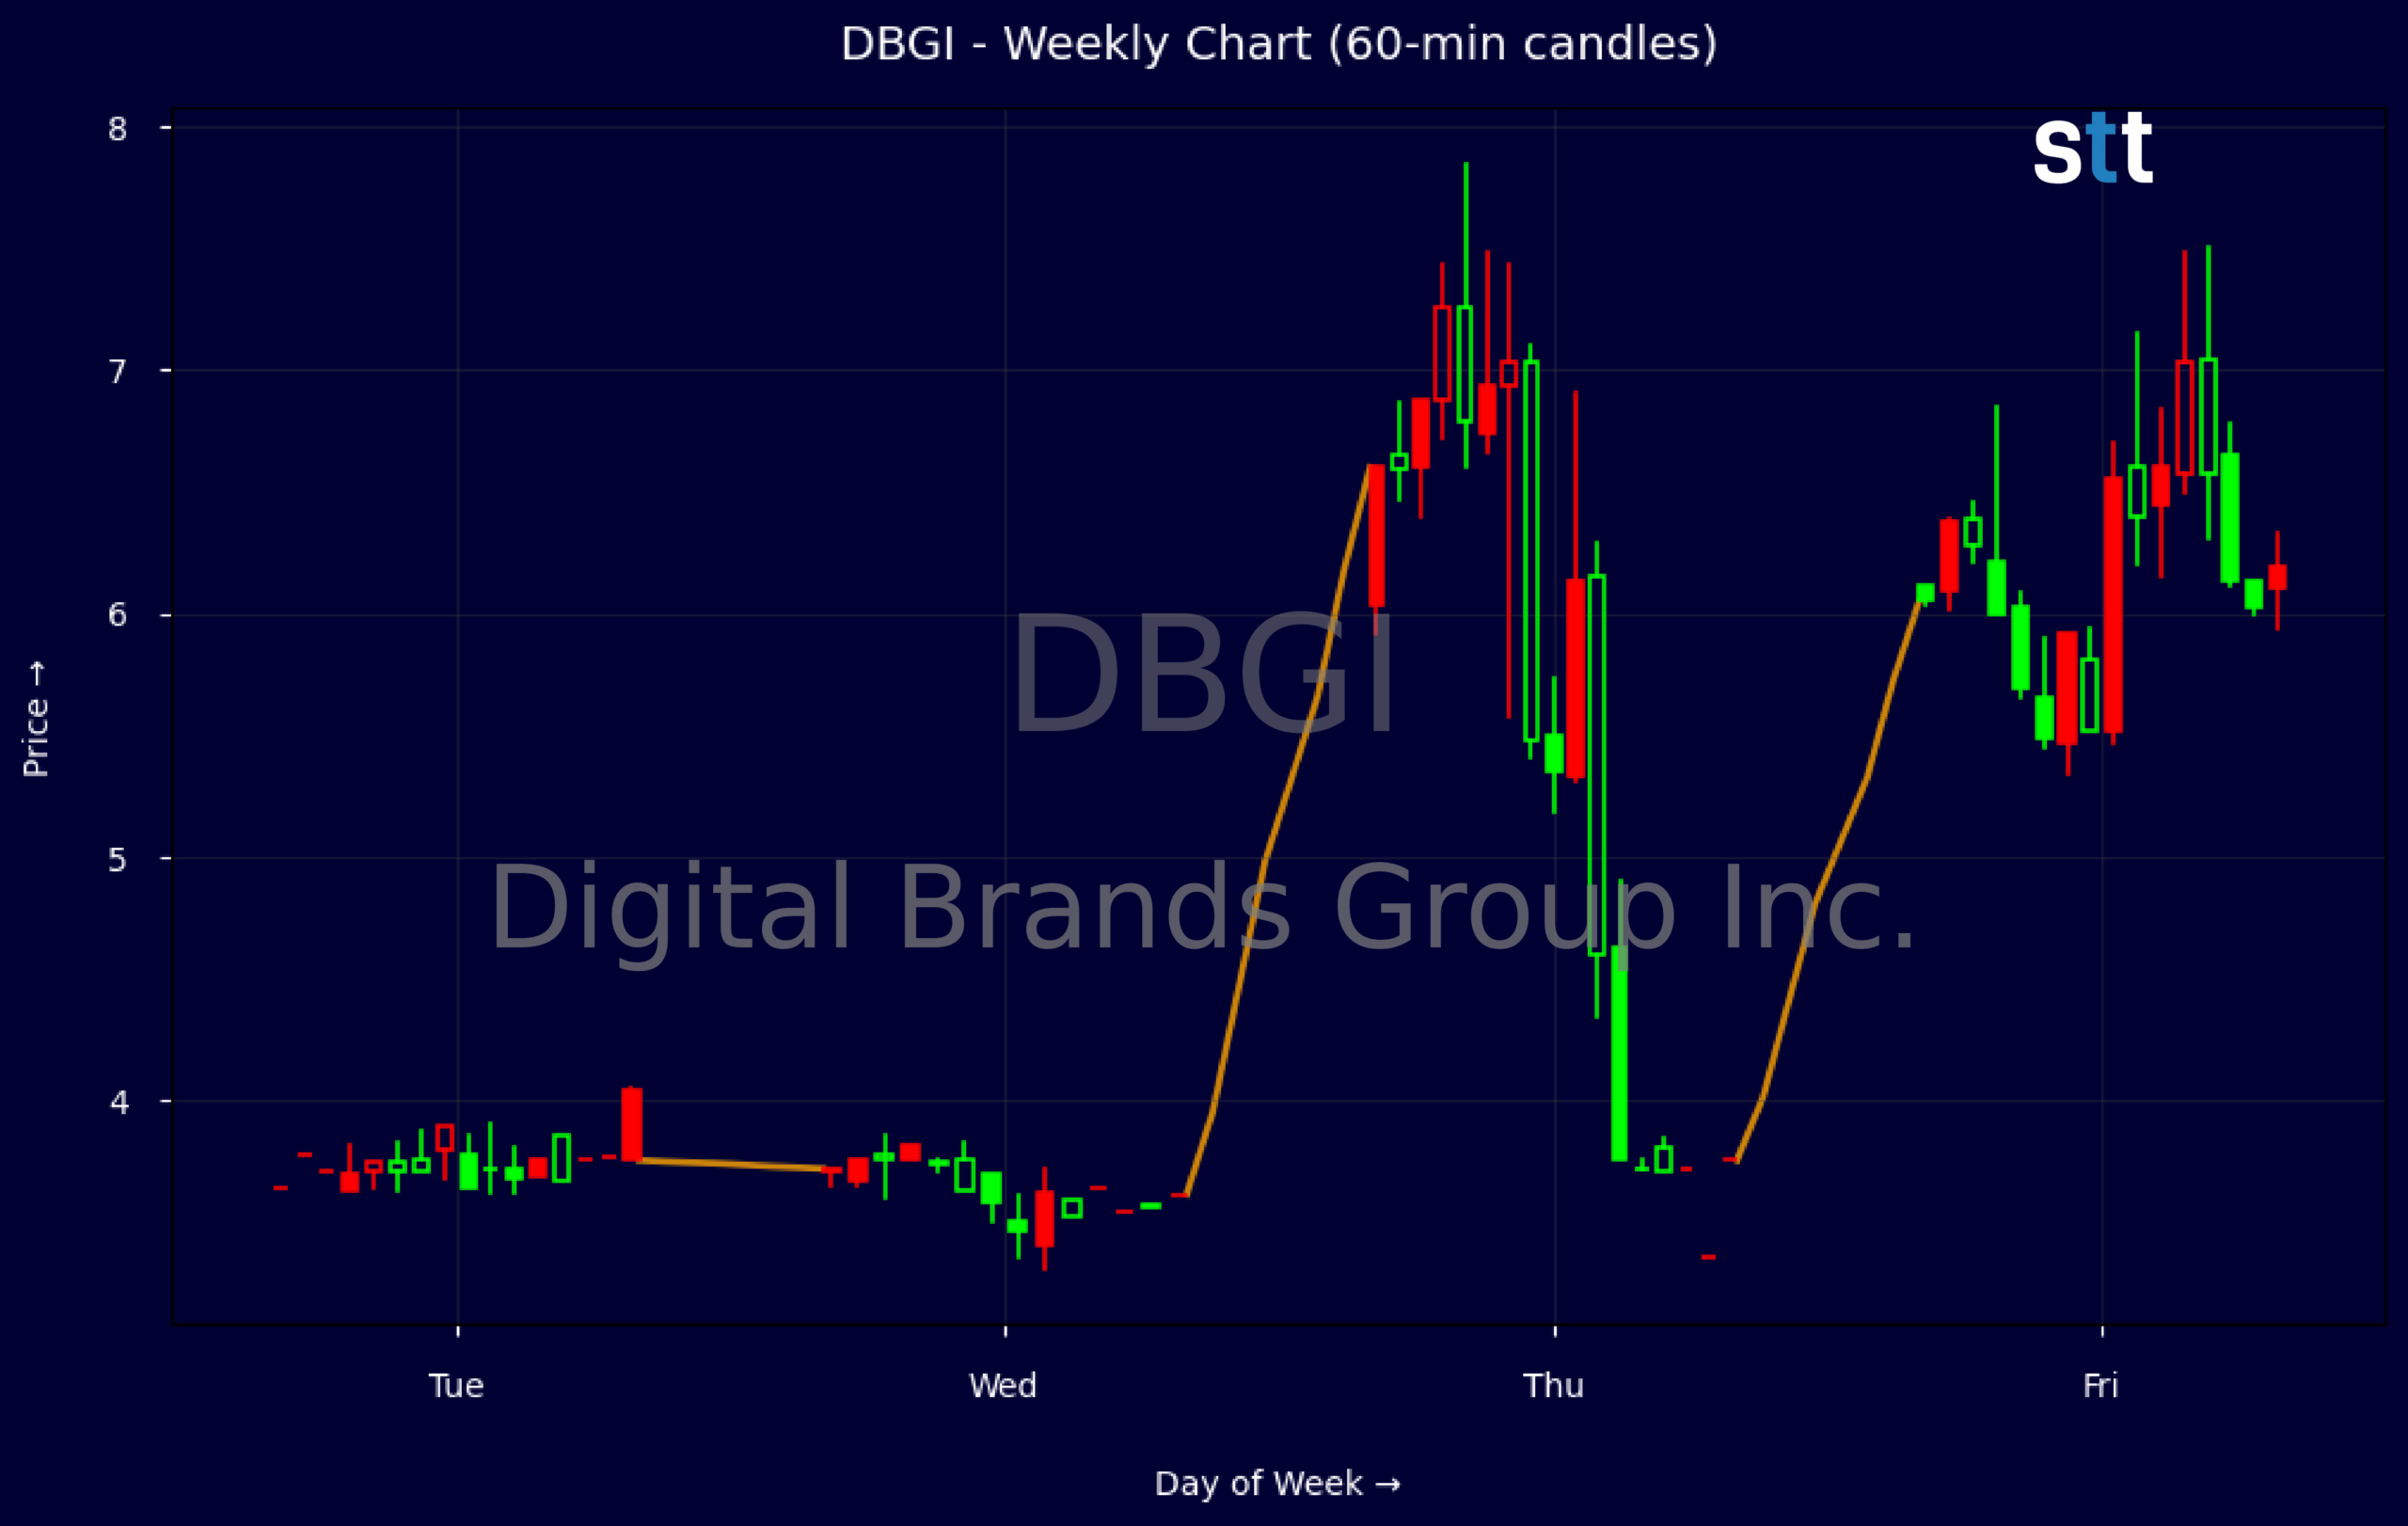
Weekly Update Sep 07 – Sep 11, 2026: On Saturday, September 12, 2026 Digital Brands Group Inc. stock [NASDAQ: DBGI] is trending down by -10.01%! Discover the key drivers behind this movement as well as our expert analysis in the detailed breakdown below.
Consumer Discretionary industry expert:
Analyst sentiment – negative
Digital Brands Group (DBGI) occupies a marginal, distressed position in discretionary retail, with only $7.4M in annual revenue and deeply negative profitability (EBIT margin roughly -730%, gross margin negative, ROE worse than -1,000%). The balance sheet is highly stressed: current ratio 0.6, quick ratio 0.1, leverage ratio 86x, and working capital of -$12.9M. Operations burn cash heavily (Q2 operating cash flow about -$5.6M; FCF about -$5.6M), funded by dilutive equity and incremental debt.
Technically, DBGI is in a high‑volatility, event‑driven microcap regime rather than a stable trend. The abrupt gap from $3.70 to $6.60 and intraday fade to $6.04–6.11 shows speculative spikes being sold into rather than accumulated. Intraday 5‑minute candles (with expanding range and likely volume surges near $6.50–6.60) point to short‑term exhaustion. The key actionable level is $6.60: below this, rallies are sells; only a decisive, high‑volume weekly close above it would signal durable upside.
More Breaking News
- FDXF Stock Climbs As Traders Focus On Debt, Momentum
- CMCSA Rises As Comcast Beats Earnings And Expands Broadband Footprint
- MPT Stock Slides As Traders Focus On Debt And Cash Flow
- SOFI Stock Slips As Analyst Warns Of $1B Headwind
With no meaningful fundamental catalysts disclosed in recent news, DBGI trades as a restructuring/speculation vehicle, not a quality Consumer Discretionary name. Versus sector and Retail‑Discretionary benchmarks, its margins, balance sheet, and cash burn are among the weakest. Base case: continued dilution, financing overhang, and operational pressure. Tactical resistance is $6.50–6.60; initial support sits near $3.60, with failure there opening sub‑$3.00 risk. Risk‑reward skews negative; this is an avoid or very short‑term trading only.
Quick Financial Overview
Digital Brands Group Inc. is showing sharp price swings on the chart, which often attract active traders. On the weekly data, DBGI moved from roughly $3.63–$3.81 and closed near $3.63, then pushed to a $3.75 open and $3.70 close, before exploding into the $6 area and holding above $6. That type of week-to-week jump, especially from around $3.70 to over $6, signals aggressive speculative interest and a potential squeeze dynamic.
The intraday 5-minute candle around the spike shows an open near $6.55, a run to about $7.15, and a flush into the low $5s before closing near $6. This wide intraday range confirms that DBGI is trading like a momentum small cap, not a slow fashion name. For short-term traders, that means big opportunity but also big slippage and stop-out risk.
On the fundamentals, Digital Brands Group Inc. remains heavily loss-making. Revenue in the most recent quarter was about $1.21M, with gross profit only around $0.32M, while total expenses were about $8.68M, driving net income near -$8.98M. Key ratios back this up: profit margins are deeply negative, return on equity is massively below zero, and free cash flow for the quarter was roughly -$5.56M. The balance sheet shows total assets near $46.67M but equity of only about $0.54M, with current liabilities far above current assets and a current ratio of 0.6. For traders, that profile means dilution and financing risk stay front and center.
Conclusion
This is stock news, not investment advice. StocksToTrade News delivers real-time stock market updates tailored to highlight the key catalysts driving short-term price movements. Our coverage is designed for active traders and investors who thrive in fast-moving markets, with a focus on volatile sectors like penny stocks, AI stocks, Robinhood stocks and other momentum plays. From earnings reports and FDA approvals to mergers, new contracts, and unusual trading volume, we break down the events that can spark significant price action.
Looking to level up your trading game? Explore StocksToTrade, the ultimate platform for traders. With powerful tools designed for swing and day trading, integrated news scanning, and even social media monitoring, StocksToTrade keeps you one step ahead.
Check out our quick startup guide for new traders!
- How to Read Stock Charts: A Guide for Beginners
- Trading Plan: 6 Steps to Create One
- How To Create a Stock Watchlist
Ready to build your watchlists? Check out these curated lists:
Once your watchlist is set, take the next step and trade with confidence using StocksToTrade’s robust platform. Don’t miss out — grab your 14-day trial for just $7 and experience the edge you need to thrive in today’s fast-paced markets.