

Digital Currency X Technology Inc. jumps on strong blockchain partnership news, as stocks have been trading up by 9.84 percent.
Key Takeaways For DCX Traders
- DCX has climbed from roughly $1.60 to above $2.00 over recent sessions, showing steady upward momentum with healthy intraday swings.
- Intraday trading in DCX shows a sharp early spike above $2.70, followed by a controlled fade and consolidation around $2.10.
- The latest balance sheet for Digital Currency X Technology Inc. shows heavy liabilities and negative equity, a classic high‑risk small-cap profile.
- Revenue of about $6.9M supports a rich price-to-sales multiple near 6.5, so DCX trading remains sentiment and momentum driven.
- Active traders are focusing on support near $1.90–$2.00 and resistance in the mid-$2.70s as key short-term decision zones.
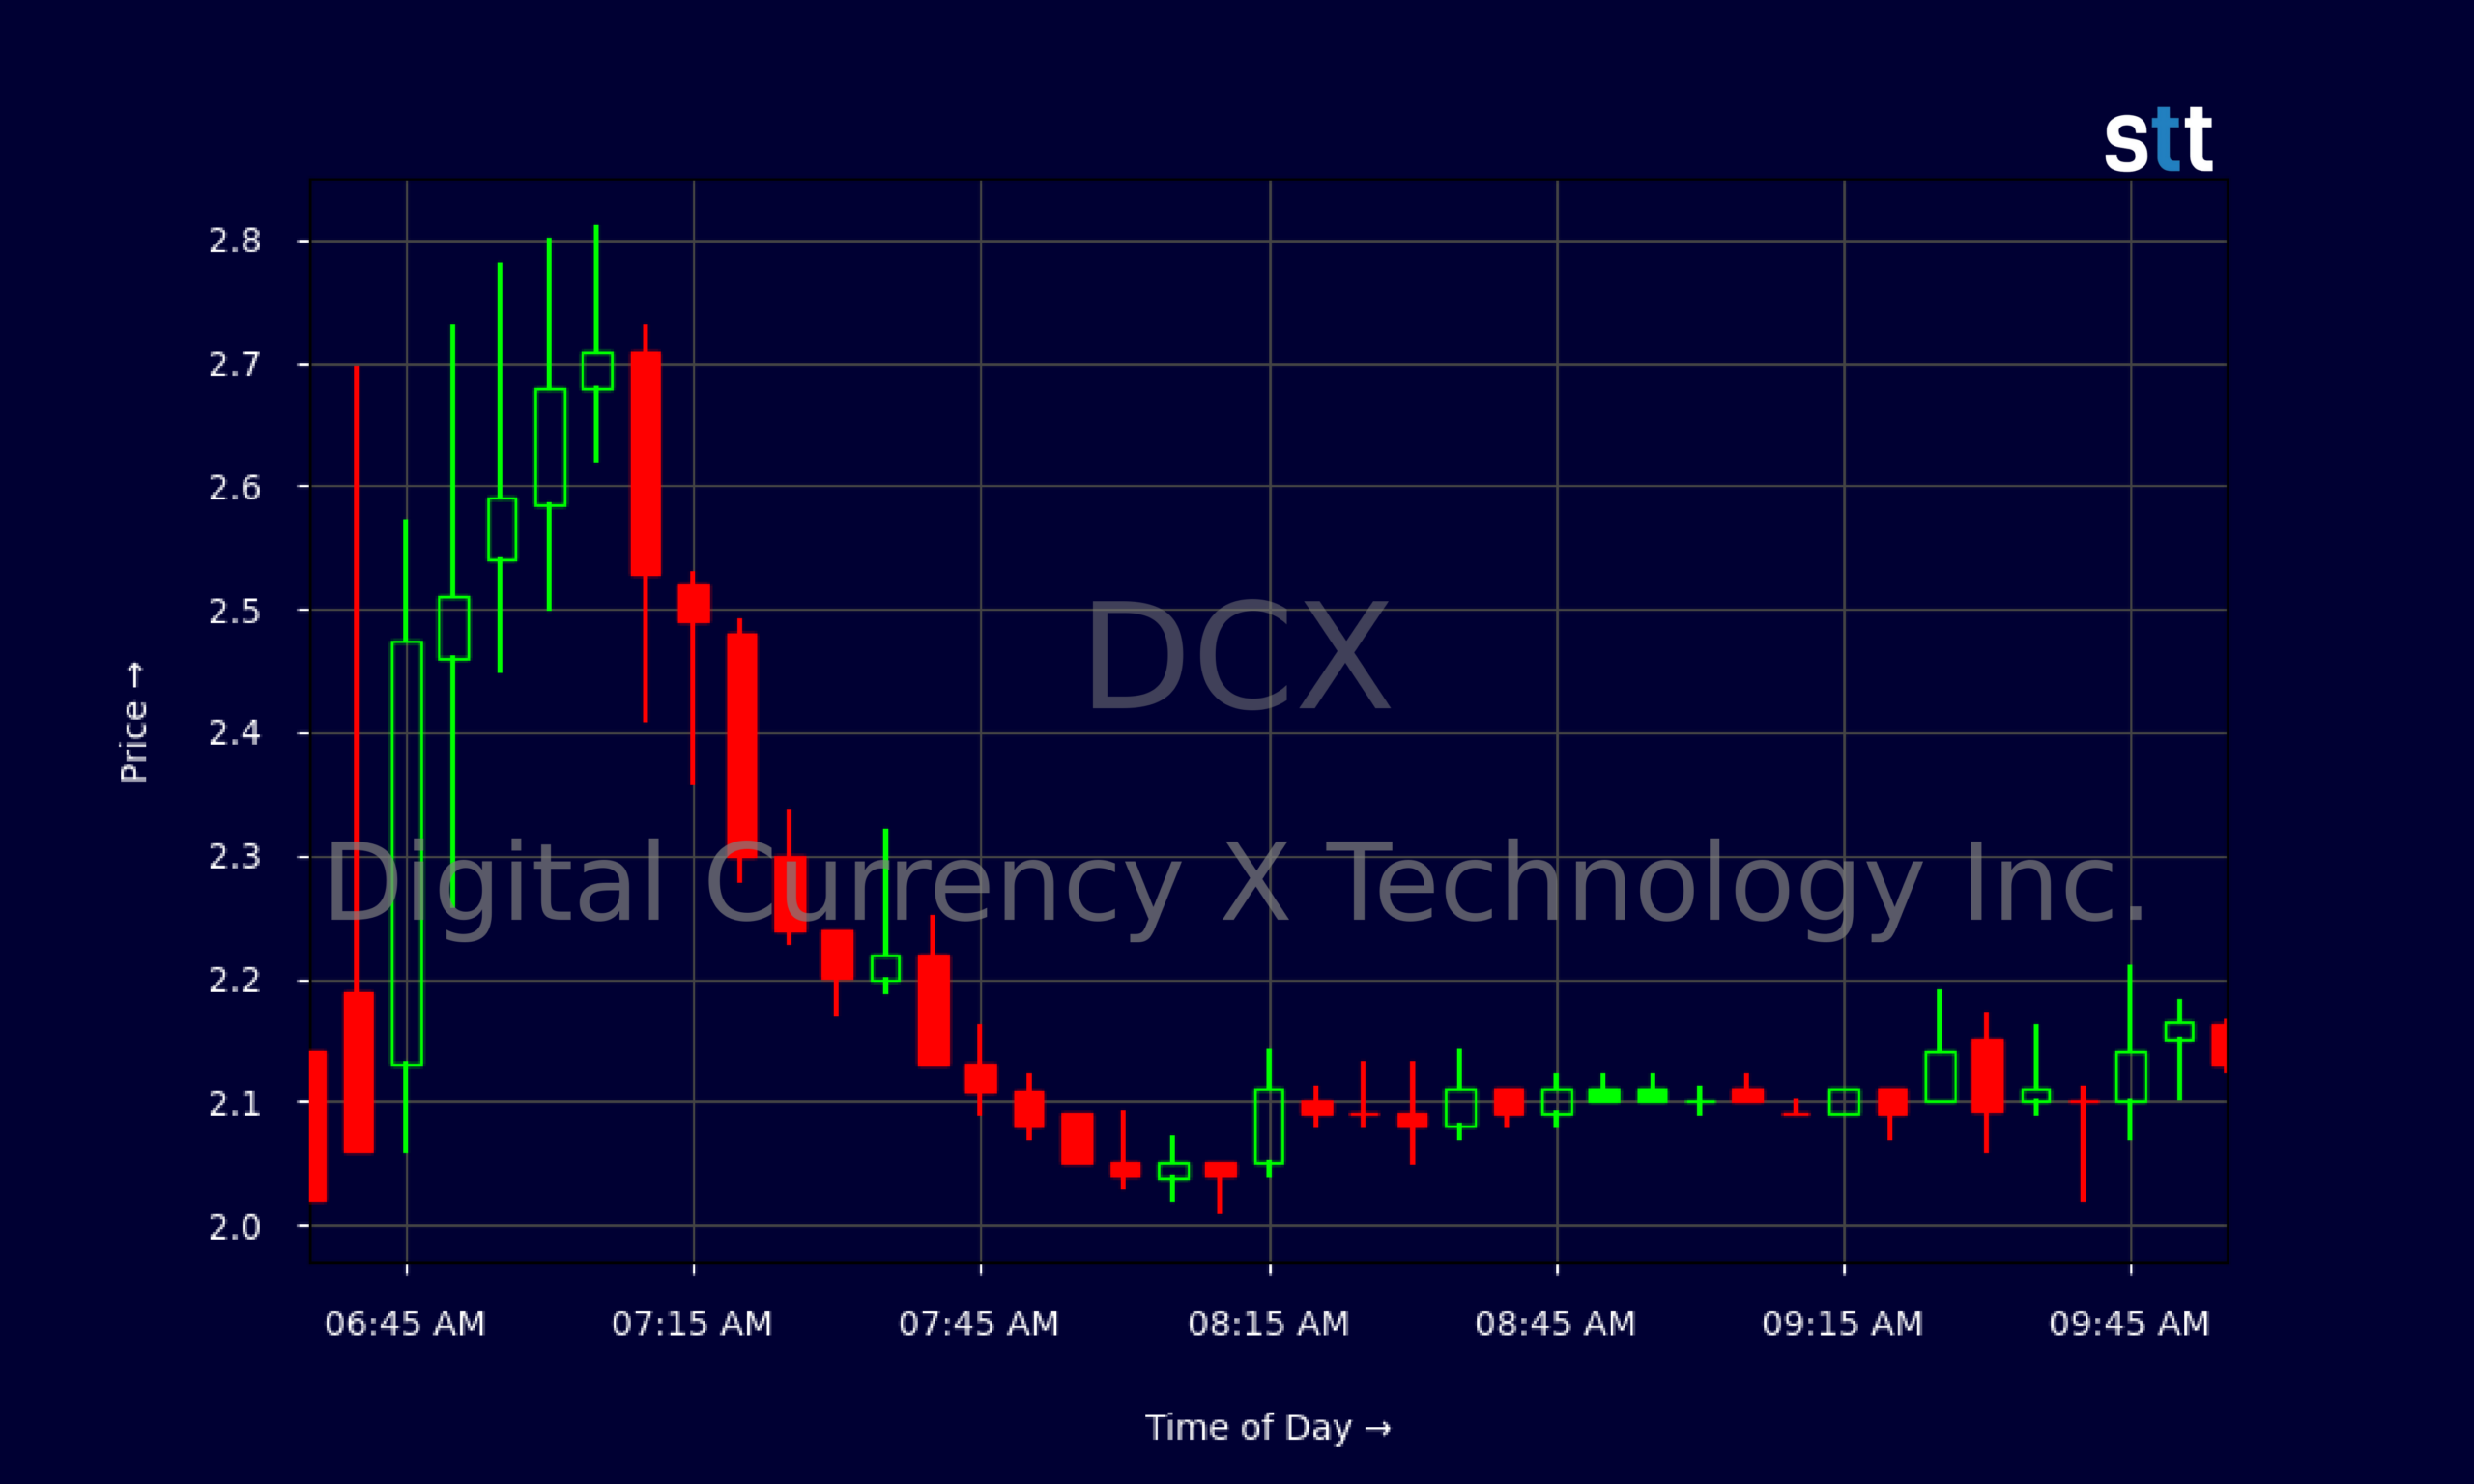
Live Update At 10:02:16 EDT: On Wednesday, April 22, 2026 Digital Currency X Technology Inc. stock [NASDAQ: DCX] is trending up by 9.84%! Discover the key drivers behind this movement as well as our expert analysis in the detailed breakdown below.
Quick Financial Overview
Digital Currency X Technology Inc. is a classic small-cap battleground name. DCX prints roughly $6.9M in revenue, yet the market values the company at about $137M enterprise value. That’s a price-to-sales ratio around 6.5, which is expensive for a company that is not showing strong profits.
The balance sheet is heavy. DCX lists total assets of about $470.8M, but total liabilities of roughly $616.3M and negative stockholders’ equity around -$179.3M. Working capital is deeply negative at roughly -$510.9M, meaning current liabilities tower over current assets. For traders, that screams financing and dilution risk down the road.
DCX also reports goodwill and other intangibles of more than $126M, plus a net PPE base of about $275M. Cash is thin around $3.7M relative to current liabilities over $573M. Digital Currency X Technology Inc. is not a balance-sheet fortress; it’s a leveraged, story-driven play.
More Breaking News
- FDXF Stock Climbs As Price Action Attracts Momentum Traders
- SNDG ETF Slides As Volatility Grips Short-Term Traders
- CDE Stock Pullback Has Active Metals Traders On Watch
- BMNR Stock Pulls Back As Traders Gauge Risk
For active DCX traders, the takeaway is simple: this is not a “safe” value name. It is a momentum vehicle where price action and liquidity matter more than classic fundamentals.
Why Traders Are Watching DCX Price Action
DCX has been building a clear trading range on the daily chart. Over the last few weeks, Digital Currency X Technology Inc. has pushed from closes near $1.60–$1.70 up into the low $2s, with several tests of the $2.10–$2.20 area. That slow grind higher tells traders there’s steady demand, even with all the balance sheet red flags.
The daily candles show repeated dips toward $1.86–$1.90 that get bought, then pushes toward $2.10–$2.20 that often fade. DCX is acting like a range-bound momentum name where short-term traders control the tape. Each bounce off that $1.90 area builds it into a more obvious support zone that many day traders will key off.
Zoom into the intraday 5‑minute chart, and you can see why DCX is on radar screens. Pre-market action spiked from roughly $2.13 to above $2.70, even tickling $2.80 before selling hit. That’s a huge percentage move in less than an hour. After the spike, DCX faded but did not collapse; the stock found its footing between $2.05 and $2.15 and chopped sideways.
For momentum traders, that pattern matters. Digital Currency X Technology Inc. proved it can run hard when volume comes in, then hold higher lows instead of fully retracing. DCX is the kind of name where a morning squeeze can turn into a full-day trend if shorts get trapped and liquidity stays strong.
Conclusion
Digital Currency X Technology Inc. is not a textbook fundamental story. DCX carries negative equity, heavy current liabilities, and only modest revenue relative to its valuation. That backdrop is exactly why the stock trades like a pure momentum vehicle. The chart, not the balance sheet, is what most active DCX traders are following day to day.
On the daily timeframe, DCX is respecting support around $1.90 and building resistance around $2.20–$2.25, with outlier spikes into the $2.70s. As long as Digital Currency X Technology Inc. continues to make higher lows above that $1.90 zone, short-term bulls will feel they have control. A clear break under that band with volume would flip the script fast.
For day traders, the intraday history shows DCX can move $0.30–$0.60 in minutes when volume pours in. That’s opportunity if you stay disciplined, and danger if you start hoping. As Tim Sykes loves to remind his students, “The market doesn’t care about your opinion, only your risk management.” In the same spirit, seasoned traders know they won’t catch every move in a volatile ticker like DCX; as Tim Bohen, lead trainer with StocksToTrade says, “Time and experience have taught me that missed opportunities are part of the game. There’s always another setup around the corner.” DCX is a textbook ticker to apply that mindset: trade the price action, respect the volatility, and cut losses quickly when the pattern breaks. This analysis is for educational and research purposes only, and every trader has to make their own decisions.
This is stock news, not investment advice. StocksToTrade News delivers real-time stock market updates tailored to highlight the key catalysts driving short-term price movements. Our coverage is designed for active traders and investors who thrive in fast-moving markets, with a focus on volatile sectors like penny stocks, AI stocks, Robinhood stocks and other momentum plays. From earnings reports and FDA approvals to mergers, new contracts, and unusual trading volume, we break down the events that can spark significant price action.
Looking to level up your trading game? Explore StocksToTrade, the ultimate platform for traders. With powerful tools designed for swing and day trading, integrated news scanning, and even social media monitoring, StocksToTrade keeps you one step ahead.
Check out our quick startup guide for new traders!
- How to Read Stock Charts: A Guide for Beginners
- Trading Plan: 6 Steps to Create One
- How To Create a Stock Watchlist
Ready to build your watchlists? Check out these curated lists:
Once your watchlist is set, take the next step and trade with confidence using StocksToTrade’s robust platform. Don’t miss out — grab your 14-day trial for just $7 and experience the edge you need to thrive in today’s fast-paced markets.