Diamondback Energy Inc. stocks have been trading up by 4.27 percent following bullish sentiment on strengthening oil prices.
Click Here for a Millionaire's POV on Trading FANG
SUBSCRIBE FOR ALERTSJOIN 50,000+ ACTIVE TRADERS
What Traders Need To Know
- Scotiabank initiated coverage on Diamondback Energy with an Outperform rating and a $250 price target, citing strong free cash flow yields and solid capital efficiency despite macro headwinds.
- Morgan Stanley raised its price target on Diamondback Energy to $222 and highlighted that traders will focus on preliminary 2027 plans during Q3, with oil back near $100 per barrel.
- BMO Capital lifted its target to $224 with an Outperform rating, while the broader analyst consensus is overweight with a mean price target around the mid-$230s.
- JPMorgan increased its target to $253, reinforcing a Street average target in the high-$230s and signaling confidence in Diamondback Energy’s medium-term cash generation.
- The company reported strong Q3 realized commodity prices but also sizable hedging losses, which may partly mask the strength of its underlying operations.
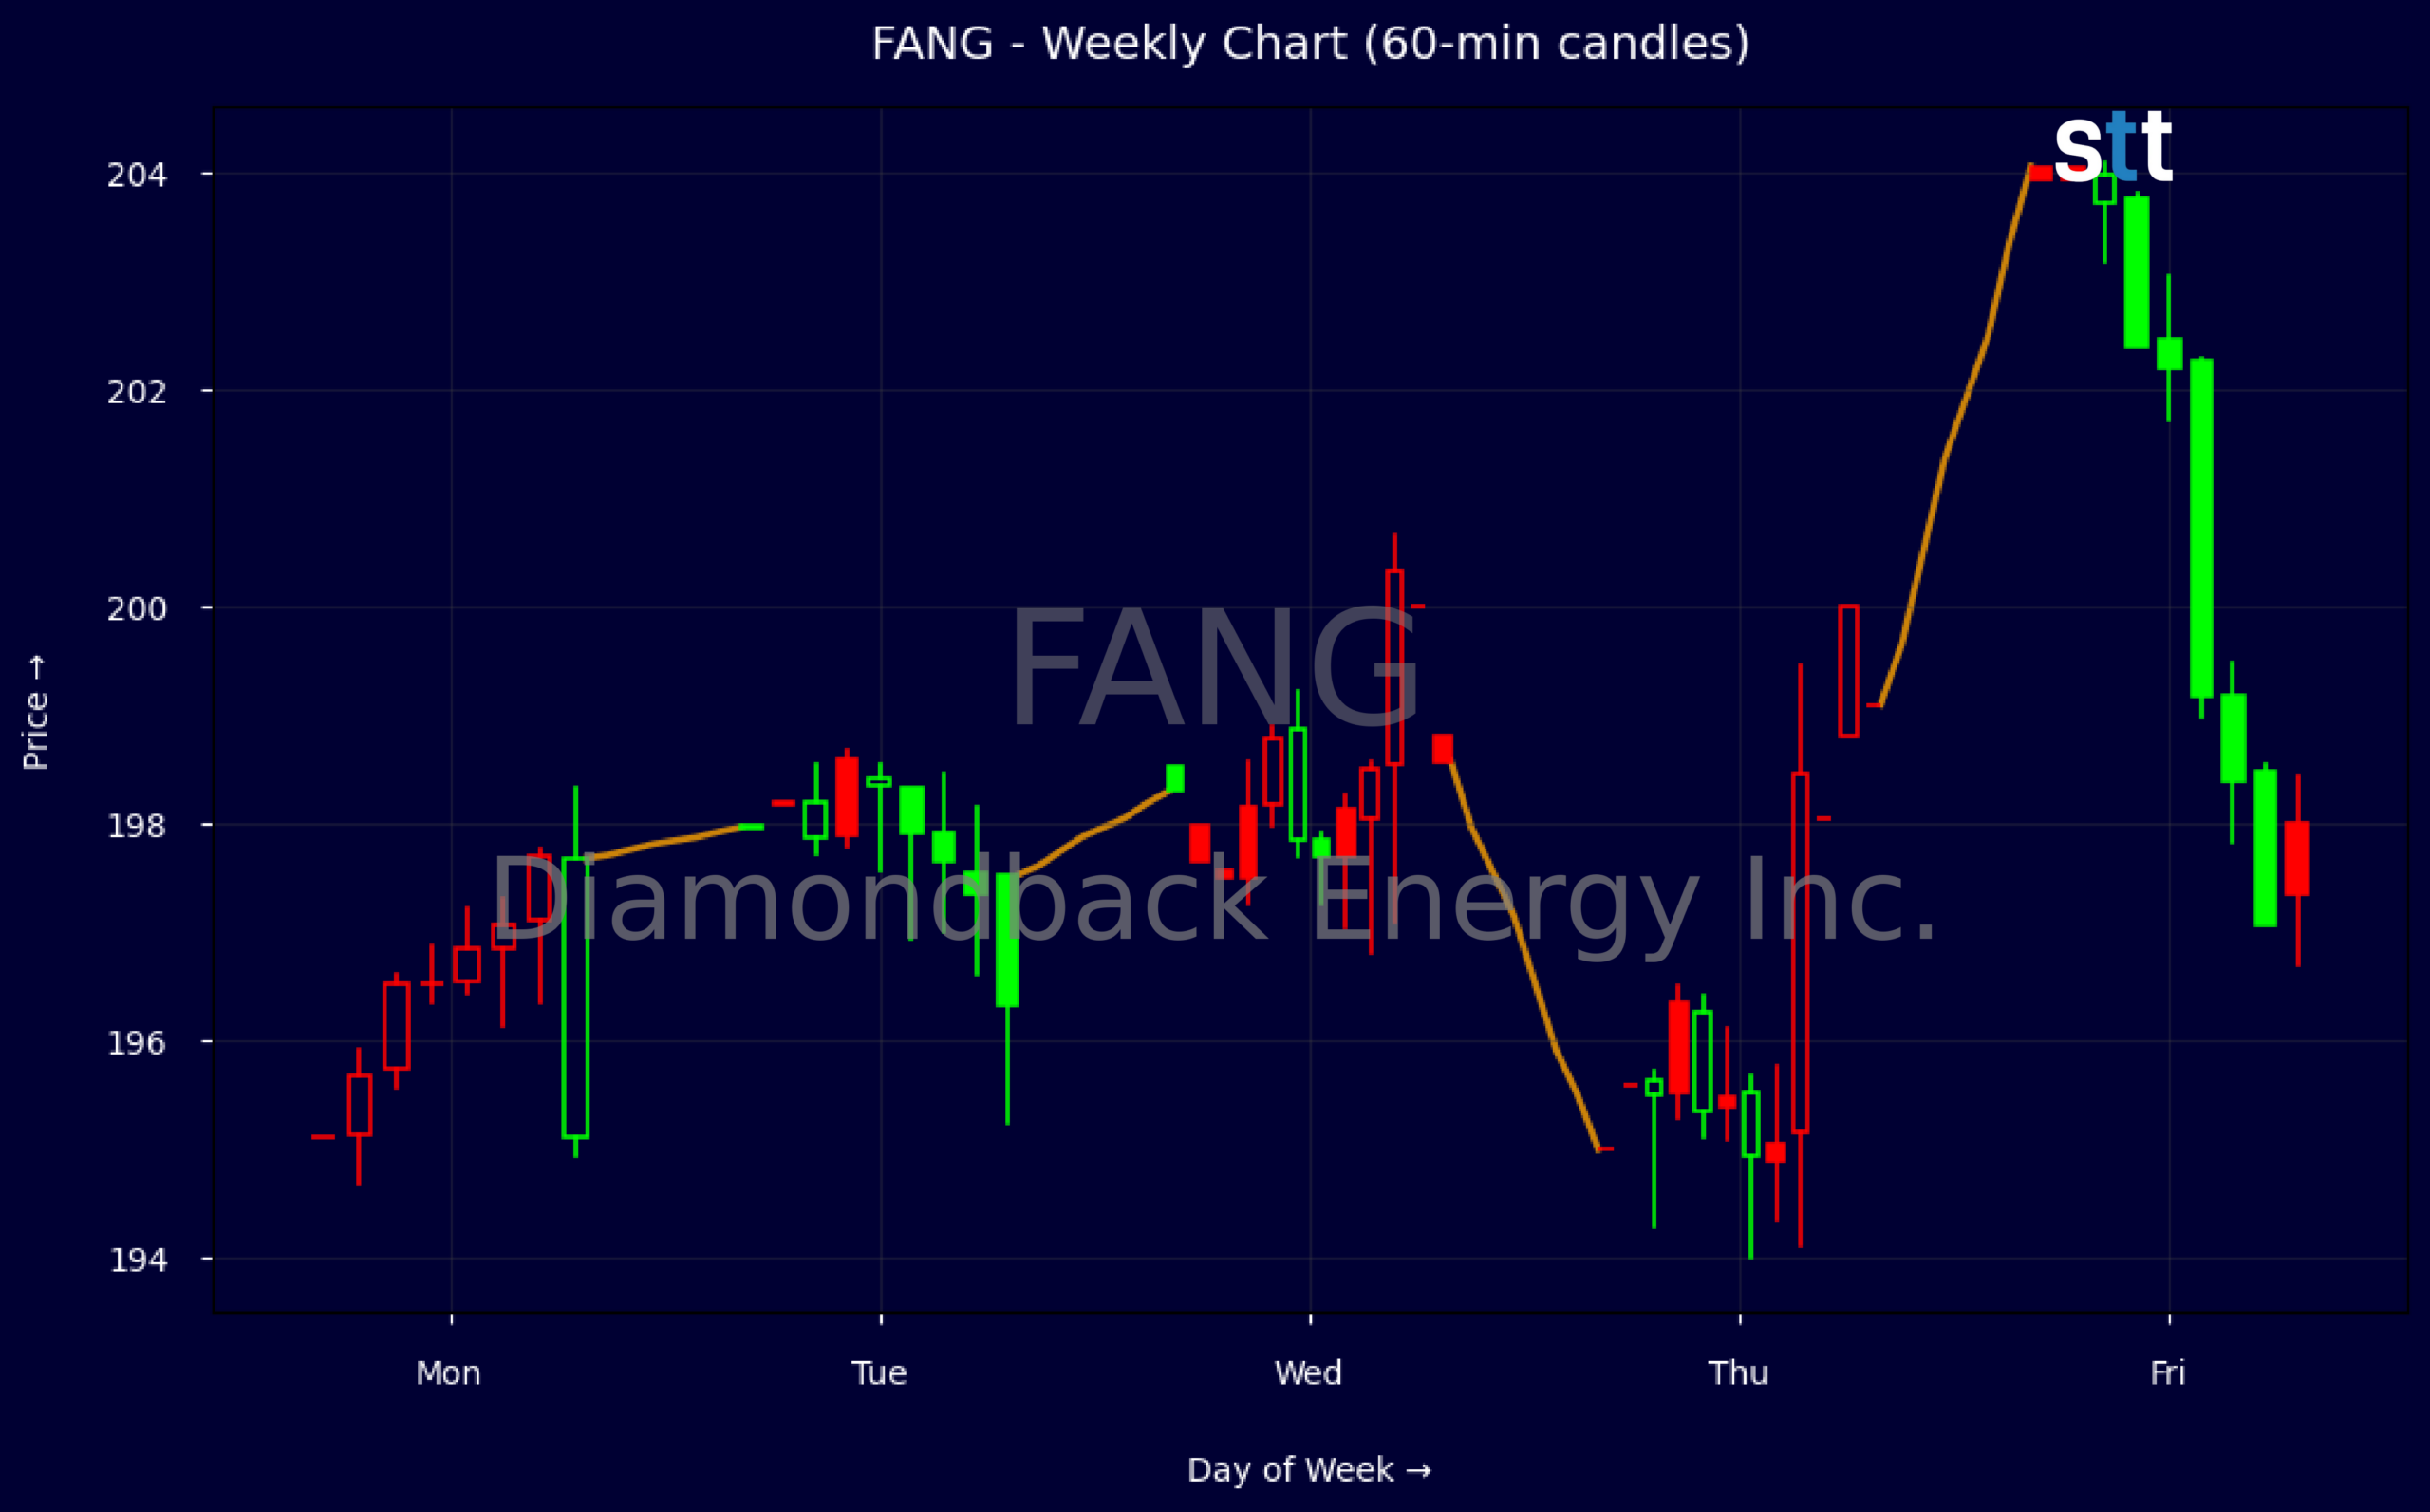
Weekly Update Oct 12 – Oct 16, 2026: On Friday, October 16, 2026 Diamondback Energy Inc. stock [NASDAQ: FANG] is trending up by 4.27%! Discover the key drivers behind this movement as well as our expert analysis in the detailed breakdown below.
Energy industry expert:
Analyst sentiment – positive
Diamondback Energy sits in the top tier of Permian E&Ps with scale, cost leadership, and disciplined capital allocation. EBITDA margin above 40% and pretax margin near 37% confirm strong upstream economics, while ROE around 13% and low leverage (total debt-to-equity 0.33x, interest coverage ~26x) underscore balance sheet strength. Free cash flow of roughly $2.2 billion versus an enterprise value of ~$67 billion implies an attractive FCF yield. A 2.2% dividend plus buybacks keeps total yield competitive versus large-cap Energy peers.
Technically, FANG is in a firmly bullish weekly trend, with closes stepping from ~$195 to ~$204 and buyers defending dips near $195. Intraday 5-minute candles show consistent buying on modest pullbacks with rising volume into strength, not weakness, suggesting accumulation rather than distribution. The key actionable level is $195: above it, long bias remains justified, while a decisive close below would signal waning momentum. Upside, a break and hold over $205 opens room toward the high-$210s.
More Breaking News
- WULF Stock Pullback Has Active Traders Watching Key Levels
- TCRT Stock Explodes As Velaris Deal And $350M Cash Shock Wall Street
- TRGP Jumps As Targa Resources Price Targets Surge Before Q3
- SOFI Stock Slips As Analyst Cut And Insider Sale Hit Sentiment
Catalysts are skewed favorably: multiple brokers have recently raised price targets into the $215–$253 range, with consensus around $235–$238 and overweight ratings, citing strong FCF yields and capital efficiency despite hedge losses. Relative to Energy and Fossil Fuels benchmarks, FANG offers superior balance sheet quality and cash returns with moderate valuation (P/CF ~3.8x). I see upside toward $225–$235 over 12 months, with support near $190 and strong resistance only above $230.
Quick Financial Overview
Diamondback Energy Inc. (FANG) is trading just above $200, with the latest weekly close near $203.95 after pushing from roughly $195 earlier in the week. That steady grind higher, not a wild spike, tells traders this is controlled accumulation, not a short-lived squeeze. Intraday, the tape shows a tight range around $200–$204 with shallow dips being bought, which signals firm demand and limited profit-taking into the close.
On the fundamental side, FANG posted quarterly revenue of about $5.53B, with gross margin near 37.1% and EBITDA margin around 43.5%. Profitability is solid: pretax margin is roughly 37%, and recent net income from continuing operations was about $2.06B. The balance sheet carries total assets near $70.2B and long-term debt around $11.1B, with total debt to equity near 0.33 and interest coverage above 25 times, which gives the company room to manage cycles.
Valuation-wise, the stock trades at a price-to-sales near 3.16 and price-to-free-cash around 6.1, which aligns with Scotiabank’s argument about strong free cash flow yields and attractive multiples. The current dividend yield is around 2.25% on a dividend rate of $4.40 per share, backed by free cash flow of about $2.16B in the latest quarter. Analysts are broadly overweight, with mean targets in the mid-to-high $230s versus the stock near $200, implying a sizable perceived upside band if execution on capital plans and volumes continues.
Conclusion
Diamondback Energy Inc. sits at an interesting spot for active traders: price near $200, while large banks cluster targets between roughly $215 and $253. The recent weekly structure shows higher lows and a push from the mid-$190s toward the low-$200s, with intraday action confirming steady buying around $200. That area now acts as a key short-term pivot; repeated bounces there suggest dip buyers are in control as long as oil holds up.
On the fundamental tape, FANG is throwing off strong operating cash flow and over $2B in free cash flow this quarter, even after capital spending. Margins are robust, but hedging losses have been a drag, which explains why the stock has not fully matched the tone of analyst upgrades yet. For traders, that gap between solid financials and more cautious price action is where opportunity and risk both live. It also reinforces a momentum-focused approach: as Tim Bohen, lead trainer with StocksToTrade says, “I focus on momentum that’s visible right now. Speculation on future moves is outside my playbook.”
Wall Street’s overweight stance and targets well above spot price outline the upside map, while questions around strategy, hedging, and longer-term 2027 plans define the main headline risks. For short-term setups, watching how price behaves into Q3 updates and any commentary on future capital returns is key. As I tell my students, “The edge comes from lining up strong charts with strong cash flows, then letting the market show you when big money is actually stepping in.” This article is for educational and research purposes only.
This is stock news, not investment advice. StocksToTrade News delivers real-time stock market updates tailored to highlight the key catalysts driving short-term price movements. Our coverage is designed for active traders and investors who thrive in fast-moving markets, with a focus on volatile sectors like penny stocks, AI stocks, Robinhood stocks and other momentum plays. From earnings reports and FDA approvals to mergers, new contracts, and unusual trading volume, we break down the events that can spark significant price action.
Looking to level up your trading game? Explore StocksToTrade, the ultimate platform for traders. With powerful tools designed for swing and day trading, integrated news scanning, and even social media monitoring, StocksToTrade keeps you one step ahead.
Check out our quick startup guide for new traders!
- How to Read Stock Charts: A Guide for Beginners
- Trading Plan: 6 Steps to Create One
- How To Create a Stock Watchlist
Ready to build your watchlists? Check out these curated lists:
Once your watchlist is set, take the next step and trade with confidence using StocksToTrade’s robust platform. Don’t miss out — grab your 14-day trial for just $7 and experience the edge you need to thrive in today’s fast-paced markets.