

Following breakthrough AI cybersecurity contract headlines, DarkIris Inc. stocks have been trading up by 47.33 percent on surging optimism.
Key Takeaways
- DKI has exploded from sub-$0.10 levels to the $1.50 area in weeks, signaling an extreme momentum move that active traders track closely.
- Recent intraday trading in DarkIris Inc. shows sharp spikes above $2.70 followed by fast pullbacks, a classic pattern for day traders who thrive on volatility.
- With roughly $1.8M in cash and total liabilities of about $1.66M, DKI’s balance sheet gives the company some operational runway but not a wide margin for error.
- DarkIris Inc. trades at roughly 0.07 times sales and 0.11 times book value, suggesting a deep-discount valuation that momentum traders often pair with chart setups.
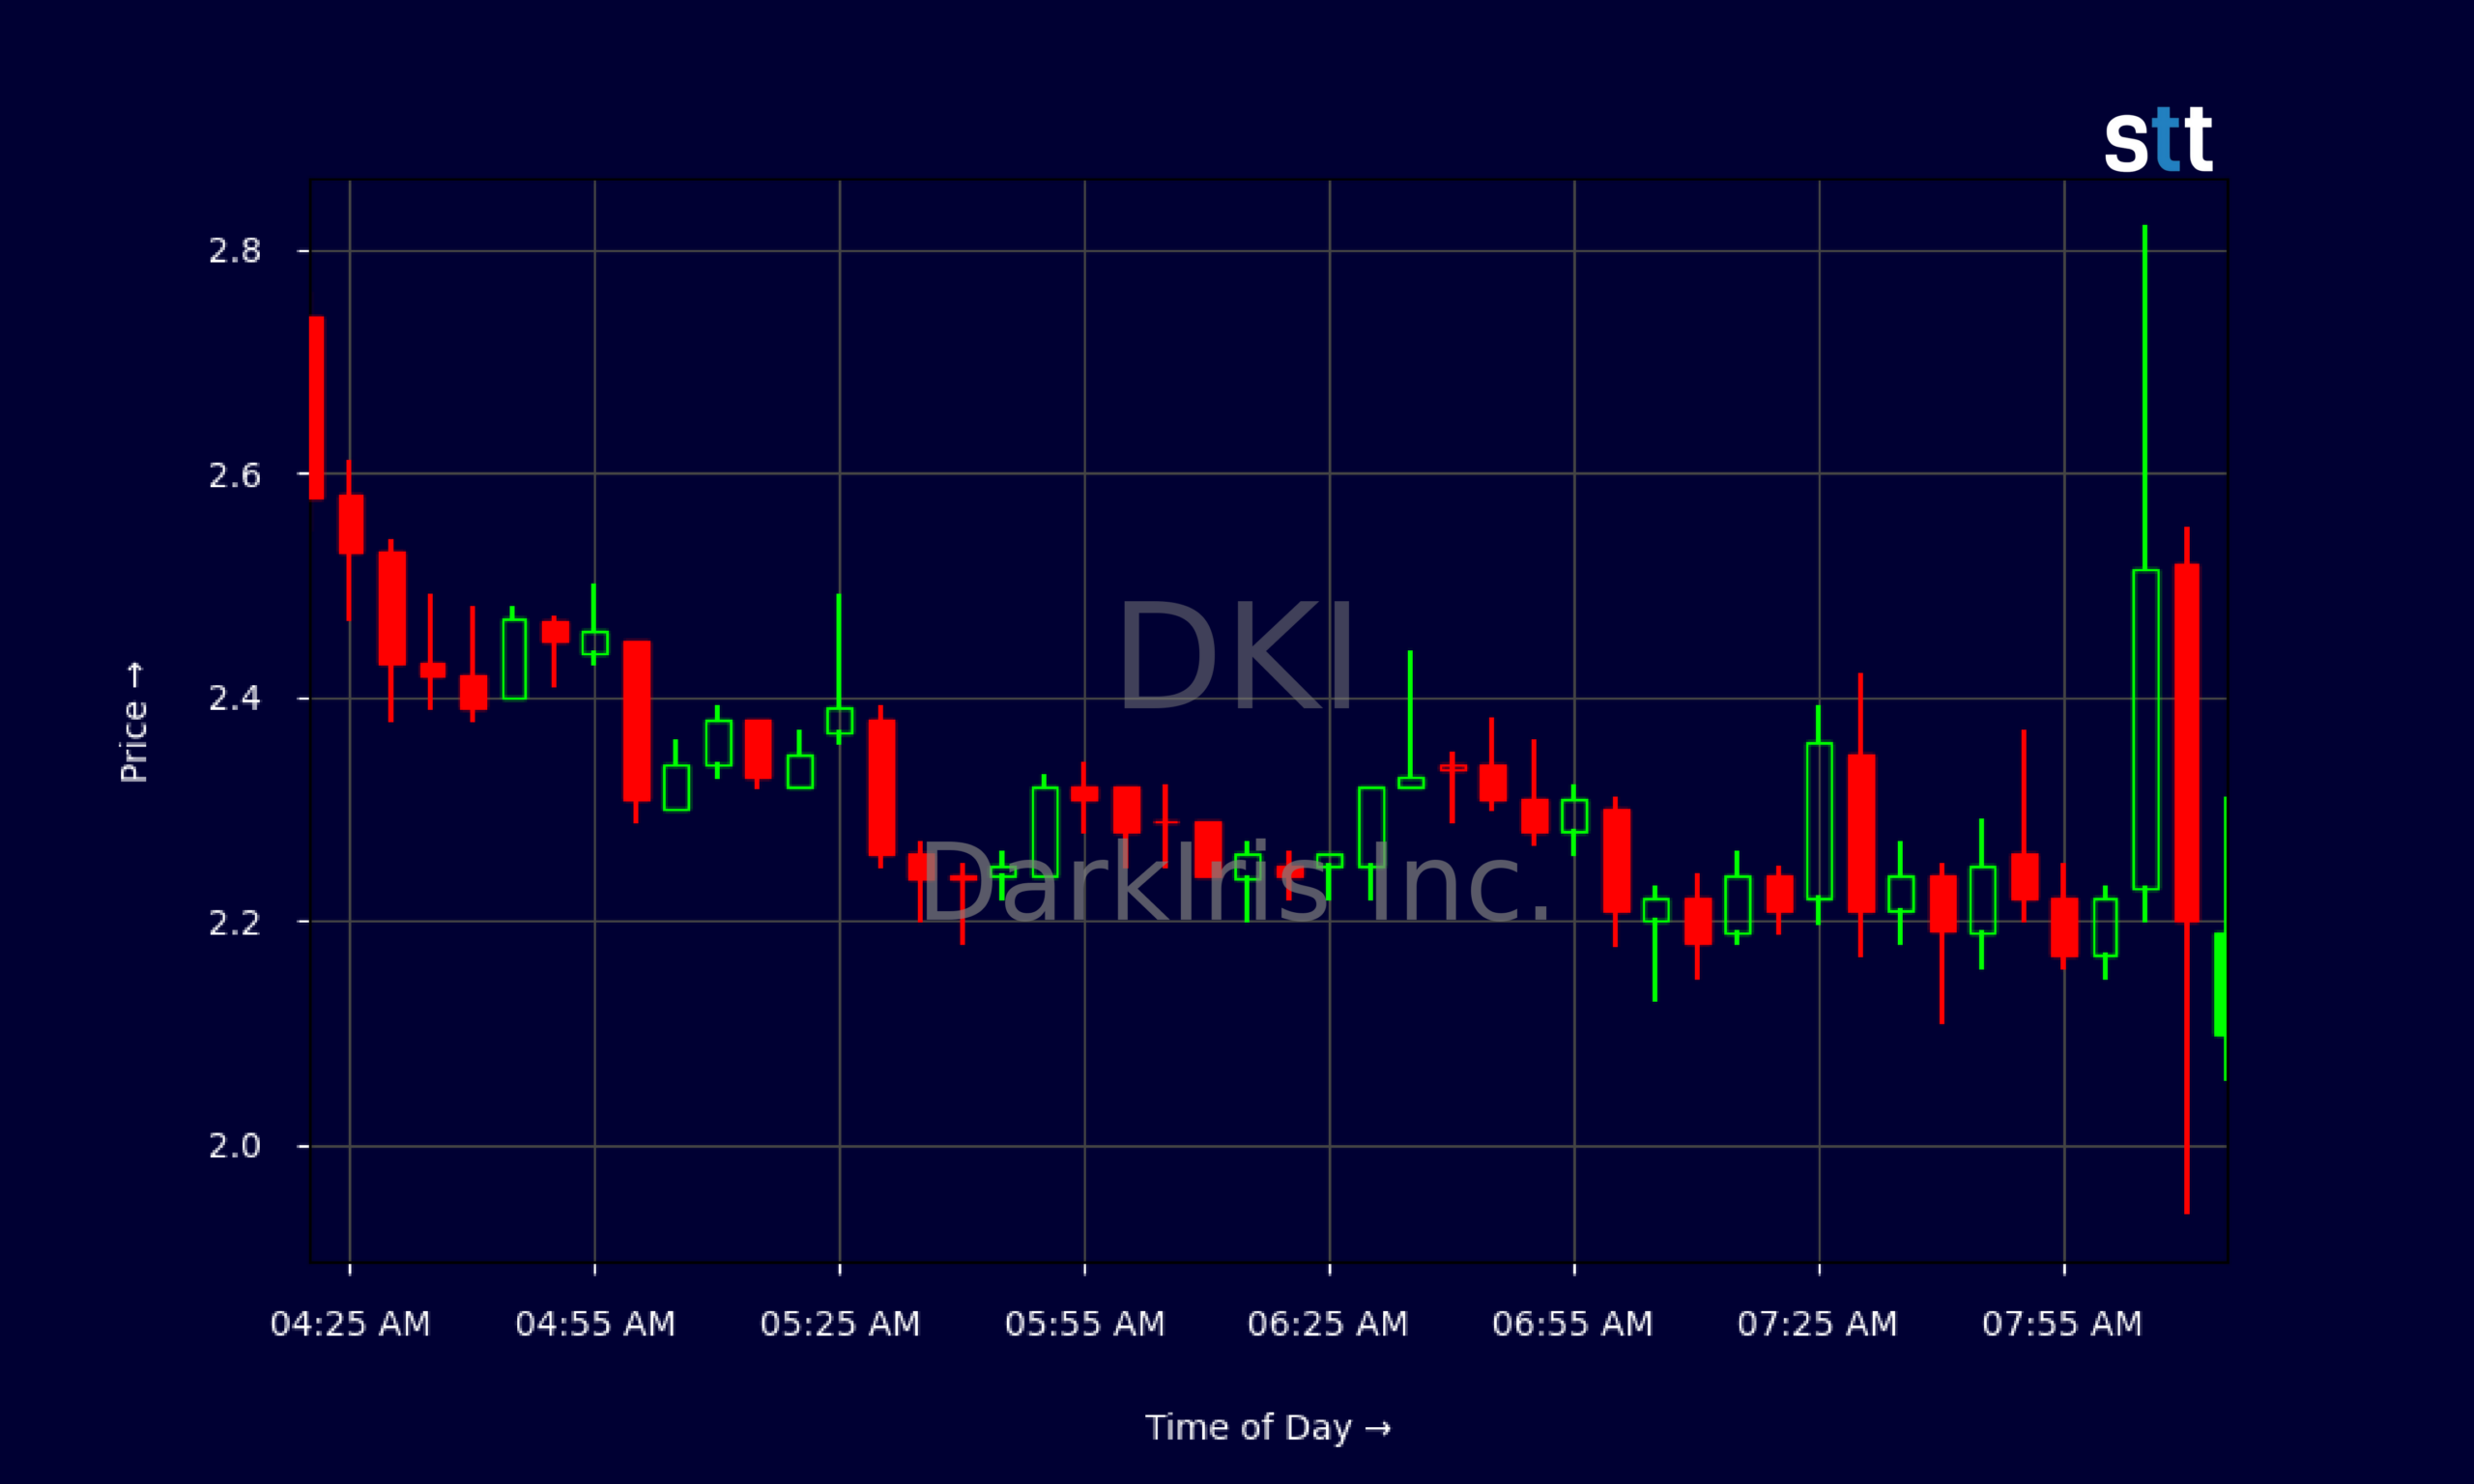
Live Update At 08:19:13 EST: On Wednesday, November 04, 2026 DarkIris Inc. stock [NASDAQ: DKI] is trending up by 47.33%! Discover the key drivers behind this movement as well as our expert analysis in the detailed breakdown below.
Quick Financial Overview
DKI is a tiny name, but the numbers behind DarkIris Inc. matter if you are trading the chart. The company reported about $10.08M in revenue, which is a modest top line, yet the market is pricing DKI at only about 0.07 times those sales. That is bargain-bin territory by traditional standards, and traders know those discounts can fuel sharp re-ratings when volume rushes in.
On the balance sheet, DarkIris Inc. shows roughly $8.45M in total assets and $1.66M in total liabilities, leaving stockholders’ equity near $6.78M. Cash stands around $1.80M, with accounts receivable of about $2.62M, giving DKI workable liquidity for a micro-cap. Working capital of roughly $3.09M means the company is not pinned against the wall right now.
More Breaking News
- STLA Stock Jumps As Earnings Beat Fuels Bullish Momentum
- BBD Stock Jumps As Analyst Upgrades And Buyback Fuel Momentum
- EOSE Stock Under Pressure As Legal Probes Mount
- FTCI Stock Pops As Credit Relief Meets Solar Tech Tailwind
At the same time, return on capital is deeply negative at around -223.95%, flagging serious profitability challenges. DKI’s book value per share sits near $3.23, while the stock trades far below that, another sign of deep-discount pricing. For traders, DarkIris Inc. looks less like a steady compounder and more like a classic speculative vehicle: weak fundamentals, cheap metrics, and a chart that moves fast.
Why Traders Are Watching DKI Price Action
The real story around DKI is on the tape. Two weeks ago, DarkIris Inc. was trading around $0.14–$0.18. It then ripped into the $0.60–$0.09 range, and shortly after that, DKI suddenly printed the $2.00+ zone. That is a massive percentage move in a very short window. When a stock jumps like this, momentum traders sit up and pay attention.
Look at the daily candles. DKI ran from a close of $0.1433 to $0.85+, then into the $2.00+ area. The wild gap between $0.0399 and $2.00 the next day shows how structurally fragile pricing can be in micro-caps. From there, DarkIris Inc. churned between roughly $1.80 and $2.30 before slipping back to the mid-$1.40s and $1.50s. That pattern tells traders the first wave of euphoria has cooled, but the name is still volatile.
Intraday, the 5‑minute chart shows DKI trading between roughly $2.10 and $2.80 with repeated spikes above $2.70, then quick fades back toward the low $2.00s. DarkIris Inc. is essentially a day trader’s classroom: big ranges, blow-off candles, and sharp reversals. Liquidity looks concentrated in those momentum bursts, so experienced traders will stalk DKI for clean breakouts over intraday highs and tight risk around clear levels.
Right now, DarkIris Inc. sits in a consolidation band after the first huge spike. DKI is in that “prove it” phase where either a second leg higher forms or the stock bleeds back toward its earlier base. For short-term trading, that tension is exactly what keeps this ticker on watchlists.
Conclusion
DKI is a textbook example of a low-priced stock turning into a momentum playground. On paper, DarkIris Inc. carries modest revenue, a thin but workable cash position, and deep-discount valuation ratios that value traders might argue are too low. But the trading community is not here for slow re-ratings. They are here because DKI just delivered a multi-hundred-percent move in days.
The combination of extremely negative return on capital and a sub-0.1 price-to-sales multiple tells you DarkIris Inc. is not a polished blue chip. It is a speculative story where sentiment and volume can overpower fundamentals in the short term. That is exactly why disciplined traders lean on risk management. They watch key levels around recent highs near the $2.70–$2.80 zone and the support band in the mid-$1.40s to $1.50s, and they size positions so a failed breakout is just a paper cut, not a career-ender.
DKI will likely remain on radar for active traders as long as the intraday range stays wide and the volume stays elevated. As Tim Bohen, lead trainer with StocksToTrade says, “There’s a pattern in everything; you just have to stick around long enough to see it.” That mindset resonates strongly in a ticker like DKI, where pattern recognition, patience, and strict rules matter more than opinions about long-term value. As Tim Sykes loves to remind his students, “The market doesn’t care about your opinion, only your discipline. Cut losses quickly, protect your account, and live to trade another setup.” DarkIris Inc. is precisely the kind of volatile chart where that rule separates serious traders from gamblers.
This is stock news, not investment advice. StocksToTrade News delivers real-time stock market updates tailored to highlight the key catalysts driving short-term price movements. Our coverage is designed for active traders and investors who thrive in fast-moving markets, with a focus on volatile sectors like penny stocks, AI stocks, Robinhood stocks and other momentum plays. From earnings reports and FDA approvals to mergers, new contracts, and unusual trading volume, we break down the events that can spark significant price action.
Looking to level up your trading game? Explore StocksToTrade, the ultimate platform for traders. With powerful tools designed for swing and day trading, integrated news scanning, and even social media monitoring, StocksToTrade keeps you one step ahead.
Check out our quick startup guide for new traders!
- How to Read Stock Charts: A Guide for Beginners
- Trading Plan: 6 Steps to Create One
- How To Create a Stock Watchlist
Ready to build your watchlists? Check out these curated lists:
Once your watchlist is set, take the next step and trade with confidence using StocksToTrade’s robust platform. Don’t miss out — grab your 14-day trial for just $7 and experience the edge you need to thrive in today’s fast-paced markets.