
DarkIris Inc. stocks have been trading up by 53.95 percent after unveiling a breakthrough AI security platform partnership.
Key Takeaways
- DKI has dropped from the mid-$5s to the mid-$3s on the daily chart, signaling a sharp pullback after prior strength.
- Intraday, DarkIris Inc. swung between roughly $4.70 and $10.30, showing extreme volatility and wide trading ranges.
- The latest balance sheet shows DKI holding about $1.8M in cash and positive equity, giving the company room to operate.
- With a price-to-sales ratio near 0.76 and price near book value, traders are treating DKI as a value-plus-momentum setup.
- Charts show clear support forming in the high-$3s, while premarket spikes above $9 show where short-term momentum can explode.
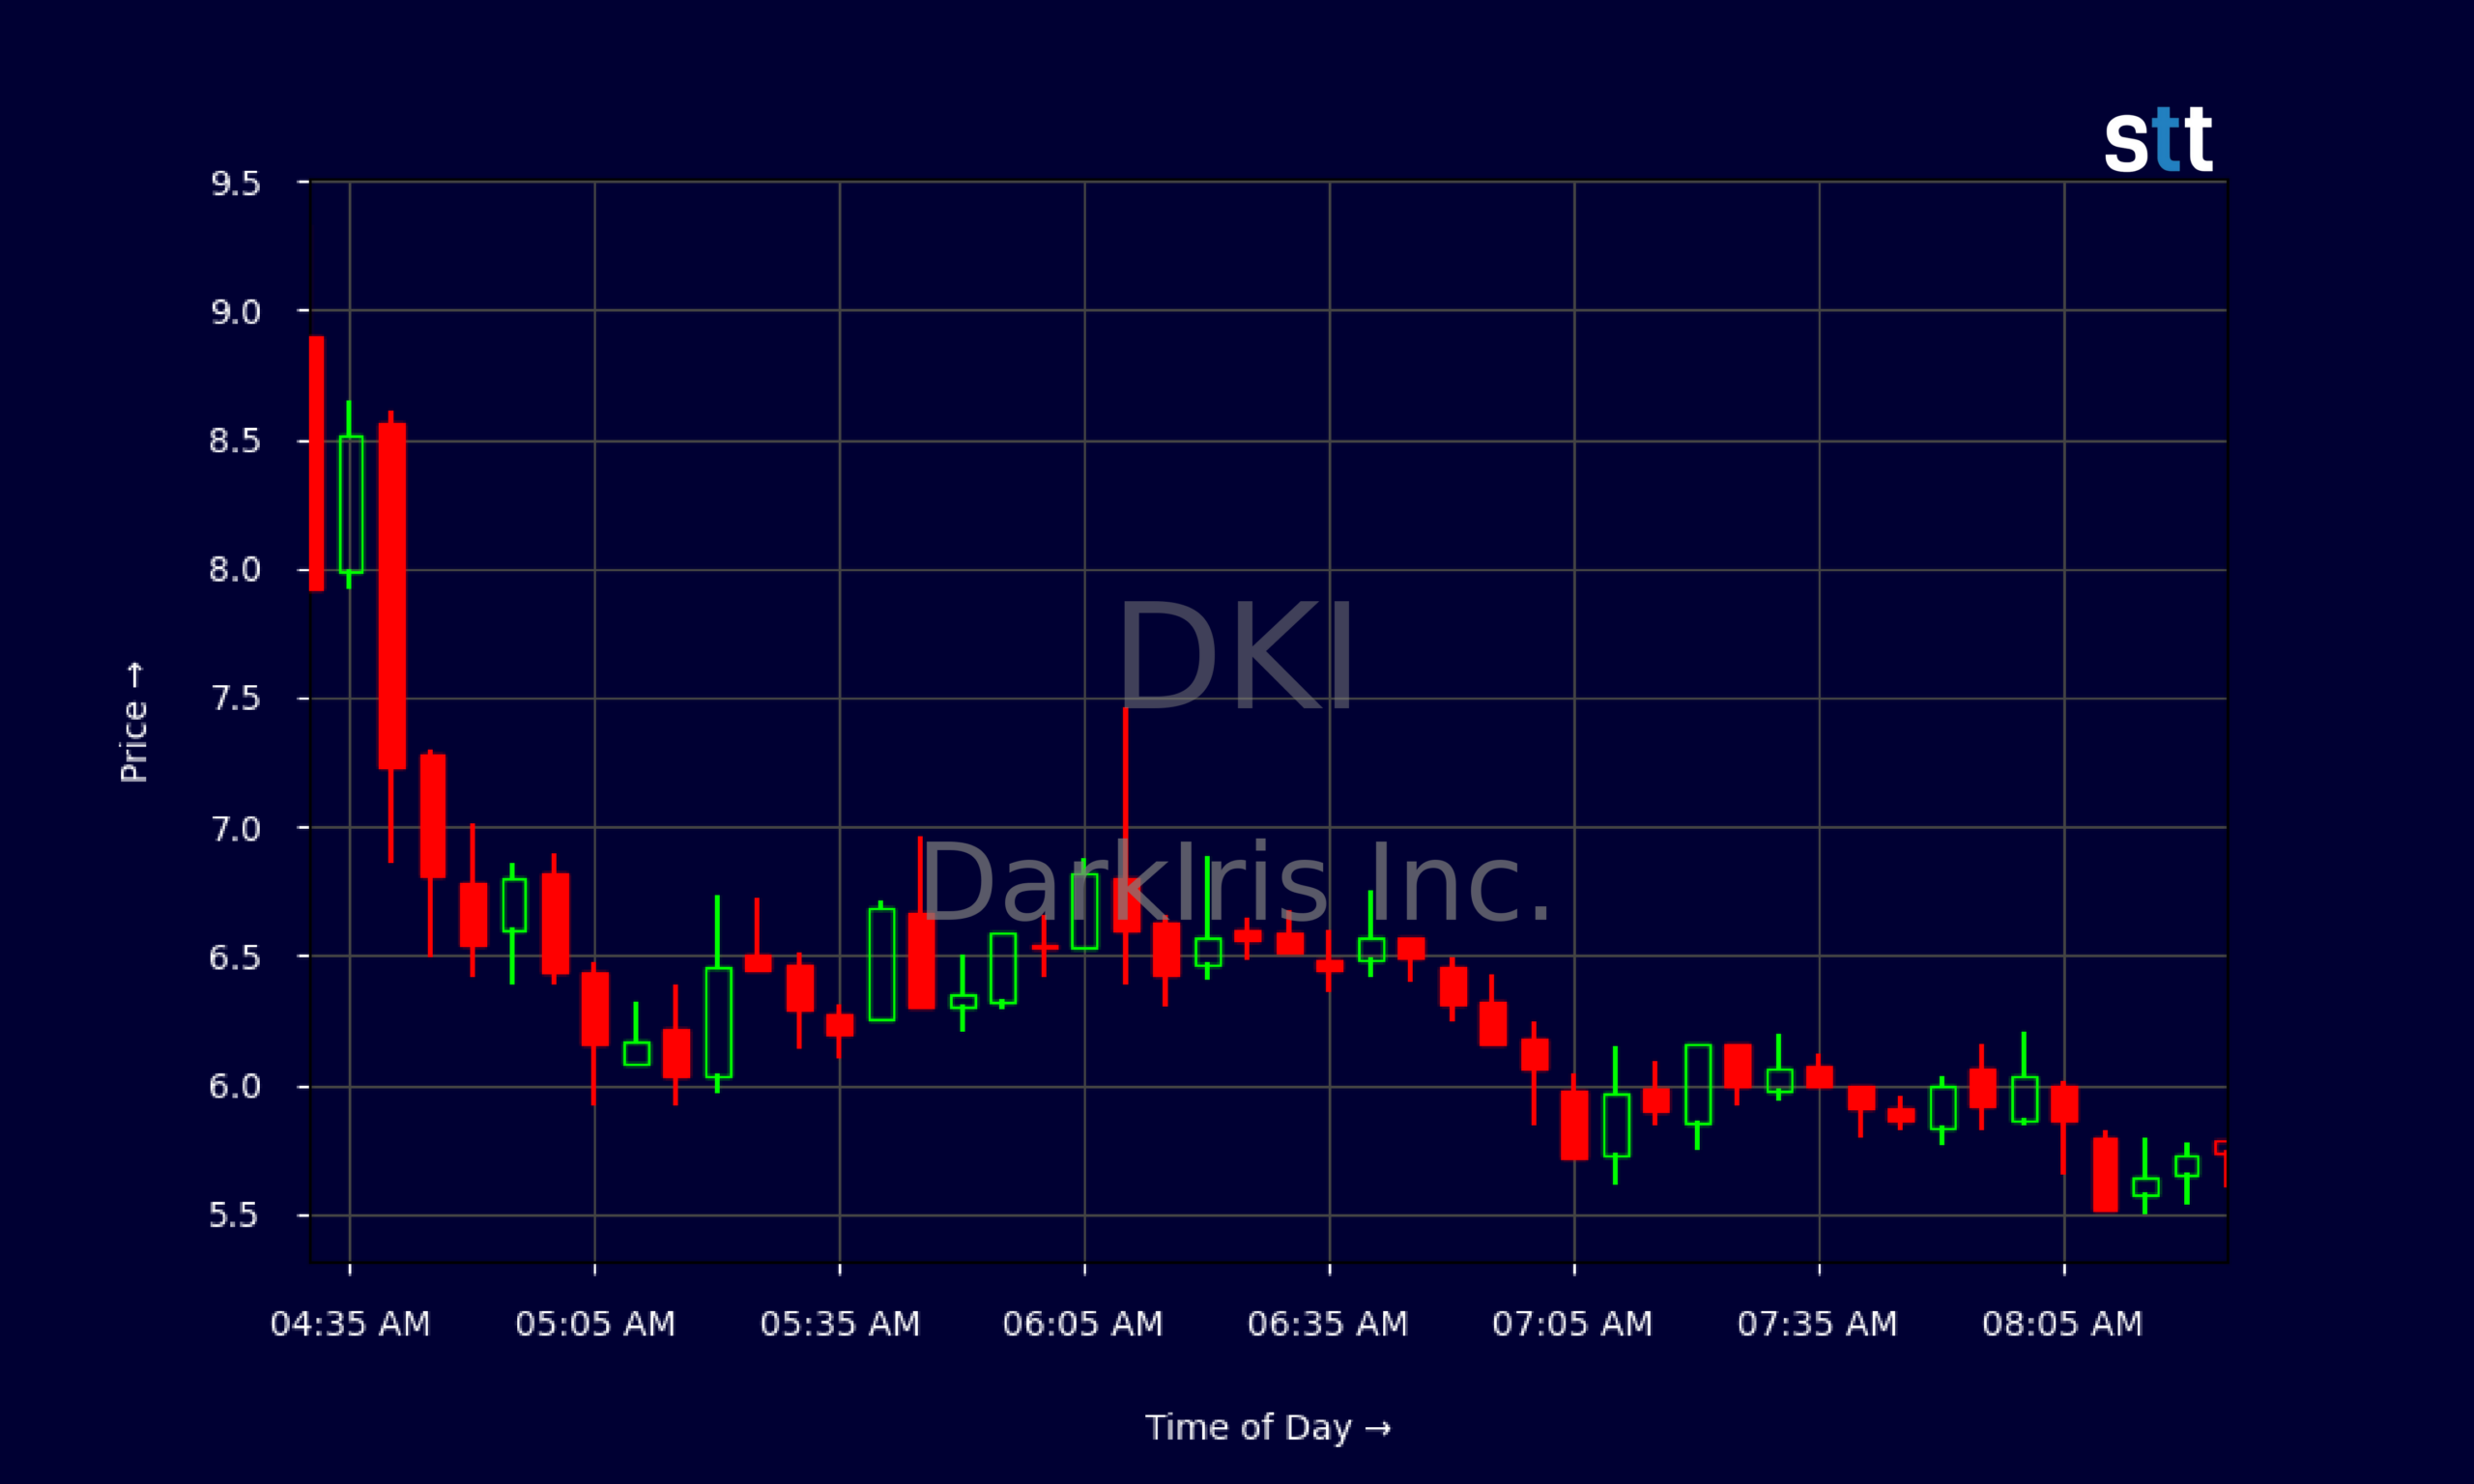
Live Update At 08:32:18 EDT: On Monday, August 10, 2026 DarkIris Inc. stock [NASDAQ: DKI] is trending up by 53.95%! Discover the key drivers behind this movement as well as our expert analysis in the detailed breakdown below.
Quick Financial Overview
DarkIris Inc., traded under ticker DKI, sits in that strange zone many small caps know well: decent fundamentals paired with wild trading. Revenue is about $10.1M, which is meaningful for a company this size, yet the market values DKI at only around 0.76 times sales. That low price-to-sales ratio tells traders the market is not paying a growth premium right now.
DKI also carries a book value per share of roughly $3.26. With shares recently closing around the mid-$3s, DarkIris Inc. trades only slightly above its balance-sheet value. For traders, that often acts like a magnet — dips toward book can attract dip buyers, while pops far above it invite profit-taking and short selling.
On the balance sheet, DKI reports about $8.45M in total assets and $6.78M of equity, with liabilities around $1.66M. That leaves leverage at a moderate level, with a reported leverage ratio of about 1.3. Cash of roughly $1.8M and working capital over $3M suggest DarkIris Inc. is not fighting for survival right this minute.
More Breaking News
- SPCX Slides As Policy Shocks And New Rivals Hit SpaceX
- WULF Stock Climbs As AI Data-Center Funding Risks Mount
- WKHS Stock Draws Traders As EV Orders Grow And AI Pivot Emerges
- MSTR Stock Holds Key Range As Volatility Tightens
The big red flag is efficiency. Return on capital shows a steep negative figure, a sign DKI has yet to turn its assets into strong profits. For traders, that means the story is less about steady growth and more about short-term price action and sentiment swings.
Why Traders Are Watching DKI Price Action
DKI is lighting up scanners mainly because of its chart. On the daily timeframe, DarkIris Inc. has slid from above $5 in mid recent sessions to around $3.67. That’s a meaningful drawdown and often where experienced traders start looking for panic lows, failed breakdowns, or dead-cat bounces.
The daily candles show a steady bleed: closes stepping down from $5.10 to the low $4s, then under $4, and now the high $3s. Each bounce is getting sold. For many short-term traders, DKI is acting like a broken momentum chart, but that also lays the groundwork for sharp relief rallies when sellers finally exhaust.
Zoom into the intraday 5-minute chart and the picture gets even more intense. DKI ripped from around $5.40 at the open up toward the low $10s, with multiple swings of $1 or more in minutes. DarkIris Inc. printed a huge spike above $9–$10, then gave back a big chunk, then tried to bounce again. That’s classic day-trading territory: liquidity, range, and emotional moves.
These moves tell a simple story. DKI is a battleground between breakout chasers and profit-takers. Traders who specialize in volatility watch names like DarkIris Inc. because they offer clean risk levels — for example, prior intraday lows or volume-packed levels near $7–$8 — and big dollar-per-share potential if the move continues.
Technical traders are also eyeing the recent support band around $3.50–$3.70 on the daily chart. If DKI holds that zone and starts to curl back up, you could see shorts trapped and momentum players pile in again. If it cracks convincingly, DarkIris Inc. becomes a short-bias play down toward or even below book value.
Conclusion
For active traders, DKI is a case study in how price, volume, and fundamentals collide. DarkIris Inc. has real revenue, a positive equity base, and enough cash to keep the story alive, but it is not a polished, steady compounder. It trades more like a speculative vehicle whose value is driven by crowd emotion and short-term expectations.
That’s why charts matter so much here. The recent downtrend on the daily, combined with violent intraday spikes, says DKI is in the hands of fast money. Breakouts above prior intraday highs near $9–$10 or breakdowns below daily support in the high-$3s are likely to be the next big signals traders watch.
The key is discipline. Names like DarkIris Inc. can make or break a trading month if you size wrong or ignore your plan. Tight risk management, clear levels, and quick decision-making matter more than any story. As Tim Bohen, lead trainer with StocksToTrade says, “Success in trading is more about cutting losses quickly than finding winners.” That mindset is crucial when dealing with volatile tickers like DKI.
As Tim Sykes likes to say, “I don’t trade companies, I trade the chart — patterns repeat, but you have to cut losses quickly and never fall in love with a stock.” DKI gives traders exactly that type of pattern-rich battlefield. Used correctly, it’s a powerful training ground. Used recklessly, it’s a fast way to learn expensive lessons. This analysis is for educational and research purposes only, and every trader must do their own homework before taking any trade.
This is stock news, not investment advice. StocksToTrade News delivers real-time stock market updates tailored to highlight the key catalysts driving short-term price movements. Our coverage is designed for active traders and investors who thrive in fast-moving markets, with a focus on volatile sectors like penny stocks, AI stocks, Robinhood stocks and other momentum plays. From earnings reports and FDA approvals to mergers, new contracts, and unusual trading volume, we break down the events that can spark significant price action.
Looking to level up your trading game? Explore StocksToTrade, the ultimate platform for traders. With powerful tools designed for swing and day trading, integrated news scanning, and even social media monitoring, StocksToTrade keeps you one step ahead.
Check out our quick startup guide for new traders!
- How to Read Stock Charts: A Guide for Beginners
- Trading Plan: 6 Steps to Create One
- How To Create a Stock Watchlist
Ready to build your watchlists? Check out these curated lists:
Once your watchlist is set, take the next step and trade with confidence using StocksToTrade’s robust platform. Don’t miss out — grab your 14-day trial for just $7 and experience the edge you need to thrive in today’s fast-paced markets.