

Cohu Inc. rallied as strong semiconductor equipment demand drove optimism, and its stocks have been trading up by 14.05 percent.
What Traders Need To Know
- Management will appear at two upcoming semiconductor-focused conferences hosted by Needham and Jefferies, with materials posted on Cohu Inc.’s investor relations site.
- A Form 4 filing on 2026/08/06 showed a change in insider beneficial ownership, but without details on whether it was a buy, sale, or grant.
- Additional Form 4 filings on 2026/08/18 and 2026/08/21 also reported insider ownership changes, again with no data on size, price, or direction.
- Recent weekly candles show COHU bouncing from the low $40s into the low $50s, signaling renewed momentum after brief weakness.
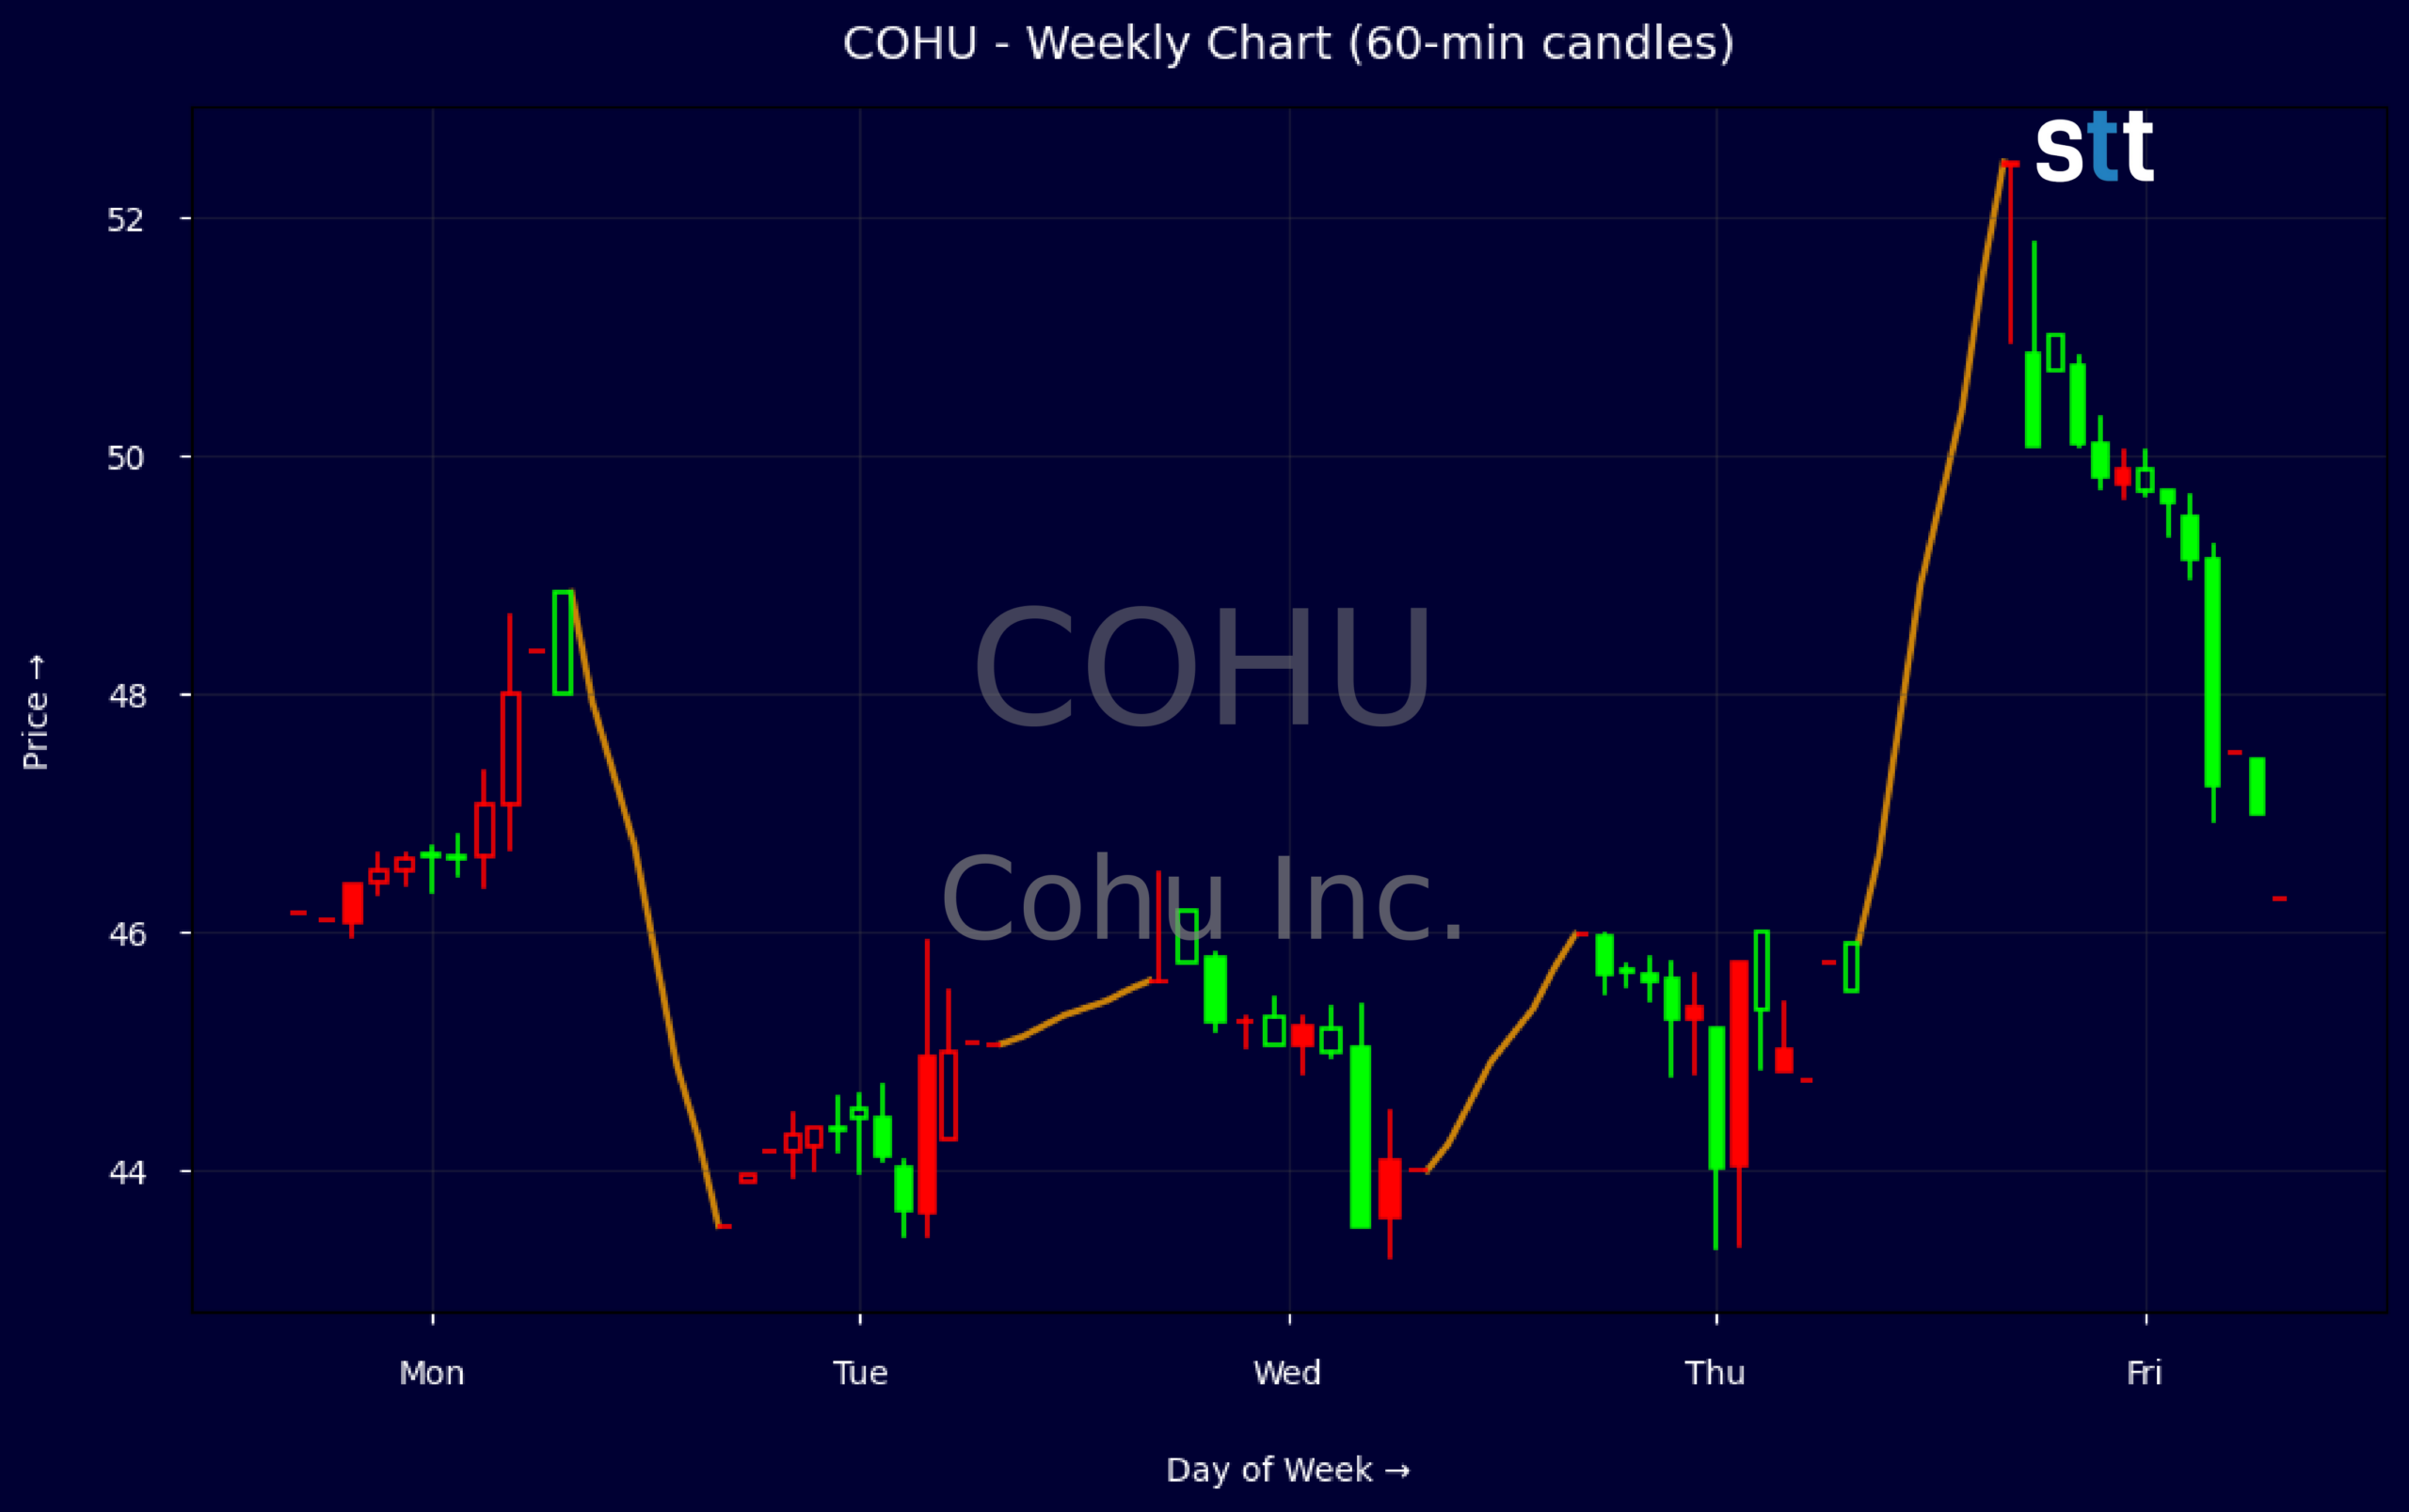
Weekly Update Aug 31 – Sep 04, 2026: On Saturday, September 05, 2026 Cohu Inc. stock [NASDAQ: COHU] is trending up by 14.05%! Discover the key drivers behind this movement as well as our expert analysis in the detailed breakdown below.
Technology industry expert:
Analyst sentiment – positive
Cohu operates as a small but strategically positioned player in semiconductor test and inspection, with high 75% gross margin but currently subscale and under-absorbed, driving negative EBIT margin and trailing losses. Revenue contraction over 3–5 years reflects cyclical test equipment demand and share pressure. Balance sheet strength is a clear positive: net cash, current ratio 5.7x, modest leverage, and positive free cash flow despite weak earnings. However, low ROIC and expensive P/CF and P/FCF multiples constrain upside near term.
Technically, the weekly sequence from 44.16 down to 43.53 then a sharp recovery into the low-50s signals an impulsive upside breakout after a brief shakeout. The 50.07–52.46 range defines a new resistance band now being tested, with 46–47 emerging as key support from prior congestion. Intraday 5-minute candles show expanding ranges and rising volume on up moves, consistent with accumulation. A concrete trading level: buy pullbacks toward 47 with a stop below 44 and an initial target at 55.
More Breaking News
- JDZG Stock Plunges As Volatility Grips Thinly Traded Name
- NCPL Plunges As SEC Fraud Charges Ignite Legal Firestorm
- SNDG ETF Slides As Volatility Pressures Bullish Traders
- NVDA Stock Rebounds As Traders Weigh Trump Sale News
Recent news flow is modestly constructive: conference participation should reinforce the narrative of positioning for the next semi test upcycle, while ambiguous Form 4 filings are noise absent evidence of heavy selling. Relative to broader Tech and Semi Equipment peers, Cohu offers cleaner balance sheet but weaker growth and returns, warranting a discount multiple. Base case: accumulation zone at 46–48, strong support near 44, resistance 55–58. Twelve-month fair value range: 55–60, skewing moderately positive.
Quick Financial Overview
Cohu Inc. (COHU) is trading in a short-term rebound phase. Weekly data show price dipping from about $46 to $43, then snapping back above $45 and pushing into the low $50s, with a recent close near $52. That pattern tells traders the $43–$45 area is acting as support for now, while the quick surge into the low $50s marks a potential new resistance zone to watch.
On the intraday side, COHU rallied hard within a single recent session, running from roughly $47 on the open to above $50 by the close, with a high near $50.80. That kind of wide intraday range often reflects aggressive short covering or new momentum money stepping in. For short-term traders, those intraday highs and lows now frame the key levels for breakout or failed-rally setups.
Fundamentally, Cohu Inc. generated about $149.0M in quarterly revenue and roughly $675.9M in gross profit over the last reported quarter, implying a very strong gross margin near 75%. Yet bottom-line margins are thin to negative, with EBIT margin around -6.5% and profit margin near -7.4%, which means operating leverage is cutting the wrong way. Revenue trends remain soft as well, with 3-year and 5-year revenue growth both negative.
The balance sheet is a clear positive for COHU. Cash, cash equivalents, and short-term investments sit near $498.2M, against total debt of about $285.0M and a total debt-to-equity ratio of only 0.38. Liquidity looks solid, with a current ratio of 5.7 and a quick ratio of 4.5, giving the company room to manage through a weak demand patch. From a valuation angle, a price-to-sales ratio around 4.2 and price-to-book near 2.8 suggest the market is already pricing in a fair amount of future recovery.
Conclusion
COHU: Price Action, News, And Risk-Reward
For traders, Cohu Inc. sits at an interesting balance point. The chart is flashing short-term strength, with the rebound from the low $40s to the low $50s and a strong intraday spike from $47 into the $50s. That move, paired with the clear support band around $43–$45, sets up a clean technical map: momentum holds as long as price stays above that zone, while a break back below would signal that this bounce was just a fade.
On the news side, the upcoming Needham and Jefferies semiconductor conferences tell us COHU management is staying visible but do not, by themselves, provide a hard catalyst. The cluster of Form 4 filings in August 2026 does draw attention to insider ownership, yet the lack of detail on whether these were buys, sells, or grants means traders cannot lean bullish or bearish from those filings alone. Financially, strong gross margins and a solid balance sheet are positives, but negative operating margins and weak multi-year revenue trends keep the risk profile elevated.
For educational and research purposes, traders should treat COHU as a tactical name: respect the recent momentum, but anchor decisions around clear price levels and risk limits. As Tim Bohen, lead trainer with StocksToTrade says, “A good trade setup checks all the boxes—volume, trend, catalyst. Don’t trade if you’re missing pieces of the puzzle.” That philosophy applies directly here: COHU’s price action, liquidity, and news flow all need to align before traders size into a position. As I tell my own students, “The edge is not in predicting the next headline for COHU, it is in defining your levels, managing your risk, and letting the tape confirm your bias before you size up.”
This is stock news, not investment advice. StocksToTrade News delivers real-time stock market updates tailored to highlight the key catalysts driving short-term price movements. Our coverage is designed for active traders and investors who thrive in fast-moving markets, with a focus on volatile sectors like penny stocks, AI stocks, Robinhood stocks and other momentum plays. From earnings reports and FDA approvals to mergers, new contracts, and unusual trading volume, we break down the events that can spark significant price action.
Looking to level up your trading game? Explore StocksToTrade, the ultimate platform for traders. With powerful tools designed for swing and day trading, integrated news scanning, and even social media monitoring, StocksToTrade keeps you one step ahead.
Check out our quick startup guide for new traders!
- How to Read Stock Charts: A Guide for Beginners
- Trading Plan: 6 Steps to Create One
- How To Create a Stock Watchlist
Ready to build your watchlists? Check out these curated lists:
Once your watchlist is set, take the next step and trade with confidence using StocksToTrade’s robust platform. Don’t miss out — grab your 14-day trial for just $7 and experience the edge you need to thrive in today’s fast-paced markets.