
Click Holdings Limited stocks have been trading down by -12.79 percent amid sharply negative sentiment over its latest financial results.
Click Here for a Millionaire's POV on Trading CLIK
SUBSCRIBE FOR ALERTSJOIN 50,000+ ACTIVE TRADERS
Key Takeaways
- Price action in CLIK shows a sharp intraday spike above $1.60 followed by a hard fade back toward $1.10 support.
- Click Holdings Limited trades around one-tenth of annual revenue, signaling deep-value territory on a price-to-sales basis.
- The balance sheet for CLIK shows over $10M cash and relatively low long-term debt, giving the company breathing room.
- Daily chart for CLIK is stuck in a tight $1.06–$1.17 range, with clear resistance near $1.30–$1.35.
- Traders are eyeing liquidity pockets around $1.10 support and $1.30 resistance for short-term setups in CLIK.
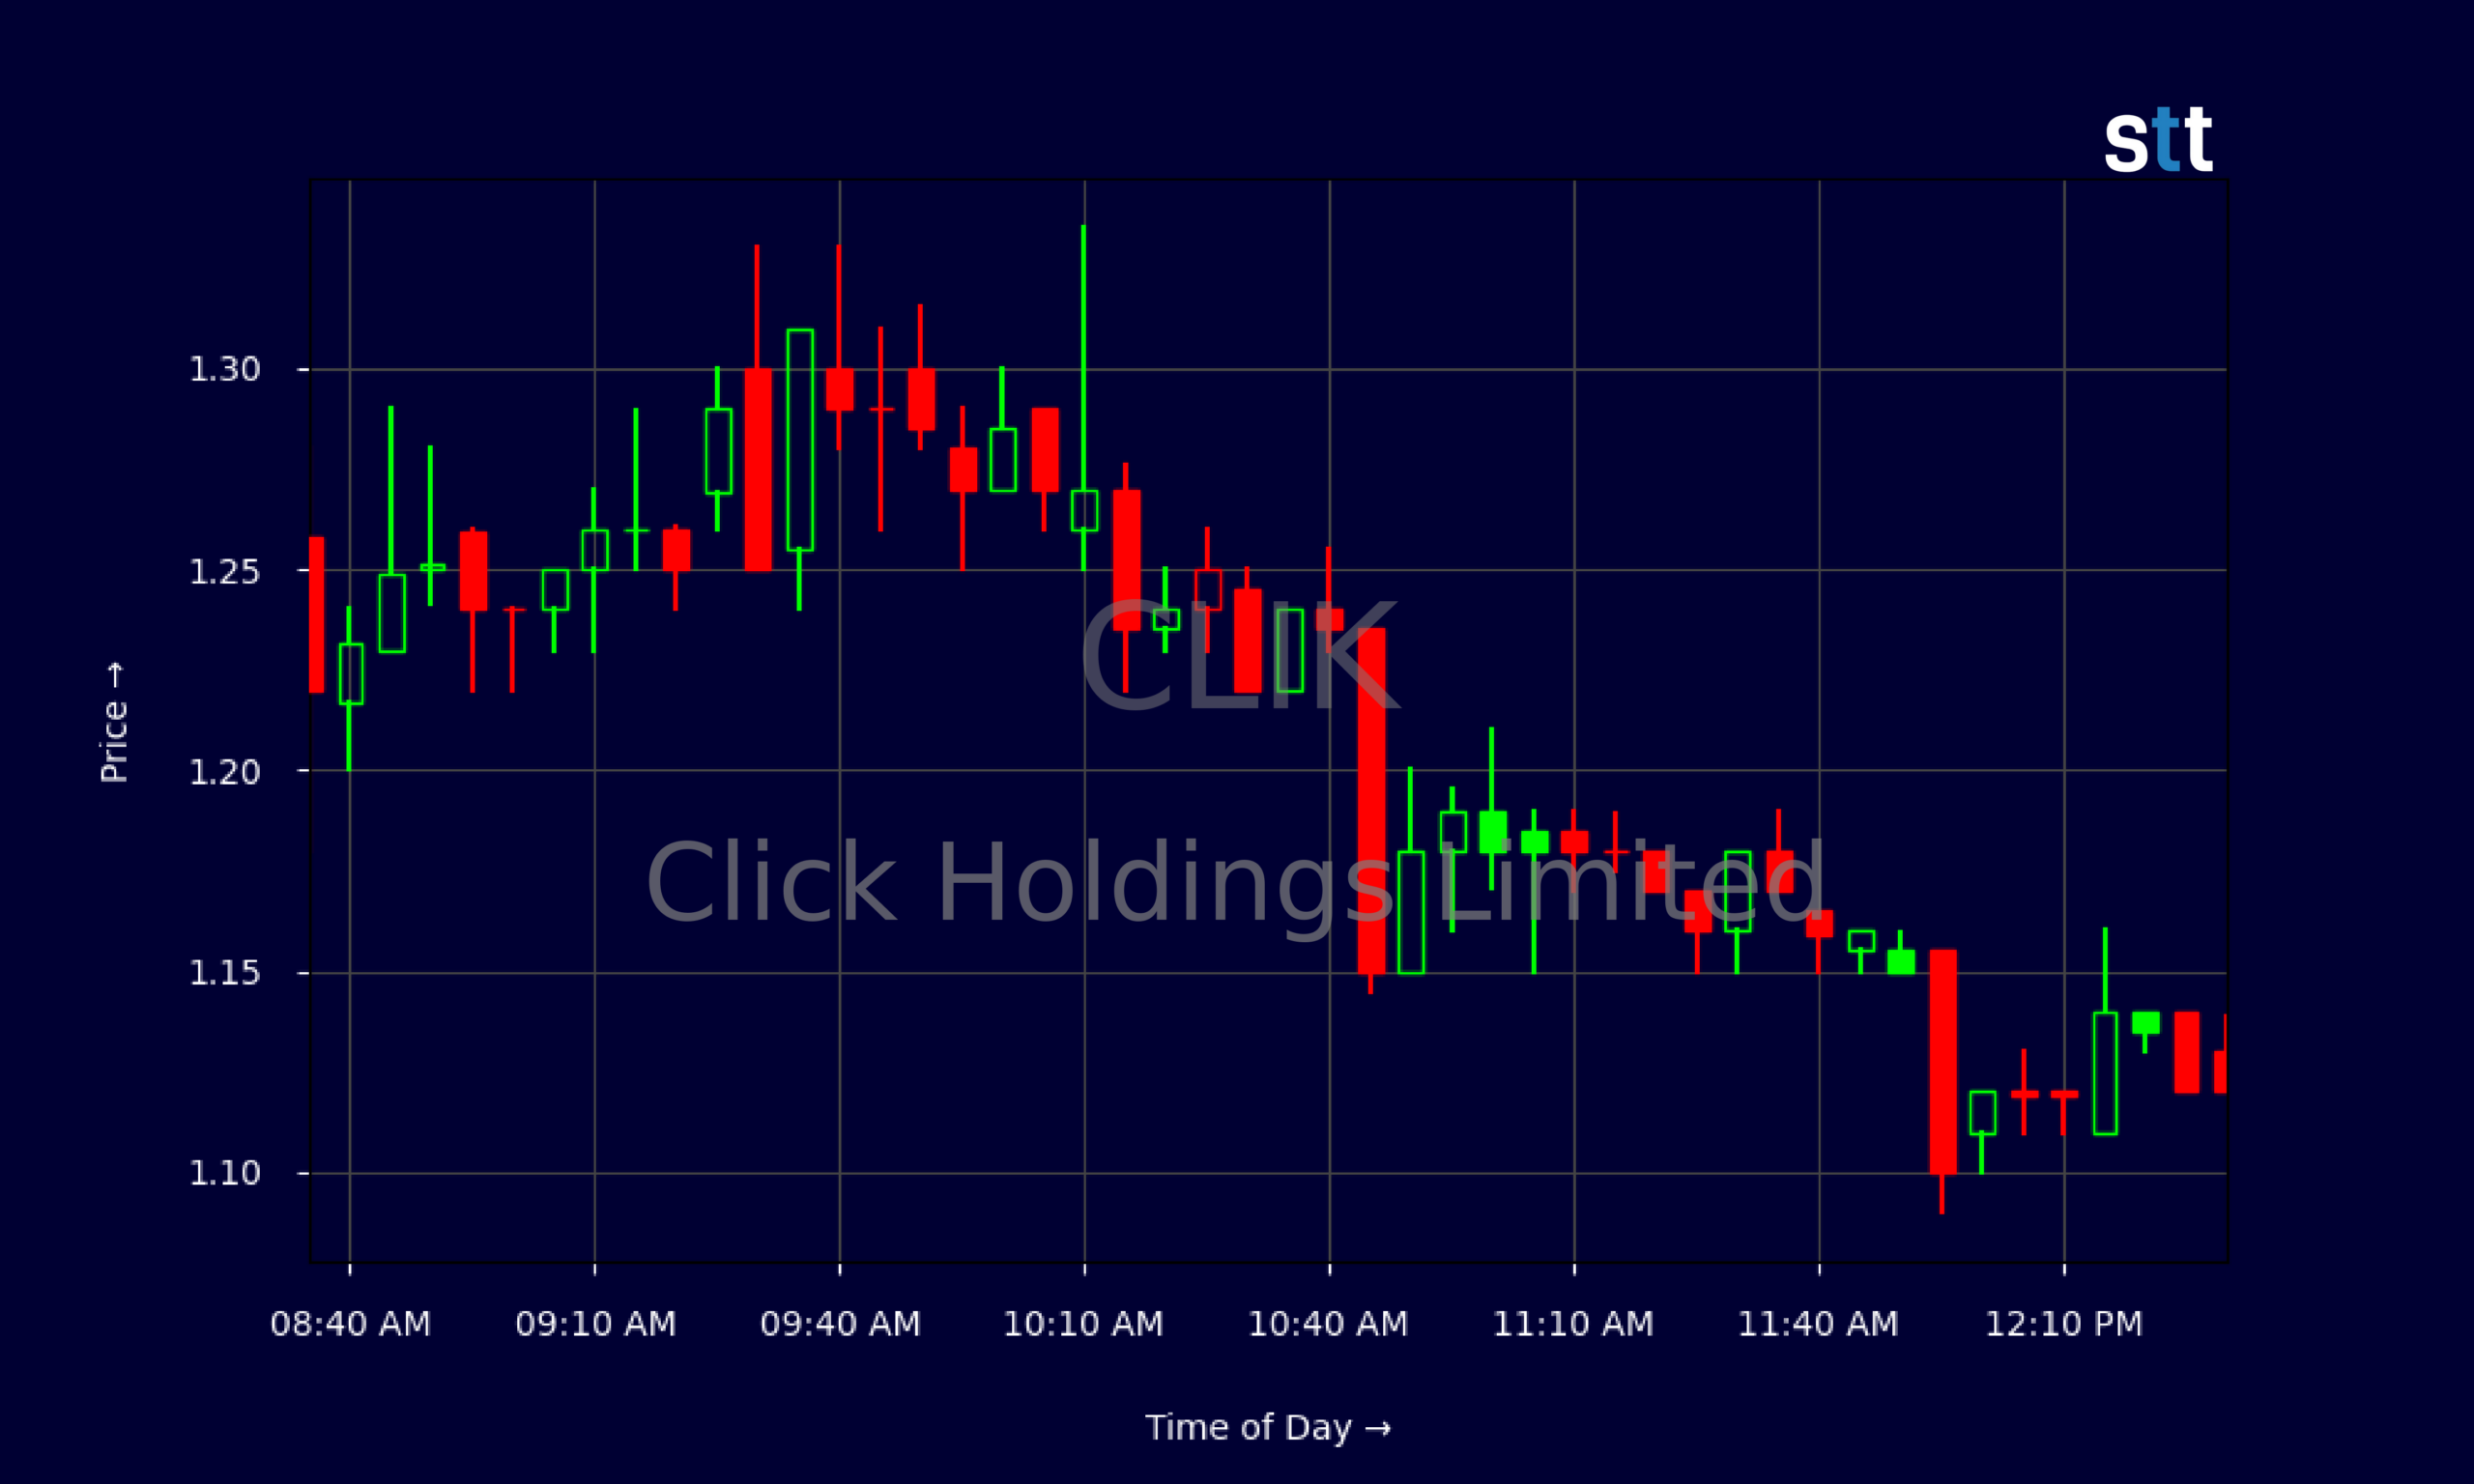
Live Update At 12:35:28 EDT: On Friday, October 23, 2026 Click Holdings Limited stock [NASDAQ: CLIK] is trending down by -12.79%! Discover the key drivers behind this movement as well as our expert analysis in the detailed breakdown below.
Quick Financial Overview
CLIK is trading like a classic low-priced, deep-value name. Click Holdings Limited is posting revenue of about $83.5M, while the whole company is valued by the market at roughly 0.11 times sales. That means traders are paying around 11 cents for every dollar of revenue, a sign the crowd has low expectations baked into the current CLIK price.
Book value per share sits near $11.87, while CLIK trades barely above $1. This massive discount to book tells traders the market is either aggressively discounting the quality of assets, worried about future earnings power, or simply ignoring the name. At the same time, Click Holdings Limited shows total assets of about $141.4M against total liabilities near $20.0M, with cash of roughly $10.6M.
More Breaking News
- AT&T Stock Slips As Strong Cash Flows Meet Subscriber Jitters
- SPCX Stock Jumps As Q3 Profit, Tesla Merger Talk Ignite AI Hype
- META Stock Slides As Legal Bills And AI Spending Pile Up
- SPCX Slides As SpaceX Faces Geopolitics, Competition, And AI Risk
Leverage looks contained, with a modest long-term debt load and a leverage ratio of 1.4. Return on capital for CLIK is negative at around -14.2%, which signals the business is not currently generating strong returns from its asset base. For short-term traders, that mix of low valuation, weak profitability, and clean-enough balance sheet often sets the stage for sharp sentiment-driven moves.
Why Traders Are Watching CLIK Price Action
The chart alone is enough to put CLIK on day-traders’ radar. On the intraday tape, Click Holdings Limited ramped from the low $1.30s premarket to a spike high near $1.65 around 08:20, then flushed all the way into the $1.20s and ultimately closed near $1.12. That kind of round trip in a sub-$2 stock screams emotional trading and offers multiple momentum windows for disciplined scalpers.
Zooming out to the daily data, CLIK has spent most of the past few weeks bouncing between about $1.06 and $1.17, with a recent breakout attempt toward $1.65 that failed. Each push into the $1.30–$1.35 area attracted sellers, and Click Holdings Limited rolled over. For pattern-focused traders, that sets a very clear level: until CLIK closes and holds above that band, the move is just noise inside a bigger range.
At the same time, the low end around $1.06–$1.09 has been defended several times. Every dip into that zone on the CLIK chart has found buyers, at least for a short bounce. Range-bound names like Click Holdings Limited can reward traders who buy near support and sell into strength, as long as they respect risk and keep size under control.
With only 14 employees and a heavy dose of goodwill and intangibles on the balance sheet, CLIK is not some massive, steady blue chip. It’s a small, thin name where sentiment flips can drive big relative moves. That’s exactly the kind of backdrop aggressive traders like to study, especially when the price-to-sales and price-to-book numbers sit this low.
Conclusion
For active traders, CLIK is a lesson in how price, value, and sentiment can disconnect for long stretches. Click Holdings Limited posts solid top-line revenue and carries over $10M in cash, yet the market prices the stock at a steep discount to both sales and book value. That gap tells traders the crowd is focused on execution risk and weak returns on capital, not on asset value.
On the chart, CLIK shows exactly the type of intraday behavior that rewards preparation. A morning spike toward $1.65, followed by steady selling down into the $1.10s, gave both breakout chasers and fade traders something to work with. The key is knowing your levels before the bell. For Click Holdings Limited, those levels are shaping up around $1.06–$1.09 support and $1.30–$1.35 resistance.
Traders studying CLIK should treat it as a case study in liquidity pockets, risk management, and range trading. As Tim Sykes likes to say, “The market doesn’t owe you anything, but it does leave clues every day if you’re willing to study.” And as Tim Bohen, lead trainer with StocksToTrade says, “Time and experience have taught me that missed opportunities are part of the game. There’s always another setup around the corner.” CLIK is leaving those clues in both its financials and its tape. Use them for education and research, set tight risk, and let the price action of Click Holdings Limited guide your trading plan.
This is stock news, not investment advice. StocksToTrade News delivers real-time stock market updates tailored to highlight the key catalysts driving short-term price movements. Our coverage is designed for active traders and investors who thrive in fast-moving markets, with a focus on volatile sectors like penny stocks, AI stocks, Robinhood stocks and other momentum plays. From earnings reports and FDA approvals to mergers, new contracts, and unusual trading volume, we break down the events that can spark significant price action.
Looking to level up your trading game? Explore StocksToTrade, the ultimate platform for traders. With powerful tools designed for swing and day trading, integrated news scanning, and even social media monitoring, StocksToTrade keeps you one step ahead.
Check out our quick startup guide for new traders!
- How to Read Stock Charts: A Guide for Beginners
- Trading Plan: 6 Steps to Create One
- How To Create a Stock Watchlist
Ready to build your watchlists? Check out these curated lists:
Once your watchlist is set, take the next step and trade with confidence using StocksToTrade’s robust platform. Don’t miss out — grab your 14-day trial for just $7 and experience the edge you need to thrive in today’s fast-paced markets.