
ClearOne Inc. stocks have been trading up by 18.77 percent amid strong investor optimism driven by the most impactful news.
Click Here for a Millionaire's POV on Trading CLRO
SUBSCRIBE FOR ALERTSJOIN 50,000+ ACTIVE TRADERS
Key Takeaways
- CLRO has swung from $5.00 down to the low $3s this month, showing extreme volatility that active traders thrive on.
- Intraday action in ClearOne Inc. shows heavy morning range expansion followed by choppy consolidation, ideal for short-term trading strategies.
- Recent CLRO financials highlight negative earnings and shrinking cash, putting the focus on balance‑sheet survival and cost control.
- ClearOne Inc. carries negative equity and relies on short‑term debt, a red flag that forces traders to respect risk and cut losses fast.
- Technical levels around $3.00 and $4.00 on CLRO are forming key battleground zones for momentum, breakouts, and potential failed spikes.
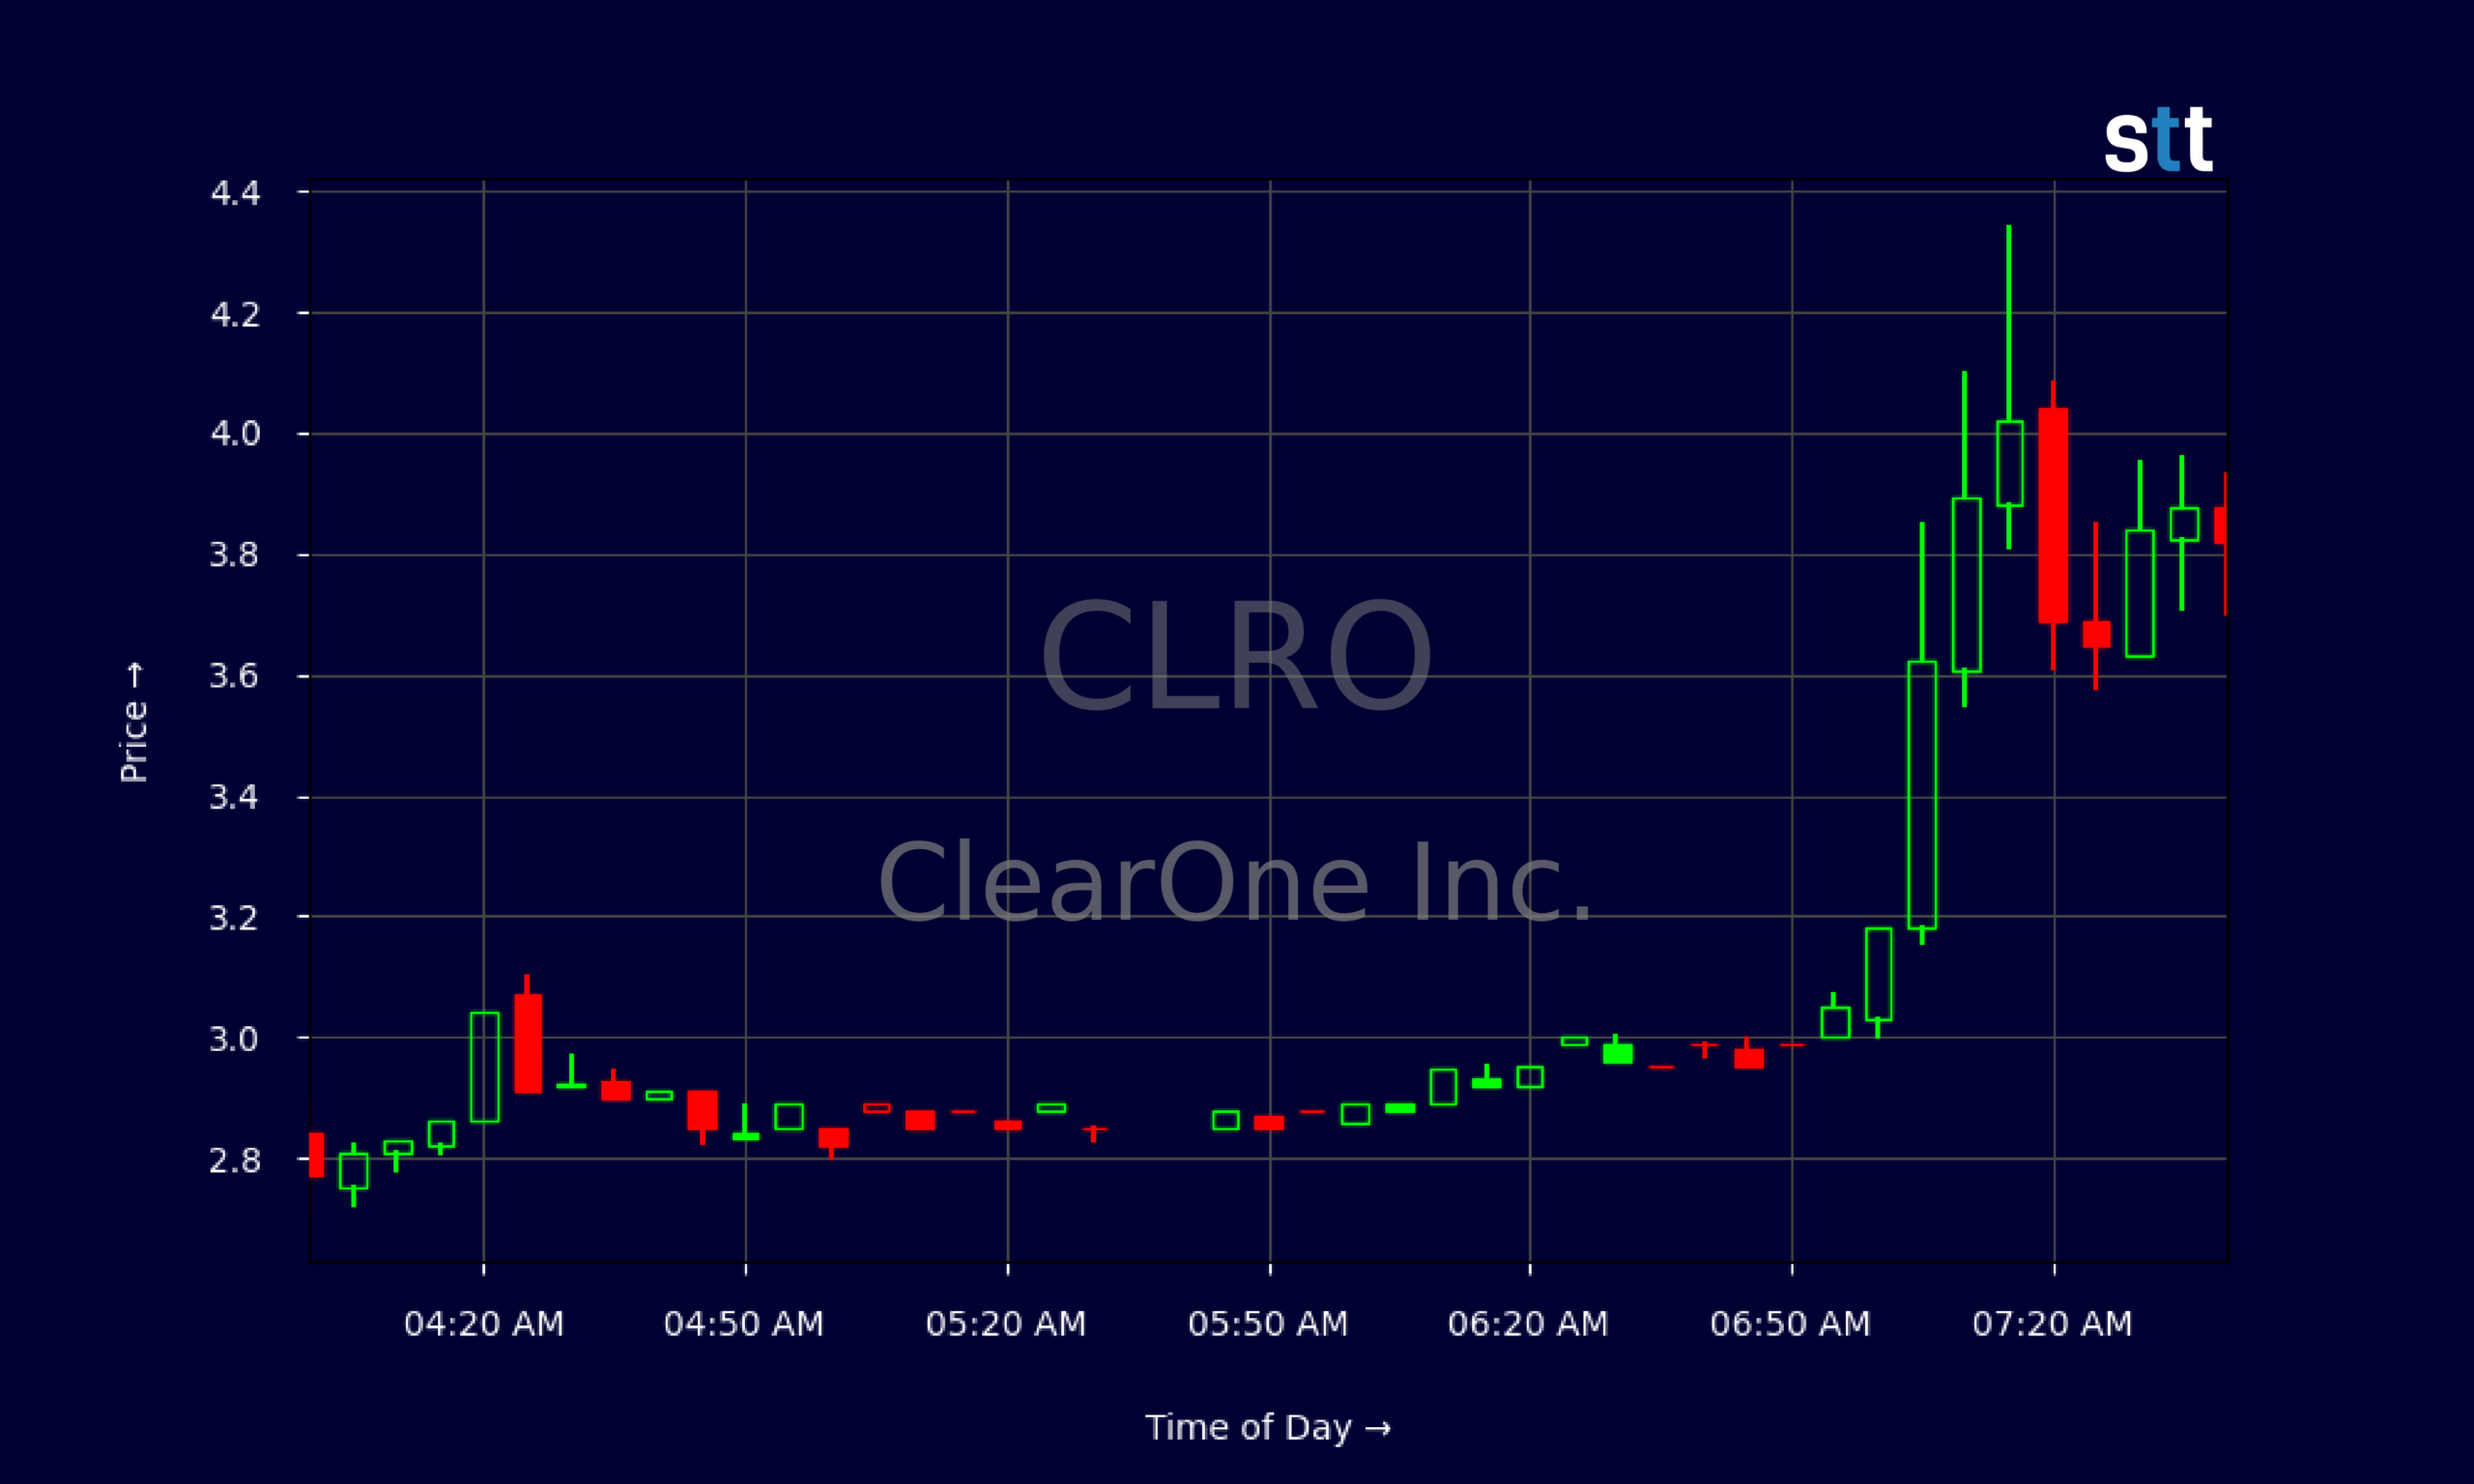
Live Update At 07:48:22 EDT: On Monday, October 26, 2026 ClearOne Inc. stock [NASDAQ: CLRO] is trending up by 18.77%! Discover the key drivers behind this movement as well as our expert analysis in the detailed breakdown below.
Quick Financial Overview
ClearOne Inc., trading under ticker CLRO, is a classic troubled microcap that still attracts aggressive momentum traders. The latest quarterly numbers show a company fighting just to stay afloat. CLRO reported about -$0.34 in earnings per share, with net loss near $914,000 for the quarter. That loss size matters when you remember there are only about 2,675,412 shares outstanding — every dollar of loss hits hard.
Revenue pressure is obvious. The data show revenue trends down sharply over the past three to five years, which lines up with a negative return on assets and a brutal negative return on equity. ClearOne Inc. is running with total assets of roughly $990,000 and total liabilities around $1,371,000, leaving stockholders’ equity at about -$381,000. That’s underwater.
More Breaking News
- ENVX Jumps As Drone Battery Deal Turns Pipeline Into Backlog
- BBD Stock Slips On HSBC Downgrade And Cautious Target
- NU Stock Holds Gains As Price Action Tightens
- XP Stock Grinds Higher As Traders Watch Key Levels
CLRO still has some liquidity, but it is thin. Current assets of about $976,000 barely cover current liabilities near $929,000, with a current ratio close to 1.1. The quick ratio, around 0.1, tells traders that without inventory, ClearOne Inc. has very little liquid cushion. A $500,000 short‑term debt facility recently boosted cash but adds pressure down the road. For CLRO, survival and dilution risk stay front and center in any trading plan.
Why Traders Are Watching CLRO’s Wild Price Swings
CLRO has become a pure price‑action story. On the daily chart, ClearOne Inc. spiked from a $5.00 open on 2026/10/01 to a high above $5.30, then faded over the next sessions. That early October push stalled, and CLRO bled down into the low $3s and even high $1s on some sessions. This is the pattern short‑term traders love: big range, clear failure, then potential dead‑cat bounces.
Look at 2026/10/23. CLRO opened near $1.97, ripped to an intraday high around $4.69, and closed at $3.25. That’s a monster range. ClearOne Inc. offered multiple setups in a single day — morning breakouts, midday exhaustion, and late pullbacks. For disciplined traders, those swings are opportunity. For anyone stubborn, they’re a fast way to blow up.
The 5‑minute chart confirms how wild CLRO trades. Around the early premarket and open, ClearOne Inc. ran from the low $2.80s into the low $4s, with candles showing sharp pushes and equally sharp pullbacks. That intraday volatility means bids can vanish and spreads can widen in seconds.
Technically, CLRO is carving out clear levels. The $5.00 area from early in the month marks overhead resistance. The $3.00 zone has turned into a battleground, with ClearOne Inc. repeatedly testing, reclaiming, and losing it. Below that, the $1.70–$2.00 range from mid‑month is a potential support area where prior panic selling slowed. Active traders are stalking CLRO for clean breakouts above these levels or failed spikes they can fade, but only with tight risk because one misstep on a microcap like this is costly.
Conclusion
CLRO sits at the intersection of ugly fundamentals and exciting charts, which is exactly where many day traders hunt. ClearOne Inc. is losing money, posting negative gross profit, and leaning on short‑term debt to plug cash holes. With only about $75,000 in cash on the balance sheet and a working capital cushion of roughly $47,000, CLRO cannot afford many more bad quarters. That fundamental stress often feeds the kind of “last‑chance” spikes and promotions traders see in troubled microcaps.
At the same time, the tape doesn’t lie. CLRO has given traders wide daily ranges, violent intraday reversals, and obvious technical levels to trade against. ClearOne Inc. above $4.00 behaves like a crowded momentum play; below $3.00 it trades like a broken stock hunting for a bottom. Both modes can be profitable for prepared traders, and brutal for anyone chasing. This is exactly the type of environment where traders must be crystal clear on their edge before clicking the buy or sell button. As Tim Bohen, lead trainer with StocksToTrade says, “If you’re still guessing at the end of your analysis, it’s probably not a trade worth taking.” That kind of clarity helps separate intentional trading from pure gambling in a name like CLRO.
The lesson from CLRO lines up with what Tim Sykes hammers home to his students: “The market doesn’t care about your opinion, it cares about your discipline. Cut losses quickly and the big wins will take care of themselves.” ClearOne Inc. is a real‑time case study in that mindset. Treat CLRO as a fast, dangerous vehicle — useful for education and research, never something to marry. Traders who map the key levels, size small, and stay nimble will get the most value from this kind of setup, whether they trade it or simply study how it moves.
This is stock news, not investment advice. StocksToTrade News delivers real-time stock market updates tailored to highlight the key catalysts driving short-term price movements. Our coverage is designed for active traders and investors who thrive in fast-moving markets, with a focus on volatile sectors like penny stocks, AI stocks, Robinhood stocks and other momentum plays. From earnings reports and FDA approvals to mergers, new contracts, and unusual trading volume, we break down the events that can spark significant price action.
Looking to level up your trading game? Explore StocksToTrade, the ultimate platform for traders. With powerful tools designed for swing and day trading, integrated news scanning, and even social media monitoring, StocksToTrade keeps you one step ahead.
Check out our quick startup guide for new traders!
- How to Read Stock Charts: A Guide for Beginners
- Trading Plan: 6 Steps to Create One
- How To Create a Stock Watchlist
Ready to build your watchlists? Check out these curated lists:
Once your watchlist is set, take the next step and trade with confidence using StocksToTrade’s robust platform. Don’t miss out — grab your 14-day trial for just $7 and experience the edge you need to thrive in today’s fast-paced markets.